Characterization of digital image noise properties based ... - CiteSeerX
Recommend Documents
Moreover, it reviews some of the techniques and algorithm used in image ... embedding a host image with information which is called watermark, then the ...
Key-Words: - CMOS, integrated amplifier, measurement, noise, PPS, ... PPS of the matrix associated to the amplifier. ... N+ diffusion or N well on a P substrate.
An experimental noise estimate of 50% was confirmed ac- curate by .... and Canon PowerShot G6) were used for image acquisition, and connected to an image ..... The small initial pre-load was introduced applied during sample mount-.
These can be divided into two broad categories, those working in the spatial / time ... signatures create confusion with digital signatures used in cryptography.
signatures create confusion with digital signatures used in cryptography. They are destroyed as soon as the object is modified too much, and they are useful in ...
transfer text messages by hiding them in a digital image file. A combination of Steganography and encryption algorithms provides a strong backbone for its ...
Keywords: Chicken nugget quality, Gage repeatability and reproducibility, Image-based analysis, Principal .... (Montgomery, D.C. and Runger, G.C., [11]). This.
The large availability of multimedia data in digital format and its distribution on Internet has in ..... [13] I. Pitas, A method for signature casting on digital images, ...
Sep 17, 2012 - Downloaded From: http://electronicimaging.spiedigitallibrary.org/ on 11/06/2012 Terms of Use: http://spiedl.org/terms ... Image noise removal is the first step in image processing, ... Digital images play an important role in numerous
4-1 PSD of Kulite, Endevco, UF piezoresistive and UF Proximity sensor at 0 Volt without setup noise. .... 4-30 Power spectral density of UF proximity sensor with free membrane at zero biased voltage. ...... converting acoustic energy into electrical
in a fixed observation interval will result in a number that obeys Poisson statistics. ... this field is readout at the specified pixel rate while at the same time the next field is being .... also reduces that impact of hot-spots or hot-pixels by th
Zealand College of Radiologists (ANZCR) and. Australasian College of Physical Scientists and Engineers in Medicine (ACPSEM) are developing national.
Samit Basu from GE for the access to the real data and their thoughful
discussions. I'm deeply indebted to my parents, Yu Zhang and Yuping Gao,
whose ...
Method Detection and quantification of cracks in concrete bridges pose various challenges. ... used as a tool for post-earthquake damage evaluation purposes. ... Before carrying out any detailed inspection for repair ... Ontario Structure Inspection
thin nanomaterials using computer vision techniques .... three separate computer vision algorithms were developed in Python using the Spyder integrated.
The camera setting is set to manual mode with ISO400 ... (AIAG [1]), therefore, the measurement system is capable of .... surement System Analysis (MSA), 3rd edition,. Michigan ... Statistics and Probability for Engineers, 4th, New. York: John ...
Jun 22, 2016 - senberger TK18.400.100 (Wipperfürth, Germany) attached to a PID temperature controller (Eurotherm 3508, Limburg,. Germany) so that ...
Jun 22, 2016 - harmonic twist rotations were applied with maximum ampli- tudes of 0.2% .... broad LVR when compared to previously reported LVRs [29].
A highly influential factor in the performance of image processing algorithms is the amount of noise present in the digital image. A priori knowledge of the ...
hand-held instrument essentially consisting of an internal .... hand-held instrument for outdoor measurements of the grain ... Mechanics of the ski-snow contact.
Support for this work has been provided by the government of. Thailand. ABAQUS was provided under academic license by HKS. Inc., Providence, Rhode Island ...
May 19, 2017 - In most digital schemes the Analog to Digital Converters (ADCs) set the ultimate ... technique based on the use of a Graychip and down-.
In the table 4.2, v refers to the variance & Q refers to the quality factor. For all the attacking operations Adobe Photoshop is used and the code is built in Mat lab 7.
Characterization of digital image noise properties based ... - CiteSeerX
In this paper, image noise characterization based on digital camera RAW data is ... The digital camera RAW data is read into MATLAB® using code based on ..... Foveon X3F® technology, http://www.x3f.info/sd9/v2_0/english.html (Referred ...
Copyright 2005 SPIE and IS&T. This paper was published in: Image Quality and System Performance III, eds. Luke C. Cui, Yoichi Miyake. Proc. Of SPIE-IS&T Electronic Imaging, SPIE Vol. 6059, 60590A and is made available as an electronic reprint with permission of SPIE and IS&T. One print or electronic copy may be made for personal use only. Systematic or multiple reproduction, distribution to multiple locations via electronic or other means, duplication of any material in this paper for a fee or for commercial purposes, or modification of the content of the paper are prohibited.
Characterization of digital image noise properties based on RAW data Heli T. Hytti* Tampere University of Technology, Institute of Measurement and Information Technology P.O.Box 692, FIN-33101 Tampere, Finland ABSTRACT In this paper, image noise characterization based on digital camera RAW data is studied and three different imaging technologies are compared. The three digital cameras used are Canon EOS D30 with CMOS sensor, Nikon D70 with CCD sensor and Sigma SD10 with Foveon X3 Pro 10M CMOS sensor. Due to different imaging sensor constructions, these cameras have rather different noise characteristics. The applicability of different analysis methods to these different sensor types is also studied. Digital image has several different noise sources. Separating these from each other, if possible, helps to improve image quality by reducing or even eliminating some noise components. Keywords: digital image, RAW data, noise characterization
1. INTRODUCTION Noise properties of digital cameras are under intensive research all around the world. Competition between digital camera manufacturers results in more and more advanced cameras with larger and larger imaging sensors with continuously advancing technology. In current research project between TUT/MIT and Nokia corporation, image noise characterization based on digital camera RAW data is being studied. Analysis is carried out using MATLAB®. The digital camera RAW data is read into MATLAB® using code based on Dave Coffin’s public domain software dcraw.c [1]. The code is modified to output 16-bit raw binary instead of PPM format. Digital image has several different noise sources, some of them fixed, some temporal, some are temperature dependent. Separating these from each other, if possible, helps to improve image quality by reducing or even eliminating some noise components. Since the physical background and statistical properties of these noise components is rather well known, this knowledge can be utilized in noise component separation. It is impossible to completely separate the noise components from each other by analyzing RAW data, but by applying several different measurement and analysis procedures their nature and relative impact on image quality can be evaluated. The goal is to achieve a relatively simple but statistically reliable measurement procedure for digital camera’s noise properties. The noise characteristics of the camera are analyzed by shooting numerous frames both in complete darkness (for dark signal and noise properties) with several exposure times and on different exposure levels with flat field target. Based on these measurements, several parameters describing camera’s noise characteristics and sensitivity are calculated. These parameters include for example camera gain constant (electrons/output digital number), dark signal nonuniformity, photoresponse nonuniformity and STDs of temporal noise and fixed pattern noise. Some sensor parameters, for example full well, can not be correctly determined from the RAW data due to limited A/D conversion range. In this paper, three different imaging technologies are compared. The three digital cameras used are Canon EOS D30 with CMOS sensor, Nikon D70 with CCD sensor and Sigma SD10 with Foveon X3 Pro 10M CMOS sensor. Due to *
different imaging sensor constructions, these cameras have rather different noise characteristics. The applicability of different analysis methods to these different sensor types is also studied.
2. BACKGROUND 2.1 Sensors Both CCD and CMOS sensors use color filter arrays to collect red, green and blue light in separate pixels (Bayer matrix). They accumulate signal charge in each pixel proportional to the local illumination intensity. When exposure is complete, a CCD transfers each pixel’s charge packet sequentially to a common output structure, which converts the charge to a voltage, buffers it and sends it off-chip. Most functions (e.g. gain, bias, and clocking functions) take place in camera’s printed circuit board. In a CMOS imager, the charge-to-voltage conversion takes place in each pixel, and most functions are integrated on the chip. This difference in readout techniques has significant implications for sensor architecture, capabilities and limitations. Bayer matrix operation results in only one third of the light captured in each pixel. This reduces both color accuracy and image resolution, and adds complexity to signal processing since color interpolation is required to form the final image. [2] Foveon X3® technology takes advantage of the fact that silicon absorbs different wavelengths of light to different depths. Therefore Foveon sensors use three layers of pixels embedded in silicon, so one layer records red, another layer records green, and the other layer records blue. This results in better resolution and color accuracy than the Bayer matrix technique. Pixel scanning is controlled by two sets of counters – one each for horizontal and vertical control. The counters determine which row is to be activated and which pixel location in that row is to be read out. Each counter has three registers to set the start count, the increment and the stop count separately in the horizontal and vertical directions. These can be set in any combination to define a rectangular region of interest from one pixel location to the entire array. [3,4] 2.2 RAW data In theory, digital camera RAW data is the output from each of the original red, green and blue sensitive pixels of the image sensor, after being read out of the array by the array electronics and passing through an analog to digital converter. The readout electronics collect and amplify the sensor data and it's at this point that "ISO" (relative sensor speed) is set. If readout is done with little amplification, it corresponds to a low ISO value, and high of amplification corresponds to a high ISO setting. The noise analysis should be carried out using the lowest available ISO setting. In practice, however, the RAW data from different cameras seem to be preprocessed in some way. All the three cameras used in this study have 12 bit AD converters, so the RAW data should contain all digital values between 0 and 4095. This property can easily be tested by taking an image with such exposure that it approximately covers the dynamic range of the camera at least for one color. The red component histograms of such images are presented in (Fig. 1). Canon and Sigma RAW data seem to be lossless, but Nikon uses a sort of nonlinear compression which results in missing data values [5]. Signal range for Sigma RAW data exceeds 4095, so the data seems to be scaled somehow and the analysis result values can not be compared directly with the other cameras. 2.3 Cameras The cameras used in the project were Canon EOS D30, Nikon D70, and Sigma SD10. Images were saved in RAW data format on every camera. Table 1: Camera specifications Camera Canon EOS D30
Nikon D70
Specifications CMOS sensor (proprietary) Effective sensor size: 22,7 x 15,1 mm Pixel count: 2160 x 1440 CCD sensor (Sony ICX413AQ) Effective sensor size: 23,7 x 15,6 mm Pixel count: 3008 x 2000
Sigma SD10
Foveon X3® 10.2 MP sensor Effective sensor size: 20,7 x 13,8 mm Pixel count: 2268 x 1512 x 3 layers
a)
b)
c)
d)
e)
f)
Figure 1: a), c), e): RAW data histograms for each camera. b), d), f): detail of histogram.
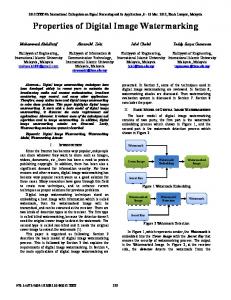
2.4 Test arrangement Test arrangement used in this project is approximation of the guidelines presented in [6] (Fig. 2). Optional test arrangement is to use for example light-dispersing white opal glass illuminated from behind as a flat field target.
"
# ! Figure 2: Test arrangement. 1: reflective flat field target, 2: illumination, 3: camera under test, 4: additional shielding, 5: camera lens.
2.5 Measurement procedures Measurement procedures used in this project are rough approximations of the guidelines presented in [7]. Instead of using a standardized test chart with several grey level intensities from black to white and constant illumination, a white target and varying illumination was used. The lighting used was incandescent tungsten studio lights (colour temperature of 3200 K) or matrix of white power LEDs driven with DC current. The illumination was varied so that the whole range from completely dark frame to camera saturation level was covered. Number images were taken at each lighting/exposure level. ISO setting was the smallest available in the camera; 100 for Canon and Sigma, 200 for Nikon. Aperture values, lens and exposure times were the same for every camera, if possible. A 64 by 64 pixel area from the centre of the image was used for the analysis. The images were taken in a laboratory where it is possible to eliminate all additional lighting and reflections from the surrounding surfaces. The luminance on the target was measured with Hagner Universal Photometer.
3. METHODOLOGY 3.1 Noise classifications Noise components can be classified in different ways. One type of classifications divides the noise components into three groups: signal dependent, temperature dependent and time dependent. Signal dependent noise components are photon shot noise, photoresponse nonuniformity (PRNU) and amplifier gain non-uniformity. Shot noise results from the discrete nature of electronic charge. When current flows past any point in a circuit, the arrival rate of electrons will fluctuate slightly and give rise to variation in current flow at that point. Both photoelectrons and dark current contribute to shot noise and are referred to as photon shot noise and dark current shot noise respectively. Shot noise exhibits a Poisson distribution and has a square root relationship between signal and noise. PRNU is a difference in pixel-to-pixel responsivity to light. PRNU is signal dependent and multiplicative in nature. Temperature dependent noise components are thermal noise and dark current. Dark current arises through thermal generation of electrons (TGEs) in the silicon. The dark current is usually different from pixel to pixel. The average value of dark current for all pixels might be referred to as the dark current bias. If this bias is subtracted from every pixel the variation remaining is referred to as fixed pattern noise (FPN), so called because it does not vary much from frame to
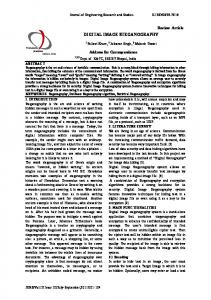
frame. Additionally there is dark current shot noise (shot noise associated with the portion of current that is dark current). Dark current can be significantly reduced through cooling of the sensor; the number of TGEs can be halved with every 8-9 °C of cooling. Time dependent noise components include photon shot noise, dark current shot noise, reset noise and thermal noise. Another way to classify the noise components is to divide them into random and pattern components. Random components include photon shot noise, dark current shot noise, reset noise and thermal noise. Pattern components are amplifier gain non-uniformity, PRNU, dark current non-uniformity and column amplification offset. Quantization noise is caused by discrete output levels of A/D converter. A range of analog inputs to the A/D converter produce the same digital output. This uncertainty gives rise to quantization noise which can be minimized by proper ADC resolution selection. 3.2 PTC method Photon Transfer Curve (PTC) method is presented in [8]. Photon transfer method is used to evaluate numerous image sensor parameters in absolute terms. These parameters include read noise, dark current, quantum yield, full well, linearity, pixel nonuniformity, sensitivity, signal-to-noise, offset, and dynamic range. Photon transfer method gives the conversion constant K used to convert relative digital numbers (DN) generated by the camera into absolute physical units of electrons. This conversion constant is referred to as “camera gain constant,” expressed in e−/DN. Three distinct noise regimes are identified in the photon transfer curve (Fig. 3). The first regime, the read noise floor, represents the random noise measured under totally dark conditions. This noise includes on-chip amplifier noise and any other noise sources that are independent of the signal level (for example dark current shot noise). As the illumination is increased, the noise becomes dominated by the shot noise of the signal, shown in the middle region of the curve. The quantity of charge collected in any given pixel obeys Poisson distribution, and hence the uncertainty of that quantity is proportional to the square root of the number of incident photons. On logarithmic scale the shot noise is thus characterized by a line of slope ½. If the signal variance (noise level) is considerably higher than the read noise level (in this function at least 2 times the read noise variance), camera gain constant K can be calculated from equation K=
S (DN) σ (DN) − σ R2 (DN) 2 S
where S(DN) is signal as digital numbers, σ 2 (DN) is signal variance and σ R2 (DN) is read noise floor variance. S The third regime is associated with fixed-pattern or pixel nonuniformity noise that results from sensitivity differences among pixels. Pixel nonuniformity noise is proportional to signal and consequently produces a characteristic slope of unity on the plot. Full well is observed as a break in the slope of one. At this point the charge spreads between pixels (i.e., blooming), smoothing and lowering the noise component as seen in the plot. This action causes the noise value to suddenly decrease.
Figure 3: Photon transfer curve Fixed pattern noise becomes dominant at higher signal levels. Removing this pixel nonuniformity makes it easier to determine the shot noise part of the curve. Pixel nonuniformity is eliminated by differencing, pixel by pixel, two identical images taken back to back at the same exposure level. To improve statistics, three or more exposures at the same signal level can be taken. The random noise is determined by differencing each image with the average of N images and calculating the mean standard deviation of these differenced images using 64 x 64 pixel areas from the centre of the image. Empirical test with Canon EOS D30 presented in (Fig. 4) shows that after 40 frames the residual noise STD has reached 99% of its final (100 frames averaged) level. This result holds also for the Nikon and Sigma cameras. In the example data set in this paper, however, the number of images taken at each exposure level was generally 10 or 20. a)
b)
Figure 4: Effect of number of frames averaged to residual noise STD. a) Changing of residual noise STD when average of N frames is subtracted from a single frame. b) Percentage of residual noise STD of the final value (100 frames averaged and subtracted from test frame).
4. RESULTS 4.1 Dark frames Dark signal of a camera is the increase in black level with respect to integration time [9]. It arises from electrons spontaneously generated within the silicon. Theoretically, the dark signal should increase as a function of time in each pixel [10]. Test results for ten random pixels with each camera show that RAW data contains some sort of dark signal correction (Fig. 5). a)
b)
c)
Figure 5: Dark signal as function of time for 10 random pixels. Dark current shot noise obeys Poisson statistics: dark signal variance equals dark signal average. The expected increase in noise level as a function of time is apparent also in RAW data for Canon and Sigma. For Nikon, the average increase over pixels is very small, but for some pixels the increase is significant. Table 2: Dark current shot noise variance and dark signal non-uniformity for red component 1 ms exposure time 10 s exposure time Canon 3.5 DN 324 DN Nikon 2.81 DN 2.83 DN Sigma 5.3 DN 263 DN (15 s exposure)
DSNU 6.8e-5 6.2e-6 4.7e-5
(Fig. 6) shows the differences between sensor structures. Canon CMOS sensor results in rather even dark signal and noise, there is no obvious horizontal or vertical fixed pattern present since each pixel has its own amplifier. Nikon CCD sensor has clearly a vertical fixed pattern due to column-wise amplifier structure. Higher signal means higher shot noise, so the differences in signal levels are visible also in shot noise images. In Sigma, Foveon sensor experiences a rather
ambiguous fixed pattern, possibly due to temperature differences across the sensor. Higher temperature means higher dark current and higher noise. With long dark exposure times, the temperature differences across the sensors become more obvious. a)
b)
c)
d)
e)
f)
Figure 6: a), c), e): Averages of 100 dark frames for each camera. b), d), f): corresponding pixel-by-pixel shot noise variance. Scales in the images are limited for improved visualization.
a)
b)
c)
d)
e)
f)
Figure 7: a), c), e): Column-wise averages of red component dark frames for each camera. b), d), f): corresponding periodograms showing periodical variation at every four red pixels. (Fig. 7) shows the variation in column-wise averages of the red dark frames and their spectrograms for each camera. Every camera seems to have periodical variation at every four red pixels. This is probably caused by pixel grouping in sensor readout structure. In Nikon, the effect of electronics heating the upper left corner can be seen as slightly higher signal. Sigma seems to be experiencing a change in ADC offset as a function of readout column.
4.2 PTC method In (Fig. 8), examples of photon transfer curve analysis for each camera are presented. Camera gain constant was estimated from this curve at every point where the noise level was at least twice the read noise. Mean values and STDs of these estimates are: Canon, ISO 100: K = 11.6 e-/DN, STD 0.3, ISO 200: K = 5.7 e-/DN, STD 0.4 Nikon, ISO 200: K = 5.2 e-/DN, STD 1.0 (ISO 400: K = 3 e-/DN) Sigma, ISO 200: K = 41.1 e-/DN, STD 2.2 Doubling the sensitivity means halving of the gain constant, so the results for Canon and Nikon seem logical and comparable to other sources [11]. For Sigma, the value seems rather high as the Foveon sensor should have very good sensitivity, but because of the data scaling problem this result can not be as such compared with the other cameras.
a)
b)
c)
Figure 8: Experimental photon transfer curves of green component for each camera.
4.3 ISO 15739 noise analysis Standard ISO 15739 defines a procedure for analysing image noise components using 8 frames per exposure level. This method can be applied to arbitrary number of frames. With this procedure, values for average color components, pixelby-pixel STDs, temporal noise and fixed pattern noise STDs and signal-to-temporal noise ratios for each color component can be estimated. In (Fig. 9), temporal noise STDs and temporal SNRs for Canon camera are presented. Noise STD is plotted as percentage of the signal maximum. For Nikon, these values are rather similar to Canon results.
Photo-response non-uniformity, PRNU, is a measure of the photo-response variation across the pixel array. PRNU is determined as follows: and average image of N dark frames is subtracted from an average image of N frames lit at approximately 50% signal level. PRNU is then calculated as the percentage of the difference frame STD from the difference frame mean value. For the three cameras used, the PRNU values for red components and their determination lighting levels were Canon: PRNU = 0.70 at level 4.3 cd*s Nikon: PRNU = 0.51 at level 5.0 cd*s Sigma: PRNU = 0.19 at level 17.5 cd*s Foveon sensor seems to require much higher lighting levels than the others to reach the 50% level of signal maximum. This would suggest that the high camera gain constant resulting from the PTC analysis is realistic. a)
b)
Figure 9: Example results from noise analysis according to ISO 15739; Canon. a) Temporal noise STD as a function of exposure level, b) Signal-to-temporal noise ratio.
5. CONCLUSIONS The simple analysis methods presented in this paper are useful in evaluating the noise components of the whole camera system, not just the imaging sensor. The results are consistent with the information available from manufacturers and other studies. The methods are also applicable to both CMOS and CCD sensors. With Foveon sensors, the temporal and fixed pattern noise component behave as expected, so the methods are working but the question of the data scaling remains if the results are to be used for comparing different cameras. Research for finding methods to unravel the noise components even more based on e.g. their known statistical properties continues.
REFERENCES 1. Raw Digital Photo Decoding, http://www.cybercom.net/~dcoffin/dcraw/ (Referred 18.10.2005) 2. James R. Janesick, “Dueling detectors”, OE Magazine, Vol. 2, No. 2, pp. 30-33 3. David L. Gilblom, Sang Keun Yoo, Peter Ventura, “Operation and performance of a color image sensor with layered photodiodes”,.Proc. SPIE Vol. 5074, pp. 318-331, 2003 4. Foveon X3F® technology, http://www.x3f.info/sd9/v2_0/english.html (Referred 18.10.2005) 5. Is the Nikon D70 NEF (RAW) format truly lossless? http://www.majid.info/mylos/weblog/2004/05/02-1.html (Referred 18.10.2005) 6. ISO 14524: Photography – Electronic still-picture cameras – Methods for measuring opto-electronic conversion functions (OECFs) 7. ISO 15739: Photography – Electronic still-picture imaging – Noise measurements 8. James R. Janesick, Scientific Charge-Coupled Devices, SPIE Press, 2001
9. Standard Mobile Imaging Architecture SMIA Camera Characterization Specification, 2004 10. Hans B. Wach, Edward R. Dowski Jr., “Noise Modeling for Design and Simulation of Color Imaging Systems”, Proc. 12th Color Imaging Conference, Vol. 12, pp. 211-216, 2004 11. Canon 10D / Nikon D70 comparison test for deep-sky astronomy, http://www.astrosurf.org/buil/d70v10d/eval.htm (Referred 18.10.2005)