Characterization of physicochemical properties of beryllium aerosols associated with prevalence of chronic beryllium disease Aleksandr B. Stefaniak,a,b Mark D. Hoover,c{ Gregory A. Day,c,d Robert M. Dickerson,e Eric J. Peterson,f Michael S. Kent,g Christine R. Schuler,c Patrick N. Breysseb and Ronald C. Scripsick*a a
Industrial Hygiene and Safety Group (HSR-5), MS K553, Los Alamos National Laboratory, Los Alamos, NM 87545, USA. E-mail:
[email protected] b Division of Environmental Health Engineering, Johns Hopkins University Bloomberg School of Public Health, Baltimore, MD 21205, USA c National Institute for Occupational Safety and Health, Centers for Disease Control and Prevention, Morgantown, WV 26505, USA d Materials Technology and Metallurgy Group (MST-6), MS K553, Los Alamos National Laboratory, Los Alamos, NM 87545, USA e Structure Property Relations Group (MST-8), MS G755, Los Alamos National Laboratory, Los Alamos, NM 87545, USA f Material Science and Technology Superconductivity Technology Center (MST-STC), MS K763, Los Alamos National Laboratory, Los Alamos, NM 87545, USA g Brush Wellman Inc., Elmore, OH 43416, USA Received 12th December 2003, Accepted 2nd March 2004 First published as an Advance Article on the web 22nd March 2004
Little is known about the physicochemical properties of beryllium aerosols associated with increased risk of beryllium sensitization and chronic beryllium disease (CBD). Such information is needed to evaluate whether airborne mass of beryllium is the appropriate metric of exposure or alternatively to provide a scientific basis for using information on particle size, surface area, and chemistry to support an improved exposure limit based on bioavailability through the inhalation and dermal routes of exposure. Thus, we used a suite of analytical techniques to characterize aerodynamically size-fractionated beryllium particles and powders that have been associated in epidemiological studies with higher prevalence of CBD. Aerosol particles were sampled from the ventilation systems of production lines for powders of beryllium metal and beryllium oxide and for ingots of copper–beryllium alloy. End product powders from the metal and oxide production lines were also collected. Particles released during production of beryllium metal were found to be complex, having heterogeneous composition, including reactive species such as fluorine. Powders from beryllium metal production were of high purity with only a minor component of beryllium oxide. Both particles and powders from oxide production were high-purity oxide. Particles released during production of copper–beryllium alloy were heterogeneous, being predominantly copper oxides. Thus, all particles and powders contain at least some beryllium in the form of beryllium oxide. These data justify efforts to thoroughly characterize beryllium aerosol properties when performing exposure assessments. The data also suggest that differences in particle chemical composition, size, number, and surface area may influence bioavailability of beryllium and contribute to risk of CBD. However, a scientific basis does not yet exist to replace mass as the current metric of exposure.
DOI: 10.1039/b316256g
Introduction Chronic beryllium disease (CBD) is a progressive lung disease, characterized by non-caseating granulomas, interstitial infiltrates, and fibrosis, that occurs in individuals who are sensitized to beryllium (Maier and Newman1). Although an association has been observed between exposure to insoluble beryllium particles and development of disease (Sterner and Eisenbud,2 Kreiss et al.,3 Eisenbud4), a consistent exposure–response relationship for CBD has been difficult to construct using total airborne beryllium aerosol mass levels. We hypothesize that a better understanding of the interrelationship of beryllium particle physicochemical properties, bioavailability of beryllium, and associated risks for CBD may lead to exposure limits { Former address: Lovelace Respiratory Research Institute, Albuquerque, NM 87185, USA.
more protective than mass alone (Stefaniak et al.5). At the cellular level a dissolved beryllium species is the hypothesized input to the immune reaction associated with development of CBD (Eidson et al.,6 Richeldi et al.7). Thus, providing dissolved beryllium in the lung, for example through dissolution of inhaled particles, is thought to be a necessary step for CBD. In addition, it has long been known that dermal exposure to beryllium salts may contribute to sensitization (Curtis8). Tinkle et al.9 have hypothesized that dermal exposure to insoluble beryllium particles may also provide an immunological route to sensitization. Although this hypothesis remains unproven, Tinkle et al.9 have shown that dextran beads smaller than 1 mm in diameter can penetrate intact cadaver skin when flexed. Several physicochemical properties can potentially influence bioavailability of beryllium, including particle size, specific surface area (SSA), and chemical composition (Stefaniak
This journal is ß The Royal Society of Chemistry 2004
J. Environ. Monit., 2004, 6, 523–532
523
et al.5). According to Mercer’s10 surface-area-limited dissolution model, dissolution kinetics of a material are dependent on SSA. A surface-area-limited model is most appropriate for material with homogeneous composition or for heterogeneous material when the toxicant is present as a surface coating that is available for contact with biological fluid. Results of in vitro studies suggest a role for surface area in the development of the CBD immune reaction, e.g. macrophage cytotoxicity is largely dependent on beryllium SSA dose (Finch et al.,11 Finch et al.12). Deviation from a surface-area-limited model may occur for materials with heterogeneous composition. For example, Hoover et al.13 found that dissolution of cobalt or iron surface coating is increased by a factor of four relative to that of cobalt or iron from particles with homogeneous composition. Benson et al.14 exposed mice to copper–beryllium alloy particles by intratracheal instillation and found that copper clears rapidly (half-time of 0.5–2 days) but beryllium clears more slowly (halftime of several weeks). Thus, for mixed matrix beryllium materials chemical and physical composition are important for predicting dissolution kinetics. Very limited data are available on the potentially complex physicochemical properties of beryllium aerosols in the work place. Hall et al.15 have determined the SSA of bulk powders of beryllium oxide and Hoover et al.16 determined the oxide layer thickness on beryllium metal powder. In a previous paper (Stefaniak et al.5) we demonstrated that direct measurement of beryllium aerosol SSA is necessary because actual measurements of SSA can differ by an order of magnitude from theoretical predictions based on geometric models. In the current work we characterize additional physicochemical properties of various beryllium aerosols that were selected on the basis of prior demonstrated risk of beryllium sensitization and CBD (Kreiss et al.3). Additionally, we justify the importance of thoroughly characterizing beryllium particle properties when assessing beryllium exposures by the inhalation and dermal routes.
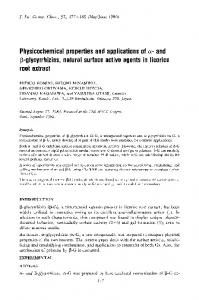
Materials and methods Sources of beryllium study materials Beryllium materials were collected from process ventilation systems during production of beryllium products and by obtaining bulk samples of finished product material (Table 1 and Fig. 1). Materials are categorized as process-sampled particles and aerodynamically size-separated powders. Particles were collected from ventilation systems of five unit operations at a primary beryllium production facility and represent the materials to which workers may be exposed by inhalation or by dermal contact with airborne particles or contaminated surfaces. The fluoride furnace and reduction furnace (beryllium metal powder production line), beryllium oxide screener (beryllium oxide powder production line), and master alloy arc furnace and casting alloy induction furnace (copper– beryllium alloy ingot production line) were selected for sampling because they are associated with a range of CBD prevalence (Kreiss et al.3). Note that Kreiss et al.3 report grouped prevalence for the fluoride and reduction furnace unit operations, but for the purposes of this study the aerosol data are reported separately for each unit operation. Both unit operations are located in the same building. Bulk powder samples were obtained from the final production lots of the beryllium metal and beryllium oxide powder production lines. These powders are feed materials for manufacturing beryllium metal and oxide parts. CBD has been found in workers who form or machine these parts (see for example Stange et al.,17 Henneberger et al.,18 Kelleher et al.19). Schematic diagrams of the production lines sampled are shown as Fig. 1; asterisks denote the source of particles or powder studied. To make beryllium metal powder (Fig. 1a), ammonium beryllium fluoride is thermally decomposed at 700– 1000 uC in a fluoride furnace to drive off ammonium fluoride gas, yielding molten beryllium fluoride. Next, the beryllium
Table 1 Strategic approach for beryllium aerosol collection and characterization Techniquea Collection Bulk
Purpose
Comments
Massb
Collection of process materials for characterization
Large masses can be obtained; characteristics of bulk process material may differ from those of aerosol emissions Sufficient masses can be collected to enable determination of size-dependent physicochemical particle properties Larger masses and longer collection times are possible compared to traditional filtration; material can easily be recovered for analysis
mg, g, or kg
Five-stage aerosol cyclone
Collection of aerodynamically size-classified aerosols for characterization
ESP (backup to cyclone)
Collection of particles smaller than 0.4 mm aerodynamic diameter for characterization
Characterization Gravimetrics XRD
Determination of aerodynamic size distribution and confirmation of adequate masses for analyses Crystalline constituents
TEM-SAD
Crystalline constituents
TEM-mD TEM-EDS
Crystalline constituents Elemental composition
TEM-EELS ICP-MS
Elemental composition Quantification of elemental composition
mg, g
Up to g
Basis for concentration calculations
mg, g, or kg
Bulk analysis of constituents at 1% or more by weight Properties from a selected viewing area typically involving multiple particles Properties of individual particles Any element from carbon to uranium in a selected viewing area typically involving multiple particles Properties of individual particles Bulk analysis of elemental composition
10–100 mg ng pg ng pg mg
a ESP ~ Electrostatic precipitator, XRD ~ X-ray diffraction, TEM-SAD ~ Transmission electron microscopy–selected area electron diffraction, TEM-mD ~ Transmission electron microscopy–micro electron diffraction, TEM-EDS ~ Transmission electron microscopy–energy dispersive spectrometry, TEM-EELS ~ Transmission electron microscopy–electron energy loss spectrometry, ICP-MS ~ Inductively coupled plasma-mass spectrometry b Mass for sampling device indicates amount that can be collected; mass for characterization techniques indicates amount required for an individual analysis
524
J. Environ. Monit., 2004, 6, 523–532
Fig. 1 Flow chart of the production lines for (a) beryllium metal powder, (b) beryllium oxide powder, and (c) copper–beryllium alloy ingots. Asterisks indicate the sources of particles and powders characterized in this study.
fluoride is combined with magnesium in a reduction furnace at 1200–1300 uC. The magnesium reacts with the beryllium fluoride, forming beryllium metal pebbles and magnesium fluoride. The cooled magnesium fluoride/beryllium metal is crushed to separate the discrete beryllium metal pebbles. The metal pebbles are recovered and cast into ingots, which in turn are lathed to produce chips. The chips are subject to mechanical fracture and sizing to yield finished beryllium metal powder product (Stonehouse,20 White and Burke21). Beryllium oxide powder (Fig. 1b) is made from beryllium hydroxide, which is reacted with sulfuric acid, filtered, concentrated, and cooled to yield beryllium sulfate tetrahydrate crystals. These crystals are placed in a calcining furnace and heated to 1150–1450 uC to drive off volatile gases, yielding beryllium oxide particles. The resulting particles are sized using a mesh screener to yield a final powder product. Copper–beryllium alloy (Fig. 1c) is made by reducing pellets of beryllium material with molten copper in an arc furnace. The pellets typically consist of beryllium oxide or beryllium metal combined with carbon and ventilation fines. The reduction process yields a ‘‘master’’ alloy containing approximately 4% beryllium metal and 96% copper by weight. This master alloy is then melted again in a coreless induction furnace lined with graphite refractory material and diluted with additional copper to yield ingots of ‘‘casting’’ alloy containing approximately 2% beryllium metal and 98% copper by weight (Kirk-Othmer22). Collection of beryllium study materials We used a five-stage aerosol cyclone to collect gram quantities of airborne materials from the ventilation ductwork of the unit operations. This strategy offered the advantage of sampling from a more concentrated source than available in the ambient atmosphere of the workplace thereby reducing collection times needed to obtain sufficient quantities of material for analysis. Sampling for long periods from ductworks is also less invasive to workers compared to collection of personal breathing zone samples or collection of high-volume samples in the breathing zone. Collection of process aerosols was accomplished by inserting a sampling probe fitted with an appropriate sample nozzle (Model 280N, Graseby-Andersen, Smyrna, GA) through a port and into the ventilation gas stream of the unit operations denoted in Fig. 1. The temperature of the gas stream in the ventilation ductwork of each of the unit operations was typically 40 uC, with the exception of the fluoride furnace, which had an exhaust gas temperature of 20 uC. The sample nozzle was selected to match the probe inlet velocity to the gas stream velocity in the ventilation ductwork. A five-stage
aerosol cyclone sampler (Model 285, Graseby-Andersen) operated at 28.3 L min21 at the local temperature of 23 uC and pressure of 750 mmHg where the cyclone was located, was used to collect aerodynamically size-fractionated samples (Parsons and Felix23). Material passing the last stage of the sampler was collected with a concentric electrostatic precipitator (ESP) (Model 02-1700, Mine Safety Appliances, Inc., Pittsburgh, Pa). Table 2 lists the effective aerodynamic cutoff diameters for the cyclone under the stated conditions of use. Collection times of at least 16 hours were used to obtain sufficient mass of material for subsequent analysis. Details of the aerosol generation and aerodynamic size separation procedure for the powders have been described (Hoover et al.16). Bulk powders (denoted with asterisks in Fig. 1) of beryllium metal (Product Type I-400, Brush Wellman Inc., Elmore, OH) and beryllium oxide (Product Type UOX125, Brush Wellman Inc.) were aerosolized at Lovelace Respiratory Research Institute (Albuquerque, NM) using a dry powder blower (Model 175, DeVilbiss, Somerset, PA) operated at a flow rate of 1 L min21. Dilution airflow of 23 L min21 was added and the aerosol aerodynamically sizeseparated using a Southern Research Institute five-stage aerosol cyclone (Smith et al.24) operated at 24 L min21 and 20 uC followed by an ESP (Mine Safety Appliances) with a backup filter. Dispersion of a 10 g charge of bulk powder typically required 30 minutes to completely aerosolize, yielding an average concentration of approximately 1 g m23 to the cyclone. The aerodynamic diameter cutoffs for operation of the cyclone under these conditions of use are listed in Table 2. Analytical techniques X-Ray diffraction (XRD), transmission electron microscopyselected area electron diffraction (TEM-SAD), and TEM micro electron diffraction (TEM-mD) were utilized to identify crystalline chemical constituents of aerosol samples. See Table 1 for a brief summary of each method. X-Ray diffraction patterns were generated using a Model XDS2000 powder diffractometer (Scintag, Inc., Sunnyvale, CA) with a sealed-tube X-ray source (Cu Ka, 45 kV, 40 mA). Samples were prepared by adding a thin layer of beryllium material to a 2.54 cm diameter single crystal plate coated in a thin film of vacuum grease. Analysis of diffraction patterns to determine the phase composition of crystalline constituents was performed using the General Structure Analysis System (GSAS) computer software program (Larson and Von Dreele,25 Toby26). The identity of constituents was determined by comparing diffraction patterns to reference patterns in the International Centre for Diffraction Data (ICDD) Powder Diffraction Files (PDF) database J. Environ. Monit., 2004, 6, 523–532
525
Table 2 Mass fraction of beryllium particles and powders aerodynamically size-separated using aerosol cyclonesa Mass fraction Dae/mmb
Stage
1 w5.7 2 2.3 3 1.5 4 0.7 5 0.4 e v0.4 ESP Estimated MMADf Estimated GSDg
Fluoride furnace
Reduction furnace
Metal powder
Screener oxide
Oxide powder
Master alloy
Casting alloy
0.54 0.28 0.15 0.03 — — 6.6 mm 3.0
0.44 0.33 0.10 0.07 0.05 0.01 5.0 mm 2.9
0.69 0.23 0.05 0.02 0.008 0.002 10 mm 2.6
0.43 0.55 0.02 —d — — 5.4 mm 1.6
c
0.34 0.27 0.16 0.11 0.09 0.03 3.6 mm 3.8
0.22 0.03 0.08 0.07 0.41 0.19 0.6 mm 1.4
c c c c c c c
a
Particles were collected from the ventilation ductwork of unit operations associated with prevalence of CBD at a beryllium production facility (Kreiss et al.3) and include aerosol from the fluoride furnace, reduction furnace, oxide screener, master alloy arc furnace, and casting alloy induction furnace. Powders were material obtained by bulk sampling from final production lots of powder production lines and are associated with prevalence of CBD in workers who form or machine parts made from these powders (Stange et al.,17 Henneberger et al.,18 Kelleher et al.,19); powders include metal powder and oxide powder. b Dae ~ aerodynamic diameter. Particles were size segregated using a GrasebyAndersen Model 285 version of the five-stage aerosol cyclone (Parsons and Felix23) operated at 23 uC with a flow rate of 28 L min21. The aerodynamic cutoff diameters were slightly different (w6, 2.5, 1.7, 0.9, 0.4, and v0.4 mm) for the powders, which were size segregated using a Southern Research Institute five-stage aerosol cyclone (Smith et al.24) operated at 20 uC with a flow rate of 24 L min21. c A specific particle size distribution for the oxide powder is not provided because the distribution depends on the mechanical and other conditions for powder handling and aerosolization. d Weighable amount of material not collected in size-fraction. e ESP ~ Electrostatic precipitator (backup). f MMAD ~ mass median aerodynamics diameter. g GSD ~ geometric standard deviation.
(ICDD, Newton Square, PA). TEM-SAD and TEM-mD diffraction patterns were collected using a transmission electron microscope (Model CM30, Philips Electron Optics, Eindhoven, Netherlands). All TEM samples were prepared on 300 mesh copper electron microscopy grids coated with a lacy carbon substrate (Ted Pella Inc., Redding, CA). Electron diffraction patterns generated were compared to published reference patterns (Pearson et al.27) to identify crystalline constituents. TEM-energy dispersive X-ray spectrometry (TEM-EDS) and TEM-electron energy loss spectrometry (TEM-EELS) were used to identify elemental constituents of aerosols. The TEM-EDS system, a germanium detector (Princeton GammaTech, Princeton, NJ) connected to a Power Macintosh running the Desktop Spectrum Analyzer software (National Institute of Standards and Technology, Gaithersburg, MD), can collect and display chemical information for elements with atomic number greater than 6 (carbon). Thus, elemental beryllium (atomic number 4) could not be detected using EDS. In addition, copper components of collected particles cannot be
distinguished from the copper-based TEM grids used in the EDS analyses. The diameter of the TEM-EDS beam was varied, e.g. 10–50 nm, to examine differences in the spatial distribution of elements. Elemental analysis of select size fractions of materials was also performed using TEM-EELS (Model 766 DigiPEELS, Gatan, Pleasanton, CA), which can detect beryllium. Analyses were performed using the same grid samples prepared for TEM electron diffraction analyses. Inductively coupled plasma-mass spectrometry (ICP-MS) was utilized to quantify levels of beryllium and other elements in particle samples. Elements were selected based on manufacturing process descriptions (Stonehouse,20 White and Burke,21 Kirk-Othmer22) and results of TEM analysis. A known mass of material was suspended in phosphate buffered saline and sent to a commercial laboratory (Battelle Memorial Institute, Columbus, OH) for analysis according to a modified US Environmental Protection Agency (EPA) Method 3050b: Acid Digestion of Sediments, Sludges, and Soils (US EPA28). This method uses a microwave digestion to completely dissolve beryllium oxide. Analytical limits of detection (LOD) were
Table 3 Analytical techniques used to characterize process-sampled particles and size-separated powders of berylliuma Material Stage
Fluoride furnace
Reduction furnace
Metal powder
Screener oxide
Oxide powder
Master alloy
Casting alloy
Bulk
NA
NA
XRD TEM-SAD
NA
NA
NA
1
XRD TEM-SAD TEM-EDS
XRD TEM-EDS ICP-MS
XRD TEM-EELS
ICP-MS XRD ICP-MS
ICP-MS XRD ICP-MS ICP-MS TEM-SAD TEM-EDS
— —
XRD TEM-SAD TEM-EDS ICP-MS ICP-MS XRD ICP-MS ICP-MS ICP-MS
TEM-SAD TEM-mD TEM-EDS
2 3
XRD TEM-SAD TEM-EDS ICP-MS ICP-MS XRD ICP-MS — TEM-SAD TEM-EDS
XRD TEM-SAD TEM-EDS XRD TEM-SAD TEM-mD TEM-EELS — TEM-SAD TEM-EDS — TEM-SAD TEM-mD TEM-EDS XRD TEM-SAD TEM-EDS
4 5
TEM-SAD TEM-EDS
ESPb
TEM-SAD TEM-EDS
XRD TEM-SAD TEM-EDS
— XRD TEM-EDS NA
TEM-SAD TEM-EDS
XRD TEM-EDS ICP-MS
XRD XRD — TEM-SAD TEM-EDS ICP-MS XRD TEM-SAD ICP-MS
a NA ~ Material not available, XRD ~ X-ray diffraction, TEM-SAD ~ Transmission electron microscopy–selected area electron diffraction, TEM-mD ~ Transmission electron microscopy–micro electron diffraction, TEM-EDS ~ Transmission electron microscopy–energy dispersive spectrometry, TEM-EELS ~ Transmission electron microscopy–electron energy loss spectrometry, ICP-MS ~ Inductively coupled plasmamass spectrometry, –- Indicates measurements were not made. b ESP ~ Electrostatic precipitator.
526
J. Environ. Monit., 2004, 6, 523–532
0.05 mg for beryllium, 0.5 mg for magnesium, 5.0 mg for aluminium, 25 mg for silicon, 13 mg for iron, and 0.5 mg for copper. As shown in Table 3, the analytical techniques described above were used to characterize the physicochemical properties of selected size-fractions of the particles and powders. In some cases the required mass of material for an analytical technique exceeded the mass of material collected, e.g. stage 4 of the screener oxide. In other cases there were only sufficient quantities to perform the microanalyses, e.g. stage 1 casting alloy.
Results and discussion Collection of beryllium study materials Particle collection times for the five unit operations ranged from a minimum of 20 hours (screener oxide) to a maximum of 41 hours (reduction furnace). The total mass of particles collected from an individual unit operation ranged from v0.25 g from the casting alloy unit operation to w10 g from the screener oxide unit operation. For all unit operations the total mass of particles collected was 29 g. Kilogram quantities of bulk powders were available for characterization. Processing of several hundred grams of bulk powder through the aerosol cyclone provided mg amounts in the individual stages and ESP. The mass fraction of material obtained per cyclone stage, summarized for each material in Table 2, illustrate distinct mass distributions among materials, i.e. some were predominantly large particles (e.g. reduction furnace, metal powder, beryllium oxide) whereas others were predominantly submicrometre size particles (e.g. casting alloy). As shown in Table 2, masses in the particle diameter range w1 mm were nearly always adequate to perform all planned analyses. This was not always the case for particle diameter fractions v1 mm.
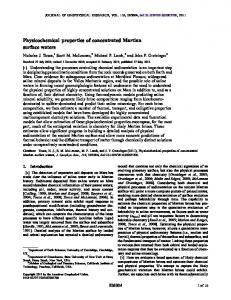
Characteristics of beryllium study materials Beryllium metal production. The X-ray diffractograms of the fluoride furnace particles (stage 3), reduction furnace particles (stage 3), and metal powder (stage 5) shown in Fig. 2 illustrate the chemical refinement of the beryllium materials as they progress through the furnace operations to the final product beryllium metal powder. Within each material there were no observable differences in diffractograms as a function of particle size (data not shown). The crystalline substances identified from the X-ray diffractograms are summarized in Table 4. Beryllium oxide and ammonium fluoride were identified in fluoride furnace particles and beryllium oxide and magnesium fluoride in the reduction furnace particles. The presence of ammonium fluoride and magnesium fluoride in the particles is consistent with emissions from the unit operations (Stonehouse20). Note that beryllium metal was not detected in these process-sampled particles, indicating that workers in the furnace areas of ‘‘beryllium metal production’’ are not exposed to beryllium metal, but rather to beryllium oxide. The finished product powder, however, only contained beryllium metal. The TEM-SAD diffraction patterns (Fig. 3) also illustrate the progressive refinement of beryllium material. The degree of transition from amorphous to crystalline metal is indicated by the presence or absence of halos in the TEM-SAD Table 4 Crystalline substances identified in the beryllium study materials Substance identified Aerosol
Stage XRDa
Fluoride furnace
1 3 5 ESPe Reduction furnace 1 3 5 ESP Metal powder Bulk 1 5 Screener oxide 1 3 5 ESP Oxide powder Bulk 1 3 5 ESP Master alloy 1 3 ESP Casting alloy
1 2 3 5 ESP
Fig. 2 X-Ray diffractograms illustrating the progressive chemical refinement of the beryllium materials as they proceed from (a) fluoride furnace particles to (b) reduction furnace particles to (c) final product beryllium metal powder. Peaks labeled 1 ~ beryllium oxide, 2 ~ ammonium fluoride, 3 ~ magnesium fluoride, and 4 ~ beryllium metal.
BeO, NH4F BeO, NH4F
TEM-SADb TEM-mDb —c
d
—c C
BeO, MgF2 BeO, MgF2 BeO, MgF2 Be Be BeO BeO BeO BeO BeO BeO, Cu2O, CuO, CaF2, Cu, C BeO, Cu2O, CuO, CaF2 No crystalline constituents detected BeO, Cu2O, CuO, NaCl BeO, Cu2O, CuO, NaCl BeO, Cu2O, CuO, NaCl
C C Be BeO BeO BeO BeO BeO BeO BeO BeO —c
—c
BeO BeO
BeO
—c —c
a XRD ~ X-ray diffraction. b TEM-SAD ~ Transmission electron microscopy–selected area electron diffraction and TEM-mD ~ Transmission electron microscopy–micro electron diffraction (TEMmD). c Diffraction patterns were complex, indicating the presence of crystallinity but precluding the identification of individual crystalline constituents. d Blank cell indicates analysis was not performed on this size-fraction. e ESP ~ electrostatic precipitator.
J. Environ. Monit., 2004, 6, 523–532
527
Table 5 Elements identified in beryllium particles and powders using TEM-EDSa Aerosol
Stage
Elementb
Fluoride furnace
1 F, O, S 5 F, O, S, Si or C, Fe C, F, O, S, Si, Fe, Al ESPc Reduction furnace 1 O, Mg, F, S, Si, C 5 C, O, Si or C, F, O, Mg ESP C, Si or F, O, Mg Metal powder 5 O, Si Screener oxide 1 O, Si, C 5 O, Si, S, Fe, Al ESP O, Si, S, Fe, K Oxide powder Bulk O, Si 3 O, Si 5 O, Si ESP O, Si, C Master alloy 1 C, S, F, O ESP C, S, F, O Casting alloy 1 O, Si, S, Fe, Al, Ca or C, O, F 5 C, O, F a TEM-EDS ~ transmission electron microscopy–energy dispersive X-ray spectrometry. b Note that copper components of collected particles cannot be distinguished from the copper-based TEM grids. c ESP ~ electrostatic precipitator.
Fig. 3 TEM-SAD diffraction patterns illustrating the progressive refinement of the beryllium materials as they proceed from (a) fluoride furnace particles to (b) reduction furnace particles to (c) final product beryllium metal powder. The beam block entering from the top of each image is used to prevent the transmitted electron beam from washing out the contrast near the center of the pattern.
diffractograms. A halo is most pronounced in the pattern from fluoride furnace particles (Fig. 3a) indicating the presence of substantial amounts of amorphous material; less visible in the pattern from reduction furnace particles (Fig. 3b); and nearly absent in the pattern from the highly crystalline metal powder (Fig. 3c). Spots, which are associated with crystalline material, appear sparse in the diffraction patterns from the fluoride and reduction furnace particles (indicating few crystalline grains), but are more numerous in the pattern for metal powder (indicating many crystalline grains). Note that the spots in Fig. 3c are arranged in concentric rings that correspond to the interatomic spacing in beryllium metal. Crystalline substances identified using TEM-SAD are also summarized in Table 4. The presence of graphite, i.e. crystalline C, was clearly evident in both the fluoride furnace and reduction furnace materials, 528
J. Environ. Monit., 2004, 6, 523–532
which is consistent with the use of graphite linings in both types of furnaces. The TEM-EDS results for the elemental constituents of aerosol samples are summarized in Table 5. TEM-EDS analysis of the stage 1 fluoride furnace particles identified mostly F and O, with minor amounts of S. Some particles collected in stage 5 contained F, O, S, and Si, while others were composed largely of C and Fe. Particles in the ESP size-fraction were largely composed of C with varying amounts of F, O, S, Si, Fe, and Al. TEM-EDS of reduction furnace aerosol identified particles rich in O or Mg, but also containing F, S, Si, and C in stage 1 material. Particles in stage 5 were rich in C with O and Si, or C with F, O and Mg. Particles in the ESP sizefraction were mostly C with Si or F with O and Mg. In both these size-fractions the relative proportion of these elements varies among the particles. TEM-EDS analysis of stage 5 beryllium metal powder detected primarily O and Si. Each of the elements detected using TEM-EDS was consistent with the raw material inputs to the unit operations and expected emissions or are common impurities of finished product beryllium metal (White and Burke21). TEM-EELS analysis of stage 1 beryllium metal powder also detected O and Si, as well as Be. The presence of O is consistent with formation of a thin layer of beryllium oxide on the particle surface (Hoover et al.16) and Si is a common impurity of beryllium metal (Kirk-Othmer22). ICP-MS data reported as the mass percent of element for the process-sampled particles are presented in Table 6. Fluoride furnace particles contain 1.5–3.5% Be along with approximately 0.3% by mass of minor constituents including Mg, Fe, and Cu. Beryllium content of particles sampled from the reduction furnace was nearly constant with aerodynamic size and ranged from 14.2 to 15.3%. Stage 3 reduction furnace particles contained up to 7% Mg and 0.4% Al by mass. The presence of Mg at high levels is consistent with the reduction of beryllium fluoride to form magnesium fluoride (Fig. 1). The total mass of constituents reported does not add up to 100% for either material indicating other elements not analyzed for were also present. Beryllium content of reduction furnace particles was approximately a factor of 4 to 10 higher than fluoride furnace particles consistent with the chemical refinement of the materials as they progress through the furnace operations.
Table 6 Mass percent of elements in process-sampled particles determined using ICP-MSa Mass of element (%) Aerosol Fluoride furnace
Stage
Be
Al
Cu
Fe
Mg
Si
b
2 3.5 3 1.5 vLODc 0.01 0.3 0.01 Reduction furnace 1 14.2 2 14.9 3 14.2 0.4 0.001 7.0 4 15.3 Screener oxide 1 28.1 2 30.5 3 28.4 vLOD vLOD 0.5 0.01 1.0 Master alloy 1 8.2 2 7.9 34.6 3 5.5 4 3.2 21.3 5 3.1 1.9 16.0 ESPd Casting alloy 5 9.4 ESP 2.1 a ICP-MS ~ inductively coupled plasma-mass spectroscopy. b Complete analyses were performed for selected samples. Blank cells indicate elements for which analyses were not requested. c LOD ~ limit of detection. d ESP ~ electrostatic precipitator.
Beryllium oxide production. X-Ray diffraction, TEM-SAD, and TEM-mD patterns generated from screener beryllium oxide particles and finished product beryllium oxide powder were consistent with high-purity beryllium oxide (see Table 4 and the example X-ray diffractogram of stage 1 beryllium oxide powder shown in Fig. 4). TEM-EDS analyses of screener oxide particles and beryllium oxide powder identified primarily O with some Si (Table 5). TEM-EDS also identified the presence of C, S, Fe, Al, and K, which is consistent with historical analyses of beryllium oxide powders (Hall et al.15). Examination of particle surfaces with a reduced diameter TEM-EDS beam found higher concentrations of Si, probably in the form of amorphous silicon dioxide, at contact points between primary particles compared to concentrations of Si on open surfaces. This could be due to capillary condensation, which involves the thermodynamically preferred accumulation of condensed material at the contact points and may strengthen the attachments between primary particles.
TEM-EELS analyses of the screener oxide particles and beryllium oxide powder identified Be, O, and Si. ICP-MS analysis showed that screener oxide particles contain about 1.5% impurities as Si, Fe, and Mg at levels consistent with reports for beryllium oxide (Hall et al.15). Beryllium content of oxide particles from the screener unit operation ranged from 28.1 to 30.5% (Table 6), which is lower than the expected stoichiometry for beryllium oxide (i.e., 9/(9 1 16) ~ 0.36). Note that this anomaly may be attributed to analytical errors such as incomplete digestion of refractory beryllium oxide (Profumo et al.29) or weighing errors, e.g. particles were hydrated or contained residual hygroscopic beryllium sulfate when weighed.
Copper-beryllium alloy production. X-Ray diffractograms of master alloy (stage 3) and casting alloy (stage 2) particles shown in Fig. 5 illustrate the complex composition of these materials. Substances identified from diffractograms of master alloy particles were similar for stage 1 and stage 3 particles, i.e. beryllium oxide, copper(I) oxide, copper(II) oxide, and calcium fluoride, consistent with the raw materials input to the unit operation. Copper and C were identified in stage 1 but not stage 3 particles. Calcium sulfate may be present in stage 3 particles; the locations of diffraction peaks match a reference pattern but their intensities do not. Sulfate compounds are used to bind the pellets of beryllium oxide/C/ventilation fines charged into the furnace. Crystalline constituents were not detected in the ESP size fraction of master alloy particles (Table 4) probably because of the small primary particle size of particles. As primary particle size decreases the number of crystalline planes diffracting decreases resulting in a broadening of diffraction peaks, which in turn precludes identification of constituents. X-Ray diffraction patterns generated from casting alloy particles were also similar for all size fractions (data not shown) and contained beryllium oxide, copper(I) oxide, copper(II) oxide, and sodium chloride (Table 4). Sodium chloride is used as a flux in the furnace melt; the other constituents are consistent with expected emissions given the raw materials input to the unit operation. Note again that beryllium metal was not detected in these process-sampled particles. Workers in the master and casting alloy furnace areas are therefore exposed to beryllium oxide, not beryllium metal. TEM-SAD diffraction patterns indicated the presence of crystalline constituents in both of the copper-beryllium materials.
Fig. 4 X-Ray diffractogram illustrating the high chemical purity of beryllium oxide particles and powders. Peaks labeled 1 ~ beryllium oxide. Material in this example is beryllium oxide powder from stage 1 of the aerosol cyclone. J. Environ. Monit., 2004, 6, 523–532
529
Fig. 5 X-Ray diffractograms illustrating the complex chemical composition of copper-beryllium alloy particles sampled from (a) master alloy arc furnace and (b) casting alloy induction furnace. Peaks labeled 1 ~ beryllium oxide, 5 ~ copper(II) oxide, 6 ~ copper(I) oxide, 7 ~ calcium fluoride, and 8 ~ sodium chloride.
TEM-mD analysis of stage 1 particles from the casting alloy identified beryllium oxide (Table 4). TEM-EDS analysis of material collected from the master alloy unit operation identified particles rich in C, S, F, and O (Table 5), consistent with the presence of C, calcium sulfate, calcium fluoride, beryllium oxide, copper(I) oxide, and copper(II) oxide detected using XRD analysis. TEM-EDS analysis of particles collected from the casting alloy unit operation identified chemical composition that differed between size fractions (Table 5). Some particles were rich in O and Si, with minor constituents including S, Fe, Al, and Ca. Other particles were rich in C, with minor constituents including O or F (Table 5). Based on results from XRD analysis, O is probably associated with the presence of metal oxides. The other elements (i.e. Si, S, Fe, Al, Ca, C, and F) are believed to be only minor (i.e. v1% by mass) constituents because they were not detected using XRD analysis. ICP-MS analysis (Table 6) showed that the composition of particles varies with particle size. For example, the Be content of particles sampled from the master alloy unit operation decreased from 8.2% (stage 1) to 1.9% (ESP) with a simultaneous decrease in Cu content from 34.6% (stage 2) to 16.0% (ESP). The Be content of casting alloy particles also decreased from 9.4% (stage 5) to 2.1% (ESP). Note that C is used in the reduction of beryllium oxide to Be, as the furnace lining and for the electrodes used in the master alloy arc furnace. It is expected that as the Be and Cu content decreased with particle 530
J. Environ. Monit., 2004, 6, 523–532
size, the C (amorphous or graphite) content increased for these materials. Implications for exposure assessment. Having used the epidemiological results of Kreiss et al.3 as the basis for the selection of the sampling locations, we can use the physicochemical properties of the aerosols to help explain the exposure-response relationships observed in that study. Kreiss et al.3 noted that workers in the pebble plant (fluoride and reduction furnaces) had a higher risk of CBD even though their beryllium aerosol mass concentration exposures were lower than co-workers at other unit operations in the facility. The ranking of CBD prevalence for the unit operations (from highest to lowest) was fluoride and reduction furnaces w beryllium oxide screener w master alloy # casting alloy. The higher than expected prevalence of CBD at the pebble plant supports the hypothesis that the beryllium hazard potential is related to factors beyond airborne mass alone, e.g. the solubility or bioavailability (perhaps due, in this case, to the presence of F compounds). Compounds such as ammonium fluoride or magnesium fluoride on these particles could dissociate to produce F ion or react with water in the lung to form hydrofluoric acid, inducing pulmonary inflammation, which in turn would result in release of signaling cytokines, thereby acting to accelerate beryllium antigenicity. A response to inflammatory cytokines from F ion or hydrofluoric acid irritation would result in recruitment of
macrophage and T-lymphocyte cells to the vicinity of particles containing beryllium oxide. Antigen-presenting cells could engulf and process the beryllium oxide particles, and, as hypothesized, present solubilized beryllium to T-lymphocyte cells, causing T-lymphocyte activation. It is interesting to review the historical hypotheses for the causes of lung disease in beryllium workers. An early hypothesis was that disease in beryllium workers was exclusively attributed to exposures to irritating F (Hyslop et al.30). Later hypotheses correctly attributed disease to the beryllium component of exposures (Hardy and Tabershaw31). It is now useful to consider in more detail the potential interaction resulting from simultaneous exposure to beryllium and a directacting irritant agent such as F. An early report on the use of the skin patch test found that beryllium fluoride has a higher capacity to sensitize and causes a more vigorous positive skin reaction than beryllium sulfate, beryllium chloride, or beryllium nitrate salts containing the same amount of beryllium (Curtis8). Thus, beryllium fluoride present on particles could act as an adjuvant to enhance the action of the hypothesized beryllium antigen. In addition to obvious concern for dermal exposure to soluble salts of beryllium, there is evidence to suggest insoluble forms can initiate cutaneous sensitization in mice (Tinkle et al.9). The presence of beryllium fluoride on particles is plausible given the production process and is supported by microscopic and macroscopic observations (Stefaniak et al.5). TEM-EDS analysis detected F, a constituent of beryllium fluoride; however, beryllium fluoride was not detected using diffraction analyses. Thus, if present, it could be in an amorphous form. The end product of the fluoride furnace unit operation is beryllium fluoride, which is transferred to the reduction furnace and reacted with magnesium (Fig. 1). Thus it is plausible that volatilized beryllium fluoride could condense on particles emitted from these unit operations. TEM photomicrographs of fluoride furnace and reduction furnace particles revealed a surface coating consistent with the presence of beryllium fluoride. On a macro scale, bulk samples of the loose particles stored in separate tins under ambient conditions were observed to transform into agglomerated masses (consistent with the hygroscopic and reactive nature of beryllium fluoride) that assumed the boundaries of the sample container over time (Stefaniak et al.5). The changing chemical form of the aerosol prevented analytical determinations of the surface area and dissolution properties of these reactive aerosols as they might be encountered in the workplace (Stefaniak et al.5). Kent et al.32 used the epidemiological results of Kreiss et al.3 as the basis for the selection of sampling locations to investigate their hypothesis that the concentration of alveolar-deposited particles may be a metric of exposure for sensitization and CBD prevalence. Because results from spectrographic analysis are expressed as mass of elemental Be, the calculation of particle number concentration requires assumptions about particle shape, density, and composition. To determine particle number from particle mass and aerodynamic diameter, Kent et al.32 assumed particles were spherical and had the density of beryllium oxide. In our previous study (Stefaniak et al.5), we found that, for the aerosol materials studied, a spherical geometric model to convert from aerodynamic diameter to surface is not appropriate. With respect to chemical form, data presented in this paper for particles sampled from the ventilation ductwork of the unit operations, which are likely to be similar to aerosols sampled in work place air by Kent et al.32, found only beryllium oxide. Kent’s calculations assume beryllium oxide is present as individual particles. With the exception of the screener oxide, beryllium oxide was found in the presence of various other compounds such as ammonium fluoride, magnesium fluoride, copper(II) oxide, and copper(I) oxide. The distribution of beryllium oxide in these particle samples was not clear. Beryllium oxide could exist as individual
particles as assumed by Kent et al.32 or as a component of multi-component particles. The exact manner in which bioavailable beryllium stimulates and maintains the immunopathologic reaction associated with development of beryllium sensitization and CBD is unknown. With respect to bioavailability, we hypothesize that both particle dissolution rate and particle lifetime are involved in the input to the sensitization and CBD responses (Stefaniak et al.5). To further understand bioavailability, dissolution studies of selected beryllium particles and powders in a simulated phagolysosomal fluid (pH 4.5) are ongoing in our laboratory. When taken in conjunction with historical studies (Finch et al.33) in simulated extracellular lung fluid (pH 7.3), results of this work may improve our understanding of dissolution kinetics and lead to credible exposure-response relationships based on bioavailability. However, pending investigation of these mechanistic aspects of CBD, it appears premature to invoke an exposure limit based on any aerosol property other than mass at this time.
Recommendations. Future exposure assessments and epidemiological studies should incorporate strategies to characterize aerosol physicochemical properties in addition to beryllium mass. The approach described above has provided a comprehensive view of the aerosol physicochemical properties based on an array of analytical techniques. Cross-comparison of various techniques such as XRD and TEM-EDS has shown the results to be internally consistent and has strengthened the quality of the data. Limitations of this analytical approach included the substantial requirement of time, specialized equipment, and expertise. For some materials, the mass of material accumulated in the very small size fractions was insufficient to perform all of the planned characterization analyses. Another limitation was the reactivity of some materials, which prevented their retrospective evaluation in the laboratory (see for example, Stefaniak et al.5). Given the difficulties and expenses of performing such detailed analyses, we found the following analytical approaches to be useful: .aerodynamic size-separation followed by TEM to evaluate size and morphology (including the use of molybdenum sample grids for copper–beryllium alloy particles), .XRD to identify crystalline phases, .TEM-EDS and TEM-EELS for individual particle analysis to identify elements, .ICP-MS to quantify elemental constituents, and .gas adsorption to determine particle surface area (see for example our previous paper on SSA of beryllium aerosols, Stefaniak et al.5). In situations where the mechanisms of aerosol generation have been well characterized for a process, it may be sufficient to focus the measurement strategy on airborne mass concentration and particle size distribution with only periodic confirmation of the more detailed particle characteristics. In situations where the mechanisms of aerosol generation are not well understood the initial strategy may focus on the detailed characteristics of individual particles (e.g., TEM-EDS, TEM-EELS, and ICP-MS) especially as a function of particle size. Further studies of aerosol physicochemical properties independent of mass, coupled with dissolution studies (ongoing and historical) and in vitro and in vivo toxicology studies, may contribute to an understanding of the bioavailability and dose–response relationship of inhaled beryllium. That may lead to a better understanding of risk of CBD and to exposure limits that provide a better metric for disease risk than currently afforded by mass alone. However, a scientific basis does not yet exist to replace mass as the current metric of exposure. J. Environ. Monit., 2004, 6, 523–532
531
Acknowledgements The authors thank B. Hargis and B. Gallimore at LANL for their support and encouragement and Lovelace Respiratory Research Institute for assistance with the beryllium metal and oxide powders used in this study. We also thank K. Kreiss of NIOSH for valuable discussions and input on the selection of appropriate processes for characterization; M. Kolanz, T. Wolke, K. Smith, and L. MacAulay at Brush Wellman Inc. for helpful discussions on the manufacturing processes; S. Ehrman at University of Maryland for helpful discussions on thermodynamic aspects of particle formation; S. Tinkle at NIOSH for helpful discussions on the immune aspects of CBD; and A. Dufresne of McGill University for critical review of the manuscript. This project was supported by the LANL HSR Division TDEA program, LANL LDRD program, and NIOSH Research Grant 1R03 OH007447-01. A.B. Stefaniak also received support from NIEHS Training Program in Environmental Health Sciences ES07141.
References 1 L. A. Maier and L. S. Newman, in Environmental and Occupational Medicine, ed. W. N. Rom, Lippincott-Raven, Philadelphia, 1998, pp. 1017–1031. 2 J. H. Sterner and M. Eisenbud, AMA Arch. Ind. Hyg. Occup. Med., 1951, 4, 123. 3 K. Kreiss, M. Mroz, B. Zhen, H. Wiedemann and B. Barna, Occup. Environ. Med., 1997, 54, 605. 4 M. Eisenbud, Appl. Occup. Environ. Hyg., 1998, 13, 25. 5 A. B. Stefaniak, M. D. Hoover, R. M. Dickerson, E. J. Peterson, G. A. Day, P. N. Breysse, M. S. Kent and R. C. Scripsick, Am. Ind. Hyg. Assoc. J., 2003, 64, 297. 6 A. F. Eidson, A. Taya, G. L. Finch, M. D. Hoover and C. Cook, J. Toxicol. Environ. Health, 1991, 34, 433. 7 L. Richeldi, R. Sorrention and C. Saltini, Science, 1993, 262, 242. 8 G. Curtis, AMA Arch. Dermatol. Syphilol., 1951, 64, 470. 9 S. S. Tinkle, J. M. Antonini, B. A. Rich, J. R. Roberts, R. Salmen, K. DePree and E. J. Adkins, Environ. Health Perspect., 2003, 111, 1202. 10 T. T. Mercer, Health Phys., 1967, 13, 1211. 11 G. L. Finch, A. L. Brooks, M. D. Hoover and R. G. Cuddihy, In Vitro Toxicol., 1988–1989, 2, 287. 12 G. L. Finch, W. T. Lowther, M. D. Hoover and A. L. Brooks, J. Toxicol. Environ. Health, 1991, 34, 103. 13 M. D. Hoover, M. T. Carter and W. C. Griffith, in Aerosols: Science, Technology, and Industrial Applications of Airborne Particles, ed. B.Y. H. Liu, D. Y. H. Pui and H. J. Fissan, Elsevier Science Publishing Co., Inc., New York, 1984, pp. 1043–1046.
532
J. Environ. Monit., 2004, 6, 523–532
14 J. M. Benson, A. M. Holmes, E. B. Barr, K. J. Nikula and T. H. March, Inhalation Toxicol., 2000, 12, 733. 15 R. H. Hall, J. K. Scott, S. Laskin, C. A. Stroud and H. E. Stokinger, Arch. Ind. Hyg. Occup. Med., 1950, 2, 25. 16 M. D. Hoover, B. T. Castorina, G. L. Finch and S. J. Rothenberg, Am. Ind. Hyg. Assoc. J., 1989, 50, 550. 17 A. W. Stange, D. E. Hilmas and F. J. Furman, Toxicology, 1996, 111, 213. 18 P. K. Henneberger, D. Cumro, D. D. Deubner, M. S. Kent, M. McCawley and K. Kreiss, Int. Arch. Occup. Environ. Health, 2001, 74, 167. 19 P. C. Kelleher, J. W. Martyny, M. M. Mroz, A. J. Ruttenber, D. A. Young and L. S. Newman, J. Occup. Environ. Med., 2001, 43, 238. 20 A. J. Stonehouse, J. Vac. Sci. Technol. A., 1986, 4, 1163. 21 D. W White and J. E. Burke, The Metal Beryllium, The American Society for Metals, Cleveland, OH, 1955, 84–101. 22 R. E. Kirk, D. F. Othmer, J. I. Kroschwitz and M. Howe-Grant, in Encyclopedia of Chemical Technology, ed. J. I. Kroschwitz and M. Howe-Grant, John Wiley & Sons, New York, 1992, vol. 4, 4th edn., pp. 126–153. 23 C. T. Parsons and C. G. Felix, Operator’s manual for the five-stage series cyclone, Report no. SORI-EAS-80-845, Southern Research Institute, Birmingham, AL, 1980. 24 W. B. Smith, R. R. Wilson and D. B. Harris, Environ. Sci. Technol., 1979, 13, 1387. 25 A. C. Larson and R. B. Von Dreele, General Structure Analysis System (GSAS), Los Alamos National Laboratory Report LAUR 86-748, 2000. 26 B. H. Toby, J. Appl. Crystallogr., 2001, 34, 210. 27 W. B. Pearson, P. Villars and L. D. Calvert, Pearson’s Handbook of Crystallographic Data for Intermetallic Phases, ASM International, Metals Park, OH, 2nd edn., 1991. 28 United States Environmental Protection Agency, SW-846: Test Methods for Evaluating Solid Waste, Physical/Chemical Methods, US EPA Office of Solid Waste, Update III, NTIS. Springfield, VA, 1996. 29 A. Profumo, G. Spini, L. Cucca and M. Pesavento, Talanta, 2002, 57, 929. 30 F. Hyslop, E. D. Palmes, W. C. Alford, A. R. Monaco and L. T. Fairhall, United States Public Health Service, National Institute of Health Bulletin No. 181, The Toxicology of Beryllium, United States Government Printing Office, Washington, DC, 1943. 31 H. L. Hardy and I. R. Tabershaw, J. Ind. Hyg. Toxicol., 1946, 28, 197. 32 M. S. Kent, T. G. Robins and A. K. Madl, Appl. Occup. Environ. Hyg., 2001, 16, 539. 33 G. L. Finch, J. A. Mewhinney, A. F. Eidson, M. D. Hoover and S. J. Rothenberg, J. Aerosol Sci., 1988, 19, 333.