Characterization of Texture in Images by Using a Cellular Automata Approach Saturnino Leguizamón1, Moisés Espínola2, Rosa Ayala2, Luis Iribarne2, and Massimo Menenti3 1
National Technnological University, Regional Faculty of Mendoza, Argentina
[email protected] 2 Applied Computing Group, University of Almería, Spain 3 Aerospace Engineering Optical and Laser Remote Sensing, TUDelft, The Netherlands
Abstract. Spatial patterns in an image that shows a visual perception of roughness or softness of the surface is known as the texture of the image. Most of the analysis and description of texture found in the literature is based on statistical or structural properties of this attribute [2]. The field of cellular automata (CA), which has been developed mainly to model the dynamical behavior of systems, is based on the behavior or arrangements of pixel values and their neighborhood which, according to some rules behaves in different manners [2, 8]. In this paper, within the frame of structural approach, a novel method based on the properties of linear cellular automata is proposed to characterize different sort of textures. To this purpose, it is assumed that a binary version of the image under study was generated by a cellular automata technique. By using this model a number of textural primitives are found which allows the production of a characterizing image. In order to verify the feasibility of the proposed method, texture images generated by CA techniques as well as natural images has been used. Keywords: Texture, image texture, cellular automata, image interpretation, pattern recognition.
1 Introduction Image interpretation is one of the most important branches of computer science. This task aims at the acquisition of useful information from digital images coming from the fields of remote sensing, environmental sciences, medicine and industrial applications. To accomplish this goal, techniques of pattern recognition and artificial intelligence are used for managing the features of the image under study. The visual perception of roughness or softness of the surface is known as texture, this feature may be used as additional information for image interpretation. Despite the importance of this feature, at present and to our knowledge, it does not exist, a satisfactory and precise definition for texture [3]. Texture detection and analysis may be roughly divided into two categories: structural and statistical [3,4]. Methods that can handle the more structured textures use structural models of texture which assume that textures are composed of texture primitives [5, 10]. Statistical features based on second-order gray level statistics and M.D. Lytras et al. (Eds.): WSKS 2010, Part II, CCIS 112, pp. 522–533, 2010. © Springer-Verlag Berlin Heidelberg 2010
Characterization of Texture in Images by Using a Cellular Automata Approach
523
gray level difference statistics have been studied extensively since the appearance of the paper of R. Haralick [2], who proposed several features based on the cooccurrence matrix. More recently, combined methods of statistical and structural techniques [10], model-based approaches related to Markov random fields (MRF) [6 ], wavelet transform and fractal techniques have been investigated [7]. In this paper we use the cellular automata approach to characterize different sort of textures. The field of cellular automata (CA), which has been developed mainly to model the dynamical behavior of systems, is based on the behavior or arrangements of pixel values and their neighborhood which, according to some rules, which are given by the user, behaves in different manners [2, 8, 13]. The arrangement of pixel values performs spatial patterns which resemble the texture of an image; this fact is used in this paper to characterize different textures in an image. In the paper we use the natural textures provided by the Brodatz album [1] in order to verify the feasibility of the proposed method. This paper focuses upon the application of CA to characterize or describe different types of texture which are present in digital images. The purpose of the paper is to demonstrate that by using one of the simplest CA models, are useful to describe or characterize textured images. The paper is organized as follows: Section 2 describes the fundamentals of CA and its different applications of image processing. Section 3 presents a description of the proposed method for the characterization of texture in digital images by using cellular automata. Section 4 describes the experiences carried out on some images of the Brodatz Album by using CA. Section 5 presents the conclusions and future research directions.
2 Cellular Automata, a Brief Introduction Cellular automata (CA) were originally conceived by John von Neumann and Stanislaw Ulam in the 1940’s to provide a formal framework for investigating the behavior of complex systems [10]. Cellular automata are dynamic systems which are discrete in space and time [9,12,13]. A cellular automaton system consists of a regular grid of cells, each of which can be in one of a finite number of k possible states, updated synchronously in discrete time steps according to a local, identical interaction rule. Cellular automata (CA): is an array of “cells”, which interact with one another. The arrays usually form either a 1-D string of cells, a 2-D grid, or a 3-D solid. The essential features of a cellular automaton are: • •
its state: is a variable that takes different values for each cell. The state can be either a number or a property its neighborhood: is the set of cells that interact with the cell in question. In a grid these are normally the cells physically closest to it
A cell state will change according to a set of transition rules that apply simultaneously to every cell in the space. These rules are based on both the current state of the cell under study and also the collective state of its neighbors.
524
S. Leguizamón et al.
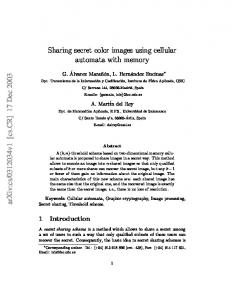
Examples of neighborhood used in cellular automata can be observed in Fig. 1.
( a ) linear symmetric
( b ) Moore
Fig. 1. Different types of neighborhood used in cellular automata
3 Linear Cellular Automata and Texture Let us consider a line of sites, each with value 0 or 1 (Fig. 2). If we designate ai (t) the value of a site at position i on the time step t, a family of rules is obtained by allowing the value of a site to be an arbitrary function of the values of the site itself and the two nearest neighbors on the previous time step:
ai (t+1) = F [ai -1 (t) + ai (t+1) + ai+1 (t+1) ]
(1)
given values : 111 110 101 100 011 010 001 000 possible rule : 0 1 1 0 1 1 1 0 (011011102 = 11010) Since each site can take k values, k=2 in our example, and considering a linear neighborhood of 3 sites, as in Fig.1 (a), there are 8 possible values for each group of 3 sites. Consequently there are 28 =256 possible rules, or functions, to be applied to these CA. A practical way to designate each rule is with one of the decimal numbers 0 to 255. This type of CA (linear 3-cells), which will be used across our paper, have many interesting properties that has been thoroughly studied by Wolfram [12, 13]. If we denote the value “1” with a black box and a “0” with a white one, it is possible to observe (Fig. 2) the configuration of a line at time t+1 when we apply the rule number 110 to the analysis of cells at the line in time t. In this case, any values are given to each block at the ends of the line at time t+1.
t t+1 Fig. 2. Configuration of linear sites at time t+1 after applying the “rule number” 110 to the line at time t. (black box= 1, white box= 0)
Fig. 3 shows 4 images, which are the outcomes of applying the procedure described above to the cells of a an initial line of 128 cells in length, with each cell presenting a random state. The procedure is applied, from top to down, along 128 “time steps”.
Characterization of Texture in Images by Using a Cellular Automata Approach
525
Regardless of the states which are present in the initial line, the configuration of the resulting image self-organizes in a way that shows a similar texture. Self-organization is one of the important properties that have this type of CA [13 ] [13]. The complete image presents a texture that depends upon the rule applied in each case: (a) Rule 45, (b) Rule 102, (c) Rule 129 and (d) Rule 225. By using the Wolfram’s notation [13] they can be respectively written as R45, R102, R129 and R225.
4 Proposed Method for the Characterization Texture in Images The textured images obtained by the process described above (Fig. 2) resemble the textural perception shown by natural images, although their geometric shapes are far
(a)
(c)
(b)
(d)
Fig. 3. Four patterns or textures (128x128 pixels), obtained when the proccess described in Fig.2 is applied to the top line of each image, starting from a disordered initial condition. The rules applied to each image are: (a) R45, (b) R102, (c) R129 and (d) R225.
526
S. Leguizamón et al.
to seeming a natural texture. However, the purpose of this paper is not the texture simulation, but showing the viability of the cellular automata techniques to describe or characterize the texture in digital images. In order to distinguish the natural textures from the texture images obtained via the cellular automata by the process described above, the latter will be mentioned as CA-textures. The method proposed in this paper relies on the properties of CA-textures generated by the aforementioned 3-cells rules. To that purpose we will explain the procedure by means of a simple example that is shown in Fig. 4: given two consecutive lines of a CA-texture image (only the values 1 and 0 appear in each site), it is known that the second line takes values which result from the application of a 3-cell rule (rules 0 to 255) on the first line. In particular, each 1 in the second line results from the application of a CA rule to the 3 sites in the upper line. That is; for every cell with the state 1 in the second line we observe the states of the upper 3 cells which are located above the chosen cell. These 3 cells represent a binary number which when coded in a decimal number can take the values 0 to 7. Those values are indicated in the third line of Fig.4. Since in this example the decimal numbers are 1, 2, 5 and 6 it is easily inferred that the second row was obtained by the application of a linear 3-cells rule that in binary notation has a 1 in the positions 1,2,5 and 6; that is, the rule is 011001102 = 10210 , which will be indicated as R102. As it can be observed, the procedure does not provide information about the sites located in the image borders or where a 0 is present. It should be pointed out that, in some sense, the method is linked to the inversion properties of the CA [9].
1st. line : 1 2nd. line : 1 3-cells number : --
0 1 5
1 1 2
0 1 5
1 0 --
1 0 --
1 1 6
0 1 5
1 0 --
1 1 6
0 1 5
1 1 2
0 0 --
0 1 1
1 0 --
Fig. 4. Acquisition of a 3-cells decimal numbers related to the configuration of ones and zeros in two consecutive binary lines of a CA-texture
4.1. Analysis of images with CA-texture When this type of analysis is extended to a full CA-texture, we have as many lines as the number of rows of the image, therefore, in order to calculate the corresponding generation rule, the quantity of decimal numbers in the whole image is calculated. When the proposed method is applied to the CA-texture image shown in Fig. 5(a), the resulting quantity of decimal numbers, or histogram, is shown in Fig. 5 (b). From the observation of Fig. 5 (b) it is possible to see that the only decimal numbers present in the graphics are 0, 5, 6 and 7, which in binary notation is 11100001 =22510. This result means those groups of 4 cells (or pixels) that take place in the calculation of this histogram participate also in the appearance of the observed texture of the CA-image. According to the structural approach in texture analysis, each group of four-cell configuration that take part in the calculation above can be considered as a texture primitive of the texture under study. Fig. 5 shows the image and the histogram of the primitives belonging to the CA image resultant from R225.
Characterization of Texture in Images by Using a Cellular Automata Approach
527
Quantity and type of 3 binary cells 2500 20
2000
40 1500 60 80
1000
100
500
120 20
40
60
80
100
120
0
0
(a)
1
2
3
4
5
6
7
(b)
Fig. 5. (a) The CA-image obtained by Rule 225, (b) the histogram of decimal numbers obtained by the application of the proposed method
The histogram of decimal numbers resulting from the application of the proposed procedure plays a important role in the texture analysis of any binary image, being this a textured natural image or a CA-texture image. Since the mentioned histogram is associated to the number of primitives of a CA-texture, we will notate it as the primitive histogram (PH).
1
2
5
6
Fig. 6. Textural primitives corresponding to the texture generated by rule 102 (Fig. 3 (b)). The blocks with black circles are 1, the white boxes are 0.
The proposed procedure can also be applied to an image composed by different CA-textures, such as the image shown in Fig. 7 (a). This image, which have a size of 256 x 256 pixels (or cells), is the composition of four CA-images, 128 x 128 pixels in size, generated by rules: R12 and R123 in the top row, and rules R60 and R90 in the bottom row. The texture analysis of the composed image was made by applying the proposed procedure by blocks. In this case, as an example, blocks of 16 x 16 pixels in size were used, with a total number of 256 blocks in the complete image. Each block in the output has a gray level associated to the texture primitive present in the PH. When we built and image with the resulting blocks in their respective position, result the image shown in 7 (b). This image looks as a textural segmentation of the image in Fig. 7 (a).
528
S. Leguizamón et al.
Fig. 7. (a) Image (256 x 256) formed by 4 sectors of different textures: top sectors: R121 and R153, bottom sectors: R60 and R90. (b) A gray scale image resulting from the application of the proposed procedure. The analysis in (a) was made by block observations of 16 x 16 pixels in size.
4.2 Experiences with Natural Images In order to apply our method to the analysis of natural textures, which is our main interest, we will assume that the textural patterns shown by these images are the result of a similar process as that produced in the CA-images. However, in order to carry out the proposed method in this sort of textures we have to overcome two problems: first, the number of gray levels is normally more than two. This problem can be solved by performing a binarization of the image under study, with the admission of a natural loss of textural details. Second, when we calculate the PH in the corresponding binary image it appears a varied number of primitives but with a scattered frequency of occurrence. In fact, in the resulting PH for these images there may be present the 256 primitives, therefore, only those most important must be chosen. So far, when we talk about the PH calculation, we are referring to the resulting PH of a row by row calculation in a given texture. We call this histogram the horizontal PH (HPH). In order to take account of other primitives, which are not present in the HPH, we will perform the same process in the vertical direction of the image (i.e. column by column). We call this calculation the vertical PH (VPH). Of course, the additional information provided by the VHP will improve the characterization of the texture under study, but at the price of increasing the number of options for the selection of the best primitives. The proposed method for characterizing the texture of natural images can be summarized as follows: 1. 2.
A natural textured image is given A binarization of the given image is carried out. The resulting image (represented by ones and zeros) is supposed generated by a linear CA process
Characterization of Texture in Images by Using a Cellular Automata Approach
529
Fig. 8. Top row, 3 images of the Brodatz Album: D3, D49 and D85. Bottom row, 3 binary images of the originals. They are noted as: bin3, bin49 and bin85.
(a)
(b)
Fig. 9. Normalized histograms of primitives for the binary Brodatz image D85. (a) HPH (horizontal direction), (b) VHP (vertical direction).
3. 4. 5. 6. 7.
Calculation of the HPH of the binary image by the proposed procedure (Fig. 4) Selection of the most important number of primitives in the HPH (1 to 8) Generation of CA-texture according to the rule emerging from step 6 (horizontal characteristics) Calculation of the VPH of the binary image by the proposed procedure (Fig. 4) Selection of the most important number of primitives in the VPH (1 to 8)
530
S. Leguizamón et al.
8. 9.
Generation of CA-texture according to the rule emerging from step 8 ( vertical characteristics) Generation of an image that characterizes the given texture in step 1. This image is a composition (normally the addition) of the images obtained in steps 5 and 8.
(a)
(b)
Fig. 10. CA texture images obtained as a result of choosing the most important primitives of histograms in Fig. 7. In this case 6 primitives were taken from the vertical histogram and 3 primitives from the horizontal one. By applying the proposed procedure the rules 207 (vertical) and 193 (horizontal) were obtained.
Fig. 11. Left: image bin3 (256x 256). Right: image approximation of bin3 obtained by the composition of CA images R95 (H) and R95 (V) which were derived by using 6 components of each primitive histogram (H and V).
Characterization of Texture in Images by Using a Cellular Automata Approach
531
Fig. 12. Left: image bin49 (256x 256). Right: image approximation of bin49 obtained by the composition of CA images R217 (H) and R76 (V) which were derived by using 5 components of the HPH and 3 components of the VPH.
Fig. 13. Left: image bin85 (256x 256). Right: image approximation of bin85 obtained by the composition of CA images R207 (H) and R193 (V) which were derived by using 6 components HPH and 3 components of the VPH.
As an illustrative example we applied the procedure to binary version of the Brodatz image D85, which in Fig. 8 is denoted as bin85. After application of the procedure described in Fig. 4, the horizontal primitive histogram (HPH) is shown in Fig. 9 (a). In the same way, the VPH is obtained and presented in Fig. 9 (b). The steps 4 and 7 of the procedure are perhaps the most difficult to implement since, in this stage of the study, we have not found a practical method to overcome this problem. By the observation of each primitive histogram one chooses the most convenient type and number of primitives (bars in the histogram), which are those that have the best performance in approximating, and therefore characterizing the texture under study. Once the best primitives have been chosen, a rule number is obtained for each direction and it is
532
S. Leguizamón et al.
possible to generate the horizontal and vertical “indicators” of the original texture. These textural indicators are shown in Fig. 10. By composing the textural indicators in some way, one may get a single image which characterizes the original texture. Figures 11, 12 and 13 show the results obtained by the application of the proposed procedure to Brodatz images D3, D49 and D85. The composition used in these examples was a simple addition of each component.
5 Conclusions In this paper, a novel method based on the properties of linear cellular automata is proposed to characterize different sorts of textures. We have here employed the concept of textural primitives which are used when this type of analysis is performed in a structural approach. The proposed method stems from the properties of texture images which are produced by a linear 3-cells CA model, which is one of the simplest models in this field. The main purpose of this study is to show the feasibility of the CA techniques to characterize natural textures. With this aim, binary texture images provided by the Brodatz Album have been used. Though the results of our experiences have been enough satisfactory to accomplish the paper objective, we are conscious that many improvements have yet to be made. In that sense, future task are being planned to improve, for instance, the decision method of looking for the best primitives, the use of more complex CA models, the increase of the number of admissible states in each cell, etc. In summary, we are convinced that the field of cellular automata deserves the efforts to be explored for carrying studies in image texture which is one of the most challenging features in image interpretation
Acknowledgments This work has been partially supported by the EU (FEDER) and the Spanish MEC under grant of the TIN2007-61497 and TIN2010-15588 projects.
References 1. Brodatz, P.: Textures: a Photographic Album for Artists and Designers. Dover Publications, New York (1966) 2. Gardner, M.: The Fantastic Combination of John Conways’s New Solitaire Game “Life”. Scientific American 223(4), 120–123 (1970) 3. Haralick, R.M., Shanmugam, K., Dinstein, I.: Textural features for image classification. IEEE Trans. On System, Man, and Cybernetics, SMC-3(6), 610–621 (1973) 4. Haralick, R.M.: Statistical and structural approaches to texture. Proceedings of the IEEE 67, 786–804 (1979) 5. He, D.C., Wang, L.: Texture Unit, Texture Spectrum, and Texture Analysis. IEEE Trans. On Geoscience and Remote Sensing 28(4) (July 1990)
Characterization of Texture in Images by Using a Cellular Automata Approach
533
6. Leguizamón, S.: Description of Terrain Textures by Fractal and Markov Random Fields Techniques. In: Proceedings of the 2nd. International Symposium on HMRS Cartography, Chinese Academy of Sciences, Astronautic Publ. House, P.R. of China, Beijing (1993) 7. Leguizamón, S.: Characterization of Texture in Remotely Sensed Images by using the Wavelet Transform. In: Proceedings of the IV International Symposium on HMRS Cartography. University of Karlstad, Karlstad (1996) 8. Preston, K., Duff, M.: Modern Cellular Automata, Theory and Applications. Plenum Press, New York (1984) 9. Toffoli, T., Margolus, N.: Invertible Cellular Automata: A Review. Physica D 45, 229–253 (1990) 10. Umarani, C., Ganesan, L., Radhakrishnan, S.: A combined statistical and structural approach for texture representation. Asia J. Inform. Technol. 5, 1434–1440 (2006) 11. von Neumann, J.: Theory of Self-Reproducing Automata. University of Illinois Press, Champain (1966) 12. Wolfram, S.: Universality and complexity in cellular automata. Physica D 10 (1984) 13. Wolfram, S.: A New Kind of Science, http://www.wolframscience.com/nksonline/toc.html (last accessed, March 2010)