used in desk-top conferencing multimedia applications such as. Netmeeting, NeVot ... digitized voice in two-way telephone conversations very well, it is important to ... able for call-level modeling in the traditional telephone net- work, it fails to ...
Characterizing Packet Audio Streams from Internet Multimedia Applications Chen-Nee Chuah
Randy H. Katz
Department of Electrical and Computer Engineering University of California, Davis Davis, CA 95616, USA
Department of Electrical Engineering and Computer Sciences University of California, Berkeley Berkeley, CA 94720, USA
Abstract— We analyzed 70 voice traces collected from IPtelephony applications, multicast lectures, and multimedia conferencing sessions which involve multiple speakers and different dynamics of interaction beyond two-way conversations. Results show that application differences have significant impact on the traffic characteristics. The conventional exponential model, established for telephone conversations, fails to accurately capture the packet level activity observed in these traces, e.g., the heavy-tail distributions of the talkspurt and silence periods. We classify the traces into four types based on their audio contents: audience, lecture, multi-party conferencing and conversation. Further analysis shows that Weibull is a better matching statistical model and achieves lower mean-square-error than the exponential model (by 1 to 2 orders of magnitude) in approximating the audio streams for all four cases.
I. I NTRODUCTION The startling growth of Internet access, and advance in IPtechnology have resulted in a push for an integrated “IP-based core” architecture to support data, voice and wireless access. This has driven the computer-telephony integration, and largescale deployment of Voice over IP (VoIP) is expected in the near future. Packet audio refers to real-time transmission of digitized audio information over the Internet, and is commonly used in desk-top conferencing multimedia applications such as Netmeeting, NeVot, vic & vat and CuSeeMe. With the ubiquitous streaming audio players and advance in new technologies like speech recognition, packet voice begins to constitute an increasing fraction of Internet traffic. The major problem with sending voice on the Internet is the unreliable voice quality. Interactive voice applications can tolerate very little delay variation and packet loss. Unfortunately, the current best-effort service in the Internet does not provide any form of quality assurance. There have been numerous studies on the end-to-end packet delay and loss characteristics in the Internet ([1], [2]), and how they impact the interactive voice traffic ([3], [4]). The measurements are based upon current datagram service of the Internet using either UDP or TCP protocols. Based on these studies, many adaptive techniques are proposed to make packet voice applications more tolerant of variations in packet delays and losses. For example, the playback delay at the receiver-buffer can be dynamically adjusted to The work in this paper was completed while C-N. Chuah was at the University of California, Berkeley. She currently also holds a visiting position at Sprint Advanced Technology Laboratories in Burlingame, CA, USA.
compensate for unpredictable delays and delay jitter ([5], [6]); reconstruction methods, such as waveform substitution and linear predictive coding (LPC) redundancy [7], are introduced at the receiver to compensate for packet loss in Internet audio. Other QoS mechanisms include layered encoding, and forward error correction (FEC) [8]. However, the majority of the performance analysis on packet voice systems are based on the classic on-off model discovered by Brady([9]-[11]). Audio activities are modeled as alternating between two states: talkspurt and silent (or on and off). Both talkspurt and silence periods of digitized voice are exponentially distributed according to [9]. Although this describes the digitized voice in two-way telephone conversations very well, it is important to validate whether it is suitable for modeling the newly emerging multimedia applications, e.g., distance learning, multimedia conferencing, and interactive games. Initial work to re-examine the traditional voice model was reported in [12], in which the exponential distribution was rejected as a model for packet voice traffic. However, the author did not propose other models that could better describe the packet voice traffic [12]. In addition, results in [12] were based on two types of traces: conversations and scripted speech. It is important to extend the studies to include other multimedia applications that we commonly encounter today, which often involve dynamic interactions between multiple sources and diverse traffic behavior. Finding a better matching statistical model is important for network resource provisioning and Quality of Service (QoS) management. Bandwidth reservation and admission control algorithms are necessary to ensure that the multimedia streams are delivered with packet losses and delay below a certain threshold. Many of these algorithms rely on statistical modeling of Internet workload traffic to predict the required link capacity or choose the appropriate admission threshold. The performance of such schemes depend on how accurate the chosen model describes the traffic characteristics. This paper studies the characteristics of 70 audio traces collected from multimedia conferencing, multicast [13] lectures, distant learning and IP-telephony applications. The rest of the paper is organized as follows. Section II describes the traditional on-off Markov chain used to model voice conversations. Section III discusses the details of trace collection and processing. Section IV reports the statistical analysis of the actual voice streams and shows how application differences can affect the
TABLE I S UMMARY OF T RAFFIC T RACES 0 kbps
0 kbps
Type
Classroom Lecture
11
Duration (minutes) (min) 1.26 (max) 123.6 (min) 4.4
Multi-party Conferencing
26
(max) 71.8 (min) 0.5
100237 pkt, 34.1 MB 528 pkt, 0.18 MB
Conversation
24
(max) 108.2 (min) 1.2 (max) 20.8
26819 pkt, 9.12 MB 1553 pkt, 0.11 MB 4287 pkt, 0.31 MB
Audience (a)
0
1
2
Number of Traces 32
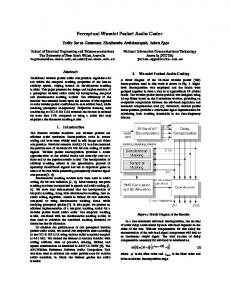
(b)
Fig. 1. (a) Conventional voice model using a two-state Markov. (b) A simple Markov process to represent number of simultaneously active calls. traffic characteristics. In this section, we examine the suitability of the exponential distribution to describe the “talkspurt” and “silence” holding-time of the traces. We then introduce a better approximation model, Weibull distribution, and quantify the improvement in terms of mean-square-error (MSE). Section V concludes the paper. II. BACKGROUND In the conventional model [11], each voice source alternates between talk (on) and silence (off) periods, which are independent and exponentially distributed [11] with average durations of µ1 and λ1 , respectively. A commonly used model for a speaker in a voice call is a continuous-time, discrete-state Markov process shown in Figure 1a. During an active period, constant bitrate (CBR) data is generated, and no data is transmitted during the silence period. Therefore, statistical multiplexing is possible, but the multiplexing gain depends heavily on the activity cycle of the voice source and characteristics of the “on” and “off” holding-periods. The ITU-T specification [14] recommends an activity cycle of 39%, corresponding to λ1 = 1.004 s and µ1 = 1.587 s. When there are multiple calls in progress, a simple Markov process has been widely used to model the situation, with the state being the number of simultaneously active calls (Figure 1b). Although a one-dimensional Markov chain is suitable for call-level modeling in the traditional telephone network, it fails to approximate the packet arrival process. In [12], the author shows that the exponential model failed to estimate the buffer performance when multiple voice sources are multiplexed at the buffer. It is important to understand the aggregate voice traffic behavior, and derive a better approximation model. III. PACKET VOICE T RACES In our experiments, packet voice traces were collected from actual technical conference meetings, weekly lectures, tech-
Voice Data (packets, MBytes) 616 pkt, 0.21 MB 3747 pkt, 1.27 MB 6488 pkt, 2.21 MB
nical demonstrations and social conversations as explained in Section III-A. All the 70 traces are classified into four categories based on their audio content: • Classroom Lecture type: These traces were recorded from speakers who gave a lecture or lead a group discussion. Longer talkspurts were observed because there was only one centralized speaker throughout the session. Occasional long silence periods were introduced when the speaker was interrupted by questions from the audience. • Audience type: Audio streams from remote students who attended the CSCW class using MASH tools [15] belong to this category. These traces have mostly long silence periods with occasional talkspurts, since the students were mostly silent except when they asked questions or made comments in class. • Multi-party Conferencing type These were audio streams recorded from multimedia conferencing sessions that involve multiple speakers. Since conferencing applications involve multiple speakers, the traces have longer silence periods than two-way IPtelephony, because more time was spent listening to other participants or waiting for “floor-control” to start speaking. • Conversation type These traces were collected from 2-way telephone conversations. A. Trace Collection The traffic traces were obtained from the following three sources and the breakdown of the traffic is tabulated in Table I: • CSCW Electronic Classroom 58 traces were collected from a weekly Computer Science graduate-level class, Computer-Supported Cooperative Work (CSCW)[16] over 14 weeks in the Fall 1997.
CSCW was held in a conference-style “electronic classroom” well-equipped with collaborative technology, e.g., computers, video cameras, monitors, and a Xerox LiveBoard. Some students attended the course from other rooms or buildings using remote collaboration tools, e.g., vic [17] and vat [18]. 11 traces are classified as classroom lecture, 32 as audience, and 15 as multi-party conferencing. • Research Groups’ Multimedia Conferencing 11 traces were recorded from conference calls between professors, staff members, students and industrial sponsors of two research groups during January-September, 1998 and April-December 1999. All the traces are classified as multi-party conferencing type. • CTS Test-bed with H.323 Gateway 24 traces were recorded from actual telephone conversations between students using the Computer Telephony Service(CTS) testbed [19] from January-April 2000, where calls were made either from computer to computer, computer to normal PSTN phone or vice-versa via a H.323 Gateway. All the participants in the CSCW class and multimedia conferencing communicate through three primary kinds of media: video, audio and shared whiteboard, using MASH tools [15] such as vic, vat and “MediaBoard”(mb), respectively. These applications are launched on either Window-NT machines or Unix machines running Free-BSD. We are only interested in the audio packets recorded in these sessions/lectures. B. Trace Processing The voice traces were recorded according to the MASH archive file formats [20]. All data packets of one media type from a single source were stored in one file. Information such as the media type, the source identity, starting and ending time stamp were contained in the file header. The sender timestamp, receiver timestamp and sequence number of each packet were recorded. All the packets were sent using RTP transmission format, with 8 KHz 8 bits/sample PCM codec and 40 ms frame per packet. During the “talk” state, 340 bytes packets were generated every 40 ms (with 12 byte RTP, 8 byte UDP header and 320 bytes voice data). We determined the talkspurt and silence periods by examining the interval between sender time stamps and locating gaps that were greater than 100 ms. Since the smallest meaningful element of speech, the phoneme, has an average size of 80-100 ms, we interpreted a pause smaller than 100 ms as a stop consonant or a minor break within the same talkspurt. We only ran statistical analysis on specific segments of the voice traces where actual conversations or lecture were in progress, and the rest of the traces were truncated. For example, a speaker sometimes had to restart his/her session because one of the tools (e.g., vic or vat) failed to function. Although the voice packets were still recorded from the vat session, we truncated the packets recorded during the disruptions.
TABLE II T RAFFIC S TATISTICS OF C LASSROOM L ECTURE
Trace 1 2 3 4 5 6 7 8 9 10 11
mean std mean std mean std mean std mean std mean std mean std mean std mean std mean std mean std
Talkspurt (second) 56.17 70.30 17.78 311.7 21.9 4.75 6.64 12.87 25.86 67.8 19.2 23.0 39.1 517.4 14.1 22.1 2.31 2.29 9.62 63.7 31.7 58.0
Silence (second) 1.95 3.84 2.23 1.56 2.14 1.01 1.12 1.69 1.17 1.65 29.6 52.4 2.88 3.06 3.0 14.9 0.86 1.71 0.76 3.16 2.68 1.66
Activity Cycle 0.97 0.89 0.91 0.86 0.96 0.39 0.93 0.82 0.73 0.93 0.92
TABLE III E FFECT OF AUDIO C ONTENT ON T RAFFIC S TATISTICS AND C OMPARISONS TO THE
T RADITIONAL M ODEL
Type
Activity Cycle
Audience
(min) 0.01 (max) 0.51 (min) 0.39 (max) 0.96 (min) 0.015 (max) 0.75 (min) 0.12 (max) 0.95 1.004
Classroom Lecture Conference Call Conversation Traditional Model
Talkspurt (second) 3.02 4.24 19.2 56.2 4.49 12.4 0.66 2.72 1.587
Silence (second) 272 4.14 29.5 1.95 291 4.17 4.9 0.13 0.39
IV. T RAFFIC C HARACTERIZATION A. Traffic Statistics The empirical mean and standard deviation of talkspurt and silence periods were computed for each trace. Activity cycle1 is defined as the fraction of time for a voice source to be in “talk” state. Results for lecture type traces are tabulated in Table IV-A. Table IV-A shows the maximum and minimum activity cycles observed in the traces for each trace type, with the corresponding mean talkspurt, and mean silence period. These observations are compared to the values used in the traditional model (Section II).
TABLE IV E FFECT OF AUDIO C ONTENT ON T RAFFIC S TATISTICS AND C OMPARISONS TO THE T RADITIONAL M ODEL
Type Audience Classroom Lecture Conference Call Conversation Traditional Model
mean std mean std mean std mean std
Talkspurt (second) 1.05 3.64 22.2 17.5 5.86 16.1 1.58 1.93 1.004
Silence (second) 3.64 13.4 4.39 5.39 7.47 19.13 0.87 0.80 1.587
Activity Cycle 0.22 0.83 0.44 0.64 0.39
1 0.9
Cumulative Distribution
0.8 0.7 0.6 0.5 0.4 0.3
Actual voice traffic Weibull with empirical mean Exponential with empirical mean Conventional model
0.2 0.1 0 0
20
40 60 Talkspurt Holding Time (s)
80
100
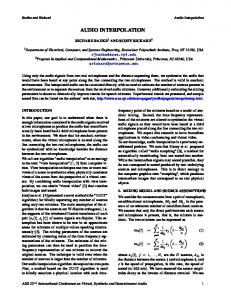
Fig. 2. Probability distribution of ’talkspurt’ holding period as observed in conference call traces and as predicted by different distribution models. 1 0.9
Cumulative Distribution
0.8 0.7 0.6 0.5 0.4 0.3 Actual voice traffic Weibull with empirical mean Exponential with empirical mean Traditional model
0.2 0.1 0 0
20
40 60 Silence Period Holding Time (s)
80
100
Fig. 3. Probability distributions of ’silence’ holding period as observed in conference call traces and as predicted by different distribution models.
B. Distributions on Talkpurt and Silence Periods Fig. 2 and Fig. 3 show the cumulative distribution functions (CDFs) of the talkspurt and silence periods for the actual conference call traces. The distributions predicted by the traditional exponential model with mean of 1.004 s for talkspurt and 1.587 s for silence periods, are plotted on the same graphs (dash lines). The solid lines show the exponential model using empirical mean (5.86 s). The traditional model follows the empirical distribution closely up to 1 second, but the discrepancy grows quickly after that. On the other hand, there is consistent discrepancy between the actual distributions and the exponential model with empirical mean. The distribution of the actual talkspurt are more heavy-tailed, and cannot be approximated well by an exponential model even when the empirical mean is known. We quantify the discrepancy between the empirical distribution and the approximation model in terms of mean square error: � M 1 |F (x) − Fˆ (x)|2 dx M SE = M 0 where F (x) is the empirical distribution of talkspurt or silence periods, Fˆ (x) is the approximation model, and M is the maximum value of talkspurt or silence periods. Through statistical testing, we evaluated how well a particular distribution describes the empirical data. We experimented with Lognormal, Pareto and Weibull distributions [21]. Further analysis show that Weibull model, with the empirical mean and variance, is the most suitable model to approximate the packet voice traffic. A general Weibull distribution function is characterized by two parameters, a and b, as the following: x b
F (x) = 1 − e−( a ) , x ≥ 0.
(1)
Through curve fitting, we found F (x) with a=0.2276 and b = 1.346 provides the best match to the empirical distributions. As shown in both Fig. 2 and Fig. 3, the Weibull model (dashdot lines) approximates the empirical distributions of talkspurt and silence periods very well. The MSE for all three models are tabulated in Table V and Table VI for talkspurt and silence periods, respectively. For conference call traces, Weibull model achieves MSE of 10−4.2 , more than 10 times better than Exponential model with empirical mean (10−2.6 ) and traditional model (10−2.3 ). The same analysis is repeated for other types of packet voice traces. The results are summarized in Table V and Table VI. Audio contents have direct impact on the suitability of an approximation model. For the telephone conversation case, the exponential model with empirical mean is almost as good as the Weibull model. However, for non-traditional multimedia traffic such as conference call, classroom lecture or audience type, the Weibull model is a much better approximation model. This is not surprising since the exponential model was originally proposed for describing two-way conversations. 1 Activity
cycle =
λ λ+µ
TABLE V M EAN S QUARE E RROR OF D IFFERENT A PPROXIMATION M ODELS FOR TALKSPURT H OLDING T IME
Mean Square Error Audience Classroom Lecture Conference Call Conversation
Weibull with Empirical Mean 10−3.2 10−4.0 10−4.2 10−3
Exponential with Empirical Mean 10−2.1 10−2.1 10−2.6 10−2.8
Traditional Model 10−2.1 10−2.6 10−2.3 10−2.8
TABLE VI M EAN S QUARE E RROR OF D IFFERENT A PPROXIMATION M ODELS FOR S ILENCE P ERIOD
Mean Square Error Audience Classroom Lecture Conference Call Conversation
Weibull with Empirical Mean 10−3.7 10−3.2 10−3.8 10−2.5
V. C ONCLUSIONS We analyzed 70 voice traces and showed that application differences can affect the traffic characteristics. The statistics of talkspurt and silence periods are diverse, and significantly different from the conventional model. Further analysis shows that the Weibull model achieves lower MSE than the exponential model, by at least one order of magnitude, in approximating the talkspurt and silence holding periods of the voice streams. The following are two issues that this paper does not address: • We only consider traces over medium time scales (15 minutes - 1.5 hours). Data from playback of pre-recorded program or broadcast station may have very different traffic characteristics. • All our traces are based on RTP packets sent over multicast [13] using the MBone tools [15], including virtual audio terminal (vat) [18]. The speakers were using these tools on either Window-NT or Free-BSD machines. We do not characterize how application software and hardware affect the empirical distributions. ACKNOWLEDGMENTS The authors are grateful to Prof. J. Landay and Angela Schuett for sharing the traces collected in research meetings and CSCW class; J. Shih and R. Gummadi for their assistance in recording the voice traces from the CTS testbed. R EFERENCES [1] D. Sanghi, A.K. Arawala, O. Gudmundsson, B.N. Jain, “Experimental Assessment of End-to-End Behavior on Internet,” IEEE Infocom’93, pp. 867-874, March 1993. [2] J. Bolot, “End-to-end Packet Delay and Loss Behavior in the Internet,” SigComm’93, pp. 289-298, 1993.
Exponential with Empirical Mean 10−2.2 10−2.2 10−2.1 10−2.4
Traditional Model 10−2.5 10−2.2 102.4 10−1.6
[3] J. Bolot, H. Crepin, A. Garcia, “Analysis of Audio Packet Loss in the Internet,” Proc. of Nossdav, pp. 163-174, 1995. [4] N. F. Maxemchuk and S. Lo, “Measurement and Interpretation of Voice Traffic on the Internet,” IEEE International Conference on Communications, vol.1, pp.500-7, 1997. [5] R. Ramjee, J. Kurose, D. Towsley, and H. Schulzrinne,’ “Adaptive Playout Mechanisms for Packetized Audio Applications in Wide-Area Networks,” Proc. IEEE Infocom, vol. 2, pp. 680-8, April 1994. [6] S. B. Moon, J. Kurose, and D. Towsley, “Packet Audio Playout Delay Adjustment: Performance Bounds and Algorithms,” ACM/Springer Multimedia Systems, vol. 6, pp. 17-28, January 1998. [7] V. Hardman, M. A. Sasse, M. J. Handley, and A. Watson, “Reliable Audio for Use over the Internet,” Proc. INET, 1995. [8] S. Fosse-Parisis Bolot, and D. Towsley, “Adaptive FEC-Based Error Control for Interactive Audio in the Internet,” IEEE Infocom, March 1999. [9] P.T. Brady, “A Technique for Investigating On-Off Patterns of Speech,” BSTJ, vol. XLIV, No.1, pp. 1-22, January 1965. [10] P.T. Brady, “A Statistical Analysis of On-Off Patterns in 16 Conversations,” BSTJ, pp. 73-91, January 1968. [11] P.T. Brady, “A Model for Generating On-Off Speech Patterns in Two-Way Conversation,” BSTJ, pp.2445-2472, September 1969. [12] S. Deng, “Traffic Characteristics of Packet Voice,” IEEE International Conference on Communications, vol. 3, pp. 1369-74, June 1995. [13] S. Armstrong, A. Freier, and K. Marzullom “Multicast Transport Protocol,” DARPA RFC 1301, Network Working Group, February 1992. [14] ITU-T Rec. P.59, “Artificial Conversational Speech,” 1993. [15] MASH Tools and Services, http://www.openmash.org/users/tools/index.html. [16] “CS294-7: CSCW using CSCW”, U. C. Berkeley, description, http://bmrc.berkeley.edu/courseware/cscw/fall97/. [17] vic-Video Conferencing Tool, http://www-nrg.ee.lbl.gov/vic/. [18] vat-LBNL Audio Conferencing Tool, http://www-nrg.ee.lbl.gov/vat/. [19] Computer Telephony Service (CTS), ICEBERG research project, http: //iceberg.cs.berkeley.edu/CTS/. [20] Mash Archive System Documentation, http://www.openmash.org/users/tools/usage/ archive-usage.html. [21] W. Mendenhall and T. Sincich, Statistics for Engineering and the Sciences, 4th ed. Englewood Cliffs, NJ: Prentice Hall, 1995.