Abstract. Network intrusion detection systems (NIDS) are becoming an ... Commonly, the performance of a network intrusion detection system is characterized.
Characterizing the Performance of Network Intrusion Detection Sensors Lambert Schaelicke, Thomas Slabach, Branden Moore and Curt Freeland Department of Computer Science and Engineering University of Notre Dame1 Abstract. Network intrusion detection systems (NIDS) are becoming an important tool for protecting critical information and infrastructure. The quality of a NIDS is described by the percentage of true attacks detected combined with the number of false alerts. However, even a high-quality NIDS algorithm is not effective if its processing cost is too high, since the resulting loss of packets increases the probability that an attack is not detected. This study measures and compares two major components of the NIDS processing cost on a number of diverse systems to pinpoint performance bottlenecks and to determine the impact of operating system and architecture differences. Results show that even on moderate-speed networks, many systems are inadequate as NIDS platforms. Performance depends not only on the processor performance, but to a large extent also on the memory system. Recent trends in processor microarchitecture towards deep pipelines have a negative impact on the systems NIDS capabilities, and multiprocessor architectures usually do not lead to significant performance improvements. Overall, these results provide valuable guidelines for NIDS developers and adopters for choosing a suitable platform, and highlight the need to consider processing cost when developing and evaluating NIDS techniques.
1
Introduction
Network intrusion detection is becoming an increasingly important tool to detect and analyze security threats on an organization’s network. It complements other network security techniques, such as firewalls, by providing information about the frequency and nature of attacks. A network intrusion detection system (NIDS) often consists of a sensor that analyzes every network packet on the segment under observation, and forwards packets deemed interesting together with an alert message to a backend system that stores them for further analysis and correlation with other events. The 1
Author’s address: Department of Computer Science and Engineering, University of Notre Dame, 384 Fitzpatrick Hall, Notre Dame, Indiana 46556, USA. Tel. +01 574-631-8320. Fax +01-574-631-9260. E-mail: { lambert, tslabach, bmoore, curt} @cse.nd.edu
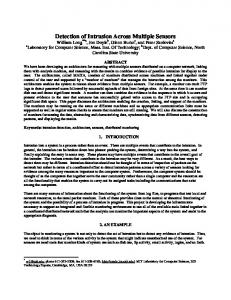
sensor is often implemented as a general-purpose computer system running network intrusion detection software. A separate system may host a database or similar software to provide long-term storage and additional analysis capabilities [2][5]. By relying on off-the-shelf hardware and software, this approach produces a costeffective and flexible network intrusion detection system.
operator sensor analysis network under observation
backend
Fig. 1: Common NIDS Architecture Commonly, the performance of a network intrusion detection system is characterized by the probability that an attack is detected in combination with the number of false alerts. However, equally important is the system’s ability to process traffic at the maximum rate offered by the network with minimal packet loss. Significant packet loss can leave a number of attacks undetected and degrades the overall effectiveness of the system. A high-performance sensor is not only able to process packets at a higher rate, but can also apply more sophisticated detection techniques to reduce the number of false alerts. Unlike other networking components, NIDS hosts cannot rely on flow control mechanisms and acknowledgments to control the incoming data rate. Instead, the NIDS must be able to process packets at the maximum rate offered by the network segment. The work presented here focuses on the performance of the NIDS sensor, especially the hardware platform, since it is one of the most critical component in a network intrusion detection system and its deficiencies can propagate through the entire system. This paper presents a methodology to quantify the network intrusion detection capabilities of general-purpose computer systems. It is based on a set of experiments that test a platform’s capabilities under different traffic characteristics while separating the NIDS processing load into distinct components. Combined, the observed behavior can be used to predict the performance of a NIDS on a network link. The results also provide valuable guidelines for researchers, designers and adopters of network intrusion detection systems. A comparative analysis of a variety of systems running the Snort [18] rule-based NIDS sensor reveals that most general-purpose computer systems are inadequate as NIDS sensor platforms even for moderate-speed networks. The analysis also shows that no single factor alone determines the performance of a system, instead a number of architectural and system parameters such as operating system structure, main memory bandwidth and latency as well as the processor microarchitecture contribute to a system’s suitability as a NIDS sensor platform. Furthermore, recent trends
towards deep processor pipelines to maximize the CPU clock frequency, and towards small-scale multiprocessors do not significantly improve NIDS performance and may even have detrimental effects. Since in the past DRAM performance improvements have not kept pace with advances in processor and network speeds, NIDS sensors are likely to become an increasingly significant bottleneck in the future. The following section describes the design and rationale of the experimental methodology in more detail. Section 3 first describes the measured platforms and then presents and discusses the results. Section 4 contrasts this work with related work in the areas of performance characterization, high-speed network intrusion detection and high-performance networking. Finally, section 5 draws conclusions and outlines future work.
2
Experimental Methodology
2.1 A Network IDS Performance Model A network intrusion detection sensor inspects every packet on the network under observation in an effort to identify suspicious packets that are likely related to intrusion attempts. One common approach is based on user-defined rules that describe or fingerprint potentially harmful or interesting packets to the NIDS software. The intrusion detection algorithm then applies these rules or patterns to every packet and forwards any packet with a positive match, together with an alert message, to the analysis backend [18]. The processing load exerted by this algorithm depends on the characteristics of the rules as well as on the network traffic. Rules generally fall into one of two categories, depending on whether they apply to the packet header or the payload. Header rules inspect the packet header in an attempt to detect specific combinations of features, such as the source and destination address, port numbers, checksums or sequence numbers. Payload rules attempt to match a specific byte sequence in a packet’s payload. NIDS rules may also combine header and payload specific match conditions. Since header size is generally fixed, the processing cost of applying header rules is nearly constant for each packet regardless of actual packet size, while the cost of payload rules scales with the packet size. Real network traffic, on the other hand, is comprised of packets of different sizes. Small packets involve a larger relative overhead, as they carry less payload per header than larger packets. While applications wishing to maximize effective bandwidth generally utilize large packets, an effective NIDS must be able to handle packets of any size. The two different classes of NIDS rules lead to two separate trends in the sustained performance of an NIDS platform. The analysis of traffic consisting of small packets is dominated by the constant cost of header rules, while for larger packets the cost of payload analysis begins to dominate. On a network segment of a fixed capacity, the number of packets transferred per second is inversely proportional to the packet size. For this reason header rules exhibit the highest processing load for small packets. On the other hand, the relative header overhead decreases with larger packet sizes, and thus the cost of payload rules scales with packet size.
In addition to the NIDS processing cost, regardless of the type of rule applied, each packet incurs processing cost due to interrupt and system call handling and related protocol processing, as well as the memory copy involved when reading packets into user space. Similar to the two classes of NIDS rules, interrupt and protocol cost is largely constant across packets, while the memory copy cost scales with the packet size. It should be noted however, that packets on most NIDS platforms do not traverse the complete network protocol stack. Since the NIDS software inspects packet headers as well as the payload, packets are usually read from the raw network device before they would normally enter the TCP/IP protocol stack. Internally however, the NIDS software may replicate some of the protocol stack functionality, as it inspects both the IP header and the encapsulated higher-level protocol header. 2.2 Measurements To comprehensively describe the performance envelope of a network IDS platform, measurements are performed for four different packet payload sizes: 64 bytes, 512 bytes, 1000 bytes, and 1452 bytes, thus covering the range from minimum to maximum size packets on Ethernet networks. Separate experiments are performed for header rules and payload rules. This separation allows one to attribute observed bottlenecks to the particular type of rules. Network traffic is generated between a pair of hosts by the public-domain TTCP utility. TTCP transmits a specified amount of data between a server and client over a TCP connection. The traffic generation hosts are connected by a 100 Mbit per second full-duplex Ethernet segment with a half-duplex tap to send a copy of every data packet of the TTCP conversation to a sensor platform running the Snort network intrusion detection software. The sending hosts are able to nearly saturate the 100 Mbit per second network link with an effective bandwidth of over 92 Mbit per second. To precisely determine the processing cost of NIDS rules, the number of NIDS rules is increased until the number of packets reported by the intrusion detection software is less than the actual number of packets sent, thus indicating that packets are being dropped by the NIDS platform. Each header rule is unique to eliminate the possibility of any optimization of the pattern matching engine, but all rules are of identical overall structure and incur identical cost. The payload rules used here scan the entire packet payload for a matching string. All rules are designed such that no rule matches the observed packet stream and that no alerts are generated, since in most NIDS deployments attacks are the exception rather than the norm. This design ensures that all rules are applied to every packet. If a rule triggers an alert, an intrusion detection system may skip the remaining rules, but generating and forwarding the alert incurs additional cost that is in many cases comparable to or exceed the cost of the remaining rules. Experiments are run for 15 seconds on otherwise idle systems and are repeated multiple times to minimize the impact of measurement error. The total number of rules that a platform is able to support is a measure of the platform’s NIDS capabilities. The approach of varying the number of rules instead of the network traffic rate was chosen because it more closely corresponds to the usage of intrusion detection
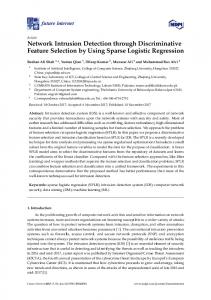
systems in the field, where administrators have little control over the packet rate and bandwidth on a network, but can adjust the number of rules. Overall, these experiments are modeled after realistic NIDS setups and thus provide meaningful insights and recommendations for users of intrusion detection systems. While these experiments use one specific network intrusion detection system, the approach of decomposing NIDS cost into constant and payload-dependent components makes most conclusions also applicable to other NIDS software that relies on pattern matching techniques. Nearly any system receiving network traffic incurs a constant per-packet cost from interrupt handling and protocol processing, whether it is done inside the kernel or by the NIDS software. In addition, in most cases inspection of the packet payload incurs cost that scales with the packet size. Advances in pattern matching algorithms and other optimization techniques can reduce the cost of signature-based intrusion detection and may also change the relationship between the number of rules and the per-packet and per-byte cost. On the other hand, in the experiments presented here over 45 percent of the CPU time was spent inside the operating system handling interrupts and system calls. This portion of the NIDS processing cost is independent of the particular NIDS algorithm employed by the system. Consequently, conclusions drawn from these experiment concerning a system’s sutability as an NIDS platform are applicable to other NIDS systems and provide meaningful insights for designers and users of network intrusion detection systems. Figure 2 shows a plot of the percentage of dropped packets as a function of the number of payload rules for a 1.2 Ghz Pentium-3 system running Snort 1.9.1. As of this writing, Snort is distributed with a set of over 1000 rules of different classes [22].
Percent Packet Loss
75%
50%
25%
0% 0
100
200
300
400
500
600
700
800
# Header Rules
Fig. 2: Dropped Packets versus Number of Header Rules (Pentium-3 / 1200 Mhz, 512 byte packets)
This example demonstrates that for small numbers of rules, nearly no packets are lost, but when the number of rules exceeds the maximum processing capability of the system the number of dropped packets increases drastically. The magnitude of the increase in lost packets underlines the need to understand performance limitations of general-purpose systems when used as NIDS platforms. The results shown in the following section are based on the maximum number of rules supported by a platform with a packet loss of less than 2.5 percent.
2.3 Experimental Systems The set of experiments described above is performed on six IA-32-based systems of diverse processing capabilities and configurations. Table 1 summarizes the relevant configuration parameters. Table 1: Test System Configuration PP-180
P3-600
P3-800
Processor
PentiumPro/MMX 180 Mhz
Pentium III 600 Mhz
Pentium III 800 Mhz single or dual processor
L-1 Cache
8 kByte
16 kByte
16 kByte
L-2 Cache
256 kByte
256 kByte
256 kByte
System Bus 60 Mhz
100 Mhz
133 Mhz
Memory
64 MB DRAM
128 MByte SDRAM
1024 MByte SDRAM
Chipset
Intel 440 FX PCIset
Intel 810E
Serverworks ServerSet III LE
PCI Bus
32-bit, 33 Mhz
32-bit, 33 Mhz
64-bit, 66 Mhz
NIC
3Com 3c905
3Com 3c905
Compaq NC 3123
OS
FreeBSD 4.5
FreeBSD 4.5
Debian Linux 3.0 2.4.19 Kernel
P3-1200
P4-1800
P4-2400
Processor
Celeron 1.2 Ghz
Pentium 4 1.8 Ghz
Dual Pentium 4 Xeon 2.4 Ghz with Hyperthreading
L-1 Cache
16 kByte
12/8 kByte
12/8 kByte
L-2 Cache
256 kByte
256 kByte
512 kByte
System Bus 100 Mhz
400 Mhz
400 Mhz
Memory
128 MByte SDRAM
128 MByte SDRAM
1024 MByte DDR SDRAM
Chipset
Serverworks ServerSet III LE
Intel 845
Serverworks ServerSet GC-HE
PCI Bus
64-bit, 66 Mhz
32-bit, 33 Mhz
64-bit, 66 Mhz
NIC
Compaq NC 7760
3Com 3c905
Compaq NC3163
OS
FreeBSD 4.5 or Debian Linux 3.0 2.4.19 Kernel
FreeBSD 4.5
Debian Linux 3.0 2.4.19 Kernel
These platforms cover a wide range of system architectures and capabilities and can thus provide insight into the contribution of various system characteristics towards the observed NIDS performance. While a number of parameters vary considerably between test platforms, the NIDS software and instruction set remain fixed to allow a meaningful comparison. All systems run Snort 1.9 with libpcap 0.7.1. The results presented in the following sections compare different subsets of these systems to provide insight into the contribution of system architecture and configurations on the NIDS capabilities of a platform.
3
Results
3.1 Overall Comparison Table 2 summarizes the maximum number of header rules supported by each of the platforms tested. Increasing the number of rules beyond these values leads to significant packet loss which negatively impacts an intrusion detection system’s ability to detect attacks. Table 2: Maximum Number of Header Rules Supported by each System Packet Payload Size (bytes) System
64
512
1000
1452
PPro / 180
0
0
43
109
P-3 / 600
0
209
321
362
P-3 / 800
0
378
590
693
P-3 / 1200
101
560
667
722
P-4 / 1800
0
251
291
328
P-4 / 2400
189
472
507
543
Overall, the results lead to two significant conclusions. First, most of the generalpurpose systems tested appear inadequate to serve as a NIDS platform, especially when considering that the Snort 1.9.1 distribution includes over 1000 rules of various classes. Only two systems are able to process network traffic consisting of minimumsize packets on a saturated 100 Mbit per second network. While this scenario is unlikely under normal network conditions, occasional bursts of short packets can still overwhelm the intrusion detection system. Potential intruders can exploit such weakness by hiding attacks in a large number of short packets. Since these experiments keep the network bandwidth constant, small packets result in a significantly higher packet rate and thus fewer rules can be applied on the same platform.
Second, a platform’s NIDS capabilities are not directly related to the microprocessor alone, but are also affected by other system parameters. Hence, further evaluation and comparison is performed in the later sections to uncover the sources of performance bottlenecks and deficiencies. Table 3 summarizes the maximum number of payload rules supported by the same set of test platforms. The total number of payload rules is notably smaller than the maximum number of header rules that the same platform can support. Unlike header rules, payload rules search the entire data portion of a packet for a matching pattern. This sequential scan is significantly more expensive than a test of the fixedsize packet header. In addition, header rules check for a match at exactly one known location in the packet header, while payload rules may be required to search for a sequence of bytes anywhere in the packet body. Table 3: Maximum Number of Payload Rules Supported by each System Packet Payload Size (bytes) System
64
512
1000
1452
PPro / 180
0
0
3
5
P-3 / 600
0
21
33
37
P-3 / 800
0
38
50
57
P-3 / 1200
27
71
88
95
P-4 / 1800
0
64
87
97
P-4 / 2400
94
140
191
217
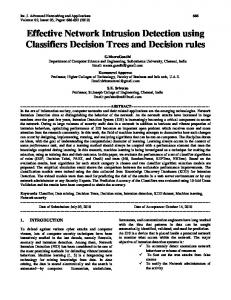
However, generally the same conclusions hold for these experiments. Generalpurpose systems are in many cases not able to perform any significant processing of packets on a fully-saturated network link. Furthermore, CPU performance alone is not a sufficient indicator of a systems NIDS capabilities. To gain a better understanding of various bottlenecks in these platforms, the later sections compare different subsets of systems. 3.2 Normalized Performance In the experiments described above, the total network bandwidth is constant across the different packet sizes. Consequently, tests with small packets produce a higher packet rate than tests with larger packets. On the other hand, header rules are expected to incur a constant cost regardless of the packet size, and even payload rules should incur interrupt costs that are independent of the total packet size. To investigate the processing costs independently of the packet rate, the graphs in Figure 3 show the product of rules and packets per second for constant-cost header processing, and the product of the number of rules and the data rate for payload processing.
Header Rule Cost
Rules * Packets/s (million)
12.5
10.0
7.5
P4/2400-dual
5.0
P3/1200 P3/800-single
2.5
P4/1800 P3/600 0.0 64
512
PPro/180 1000
1452
Packet Size (bytes)
Payload Rule Cost
2500
Rules * Mbyte/s
2000
1500 P4/2400-dual
1000
P3/1200 P3/800-single
500
P4/1800 P3/600 0 1452
1000
PPro/180 512
64
Packet Size (bytes)
Fig. 3: Normalized Rule Processing Cost The first graph plots the product of the number of header rules and the packet rate over the four different packet sizes for all systems tested. Given that header rules exert a constant processing load, the product of the packet rate and rule count is
expected to be approximately constant. The graph shows however that for most systems 512-byte packets are the least expensive to process. For smaller packets, performance often drops sharply due to the excessive interrupt rates. In these tests, the fully-saturated 100 Mbit per second Ethernet link transfers approximately 64000 64byte packets per second. Given an interrupt cost of several tens of microseconds, CPU utilization from interrupt handling alone can approach a significant percentage of total CPU time. Furthermore, interrupt handling interferes with application processing by evicting cache and translation lookaside buffer (TLB) entries, and more frequent interrupts increase the pressure on the caches and TLBs. Larger packets are also slightly more expensive, due to the packet copy operation in the read() system call. Even though header rules do not inspect the packet payload, the entire packet is copied from kernel into user space. For larger packets, this operation becomes more expensive. The second graph shows the product of payload rules and data rate over packet size for all systems. Notice that the order of packet size is reversed from the previous graph to improve clarity. Since the processing cost of payload rules is proportional to the payload size, the product of data rate and number of rules is expected to be constant. However, results show that smaller packets are more expensive than large packets. This effect can again be attributed to the interrupt and system call handling cost which is nearly constant for all packet sizes. As discussed earlier, small packets arriving at a high rate incur significant interrupt costs, leaving less CPU time for actual payload processing. 3.3 Operating System Sensitivity To gauge the impact of operating system differences on the NIDS performance, Figure 4 compares the header and payload rule processing capabilities of the same 1.2 Ghz Pentium-3 system under two different operating systems: Debian Linux 3.0 based on the 2.4.19 Kernel, and FreeBSD 4.5, both compiled with the default configuration and without any NIDS-specific optimizations. For both classes of rules, processing capabilities are normalized by multiplying the number of rules with the packet rate and data rate respectively, as shown in the previous section. The Linux and FreeBSD operating systems were chosen because both are widely used as NIDS platforms since they are freely available, well understood and are proven stable platforms for network-intensive applications. In both cases, the Linux platform outperforms the FreeBSD system. The difference is most significant for the constant-cost header rules, were the Linux platform is able to support between 5 and 38 percent more rules. For payload rules, the difference ranges only from 3.4 to 14 percent. These results indicate that the Linux kernel handles interrupts more efficiently than FreeBSD. Each header rule incurs a relatively small constant cost, and faster interrupt processing directly benefits this type of processing. Payload rules, on the other hand, scan the entire packet and depend largely on architectural characteristics rather than the operating system.
Header Rule Cost
Rules * Packets/s (million)
15.0
10.0
5.0 P3/1200/Linux P3/1200/BSD 0.0 0
250
500
750
1000
1250
1500
Packet Size (bytes)
Payload Rule Cost 1250
1000
750
500
P 3 /1 2 0 0 /L i nux
250
P 3 /1 2 0 0 /B S D 0 0
250
500
750
1000
1250
1500
P acket S i z e ( b yt es )
Fig. 4: Pentium-3 / 1200 OS Dependencies
3.4 Multiprocessor Issues Over the past few years, cost-effective small-scale multiprocessors have become available from many sources. The potential to divide interrupt handling and NIDS processing cost between multiple processors makes these system an attractive platform for network intrusion detection. Figure 5 compares the normalized processing capabilities of the same system with one and two processors. The 800 Mhz platform was selected because it supports a choice of one or two processors. Furthermore, its NIDS capabilities are close to that of the best-performing system, hence the conclusions apply to other current high-end systems. For header processing, the dual-CPU system performs significantly better than a single-CPU system on minimum-size packets. Even though the Linux process scheduler does not support the assignment of a process to a particular CPU, it appears that the interrupt handling is effectively off-loaded to the second processor. In fact, the dual-processor system is able to apply 51 header rules to this traffic whereas the
single-CPU system is completely saturated and does not support any rules at all. For 512-byte packets, the dual-processor system outperforms the single-CPU host by approximately 16 percent. Header Rule Cost
Rules * Packets/s (million)
10.0
7.5
5.0
P3/800/dual
2.5
P3/800/single
0.0 0
250
500
750
1000
1250
1500
Packet Size (bytes)
Payload Rule Cost
Rules * Mbyte/s
750
500
0
250
P3/800/dual P3/800/single
0 0
250
500
750
1000
1250
1500
Packet Size (bytes)
Fig. 5: Pentium-3 / 8 Multiprocessor Dependencies For large packets, on the other hand, the additional processor offers a smaller performance improvement of 7.6 percent. For this type of traffic, packets arrive at a slow enough rate that interrupt handling is not a significant source of processing load. However, if interrupts are handled by one CPU and the NIDS software executes on the other, the sharing of packet buffers leads to cache-coherency traffic between the CPUs, slowing down memory requests. In addition, synchronization inside the kernel between the interrupt and system call handler imposes limits on the speedup. For payload processing, a similar trend can be observed, with the benefit of a second CPU ranging from 5 to 15 percent. Again, for small packets the interrupt rate is sufficiently high that offloading it to the second processor improves performance, but for larger packets the coherency traffic counteracts this effect.
Overall, the performance advantage of a dual-CPU system is smaller than expected. The benefit of dividing the interrupt handling and rule processing between two processors is limited due to OS-internal synchronization and cache coherency overhead. 3.5 Sensitivity to Architectural Parameters This section presents comparative results for the Pentium-3/600, Pentium-3/1200, Pentium-4/1800 and dual-Pentium-4/2400 systems. By eliminating operating system dependencies, this comparison provides insight into the contribution of various architectural parameters on overall NIDS performance. In addition to the configuration parameters available from public documentation, several system parameters are measured using LMbench [24]. Table 4 summarizes processor clock speed, memory hierarchy performance, system call latencies and peak I/O bus performance, and also lists the observed NIDS sensor performance of each platform. In addition, the three rightmost columns show the relative improvement of each parameter compared to the baseline Pentium-3/600 system. Table 4: Architectural Parameters and Observed Performance Absolute values P3/600 P3/1.2 Processor clock (Mhz)
P4/1.8
Improvement over P3/600 P4/2.4
P3/1.2
P4/1.8
P4/2.4
600
1200
1800
2400
2.0
3.0
4.0
L1 cache latency (ns)
5
2
1.18
0.83
2.50
4.24
6.02
L2 cache latency (ns)
11
6
10.9
7.65
1.83
1.01
1.44
150
104
180
165
1.44
0.83
0.91
L1 cache copy BW (MB/s)
5000
10490
5142
7100
2.10
1.03
1.42
L2 cache copy BW (MB/s)
1192
3550
1050
1150
2.98
0.88
0.96
DRAM copy BW (MB/s)
150
189
240
560
1.26
1.60
3.73
System call latency (ns)
719
268
953
747
2.68
0.75
0.96
I/O bus BW (MB/s)
132
528
132
528
4.00
1.00
4.00
Header rules (512 byte)
209
560
251
472
2.68
1.20
2.26
Header rules (1452 byte)
362
722
328
543
1.99
0.91
1.50
Payload rules (512 byte)
21
71
64
140
3.38
3.05
6.67
Payload rules (1452 byte)
37
95
97
217
2.57
2.62
5.86
DRAM latency (ns)
Memory latency is measured by LMbench through a sequence of dependent load instructions, reported results are thus true load-to-use latencies observed by programs. Bandwidth is measured using the system’s native ‘memcpy’ routine. It is reported here because part of the NIDS cost stems from a memory copy operation between kernel and user space. System call latency is measured via the ‘getpid’ system call. In the measured systems, the code path involved in system calls and external interrupts is identical except for the actual handler function, and microprocessors use the same mechanisms to handle interrupts and software traps, hence system call latencies are a good indication of a system’s interrupt performance as well. Generally, reading a network packet from the raw device involves one system call and at least one network interrupt. Unfortunately, LMbench does not measure I/O bus performance. To give an indication of the systems PCI bus capabilities, peak performance is reported here. For both header and payload processing, the Pentium-3/1.2 Ghz system shows a speedup over the baseline 600 Mhz Pentium-3 platform that exceeds the CPU clock frequency improvement alone. This effect can be attributed to advances in the memory and I/O subsystem. Cache latency and copy bandwidth as well as I/O bus bandwidth show disproportional improvements. The system call latency measurement indicates that the faster memory system leads to significantly faster system call and interrupt handling. The 1.8 Ghz Pentium-4 system shows only moderate improvements over the baseline system, despite the fact that it runs at a three times higher processor clock rate and is based on a more modern microarchitecture. Only the level-1 cache and main memory bandwidth and the level-1 cache latency are improved, while other memory systems aspects exhibit lower performance than the baseline system. Most interestingly, system call latencies are 33 percent higher than on the baseline system. The Pentium-4 system features a very deep pipeline to achieve high clock rates [10]. While this microarchitecture benefits compute-intensive codes with regular structures, interrupt handling and other operating system codes perform poorly on such systems due to expensive pipeline flushes on branch mispredictions and other serialization conditions. These disadvantages lead to poor performance on header processing for this Pentium-4 system. Only for payload processing can the high clock frequency and slightly higher memory bandwidth compensate for the effects of the deep pipeline. The 2.4 Ghz Pentium-4 Xeon system shows similarly small improvements for header processing, but outperforms all other systems for payload processing. While the irregular and branch-intensive header processing is penalized by the deep processor pipeline, the significantly improved memory subsystem results in high payload processing performance. The network adapter transfers incoming packets into main memory via DMA, invalidating previously cached copies of the receive buffers in the CPU cache. Subsequently, most references to the packet contents incur cache misses and are satisfied from main memory. Consequently, the high-bandwidth main memory system in combination with the processors high clock frequency lead to these significant payload processing improvements. As shown previously, the dualprocessor architecture has a relatively small impact on NIDS performance. The 2.4 Ghz Pentium-4 Xeon processor in the dual-CPU system implements hyperthreading, a form of simultaneous multithreading [13]. This architectural technique implements two logical processors on one chip to improve system
throughout at a small cost increase. To the operating system, the logical processors appear as independent CPUs that can execute different processes and handle interrupts. However, since the logical processors share most execution resources including the caches and the system interface, the performance improvement from the second logical processor is significantly smaller than that of a traditional multiprocessor. Consequently, the contribution of hyperthreading to the NIDS capabilities of the 2.4 Ghz Pentium-4 Xeon system is relatively minor. Unfortunately, the impact of the I/O bus on overall NIDS performance is not clear from these experiments. While the two fastest systems tested both feature a 66 Mhz 64-bit PCI bus, even a slower 33 Mhz 32-bit bus can easily sustain the moderate data rate of the testbed network. A fully saturated 100 Mbit per second Ethernet link transfers at most 12.5 Mbytes per second, including packet headers. Most standard I/O buses do not pose a bottleneck for this transfer rate. However, in addition to writing network packets into main memory, the I/O bus is also used by the processor to access control registers during interrupt handling. The faster clock rate on the highend I/O bus leads to a slightly improved control-register read latency that benefits interrupt costs somewhat.
4
Related Work
The work presented in this paper is one of the first efforts to systematically study the performance requirements of network IDS sensors across a variety of platforms, and to attribute bottlenecks to specific system features. Previous work on evaluating intrusion detection systems has often focused on testing the quality of an IDS. The most prominent effort to this end is the DARPA IDS evaluation carried out at MIT Lincoln Labs [9]. Reports on the design of the test traffic and the rational behind it provide a valuable resource for others attempting a similar effort. However, as the evaluation is geared towards comparing a wide variety of systems, it is unable to provide insights into the sources of performance bottlenecks. Industrial whitepapers can add valuable practical experience testing and evaluating intrusion detection systems, but are by their nature much more limited in scope [6][17]. Puketza et al. describe an integrated approach to NIDS evaluation that combines quality and performance metrics [16]. It is designed to compare different intrusion detection systems in terms of the number of alerts generated under a variety of loads, including overload situations intended to subvert the NIDS. As such, the approach takes the capabilities of the NIDS platform into account and can be used to compare a variety of platforms running the same NIDS software. This work, in contrast, is mainly concerned with the throughput of a network IDS sensor platform and is designed to give insights into the sources of inadequacies. In addition, the experimental setup used here is intentionally kept simple to make the methodology widely applicable. Several proposed network IDS approaches have been tested and evaluated with respect to their performance [12][14][20]. However, the experiments are usually restricted to test the peak performance of a system, without addressing sources of bottlenecks, their relationship to architectural parameters or their scalability across different platforms.
Previous work in high-performance networking has characterized the bottlenecks of various systems and proposed solutions either in the form of hardware support or protocol stack optimizations [1][3][8][23]. Conclusions largely agree with results presented here, emphasizing the cost of interrupt handling and data copying. However, since NIDS systems are not actively participating in network communications, many proposed optimizations such as larger frame sizes are not applicable to NIDS platforms. Furthermore, to remain general, previous studies usually do not consider the applications impact on overall performance, whereas this work studies the combined performance requirements of the device driver, operating system and network intrusion detection software.
5
Conclusions and Future Work
This paper presents a simple methodology to measure and characterize the performance of general-purpose systems when used as network intrusion detection sensors. The methodology constructs a performance profile by measuring the cost of the two main classes of NIDS processing for different packet sizes. By varying the number of rules applied to each packet, the peak performance of a given configuration can be established without the need to control the packet rate or bandwidth of the test traffic. The performance profile obtained in this way can be used to predict the performance of a computer system as network IDS sensor. A comparative study of six distinct systems shows that general-purpose computers are generally inadequate to act as sensors even on moderate-speed networks. On a nearly saturated 100 Mbit per second network link, even the bestperforming system can only support a maximum of 720 header rules without losing packets. For larger numbers of rules, a significant percentage of packets are dropped, thus degrading the NIDS effectiveness in detecting security breaches. For minimumsize packets, only two of the six systems are able to perform any significant processing. As a point of comparison, the default rule file supplied with the Snort 1.9 distribution contains over 1000 rules. These results highlight the need to understand the processing capabilities of network intrusion detection platforms and to consider the processing cost of NIDS algorithms in addition to their quality. In addition, results indicate that no single architectural parameter alone determines network IDS capabilities, instead a combination of factors contributes to the sustained performance. In particular, processor speed is not a suitable predictor of NIDS performance, as demonstrated by a nominally slower Pentium-3 system outperforming a Pentium-4 system with higher clock frequency. Memory bandwidth and latency is the most significant contributor to the sustainable throughput [19]. Furthermore, a comparison between two popular operating systems reveals that the more efficient interrupt handling by the Linux kernel leads to non-negligible performance improvements. Multiprocessor architectures, on the other hand, offer a relatively small advantage for network intrusion detection. While an additional processor is able to offload the interrupt processing, the kernel synchronization and cache coherency traffic resulting from shared buffers limits the benefit. Current trends in processor, memory and network performance improvements show that main memory is becoming an increasingly important bottleneck for overall system
performance. Since network intrusion detection systems are largely memory-bound, NIDS sensor performance will likely remain critical in the future. Given these results, optimization of rule-based intrusion detection systems remains an important concern. Advances in pattern matching algorithms [4], decisiontree based clustering of rules [11] and compilation of rules into optimized detection engines [7] reduce the number of comparisons needed as well as the cost of individual comparisons, but may in the process increase the memory footprint of the signature matching engine. Given that NIDS performance is shown to be memory-bound, improving the cache behavior of pattern matching techniques is a promising approach. Minimizing the memory requirements, for instance through blocking or tiling of internal data structures may let processors keep a larger portion of frequently accessed data in the cache, thus improving overall performance. Other promising approaches to improve NIDS throughput include the distribution of network traffic over a number of sensors using a loadbalancer, pipelining the processing of packets through a series of NIDS processes and the distribution of different rules over multiple sensors. However, given the large percentage of CPU time spent inside the operating system kernel, optimizations of the NIDS software alone have limited benefit. Instead, effective optimizations should include the interface between the intrusion detection software the the operating system. As the work presented here focuses on rule-based NIDS sensors using signature matching, future work involves extending the methodology to other network IDS approaches such as protocol-based filtering and analysis [15]. In addition, on highspeed networks, even highly effective sensors may produce alerts at a rate greater than the analysis backend can absorb. Consequently, it is important that the performance of the analysis components of network intrusion detection systems be accurately quantified as well. The authors wish to thank Frank Irving and Matthew Liszewski for their contributions to carrying out the numerous experiments, and Aaron Striegel and the anonymous reviewers for the encouraging and helpful comments. This work was in part supported by a Faculty Research Grant from the University of Notre Dame Graduate School. This material is based upon work supporte d by the National Science Foundation under Grant No. 0231535. Any opinions, findings, and conclusions or recommendations expressed in this material are those of the authors and do not necessarily reflect the views of the National Science Foundation.
6
References
[1]
D. Banks and M. Prudence, “A High-performance Network Architecture for a PA-RISC Workstation,” IEEE Journal on Selected Areas in Communications, vol. 11, no. 2, Feb. 1993, pp. 191-202.
[2]
S. Cheung, R. Crawford, M. Dilger, J. Frank, J. Hoagland , K. Levitt, S. Staniford -Chen, R. Yip, and D. Zerkle, “The Design of GrIDS: A Graph-Based Intrusion Detection System,” tech. report CSE-99-02, Computer Science Dept., Univ. of California Davis, Calif., 1999.
[3]
D. Clark, V. Jacobson, J, Romkey, and M. Salwen, “An Analysis of TCP Processing Overhead”, IEEE Communications Magazine, vol. 27, June 1989, pp. 23-29.
[4]
J. Coit, S. Staniford, J. McAlerney, “Towards Faster String Matching for Intrusion Detection or Exceeding the Speed of Snort,” Proc. DARPA Information Survivability Conference and Exposition (DISCEX II ’02), IEEE CS Press, Los Alamitos, Calif., 2001, pp. 367-373.
[5]
R. Danyliw, “ACID: Analysis Console for Intrusion Databases,” http://acidlab.sourceforge.net, 2001.
[6]
S. Edwards, “Vulnerabilities of Network Intrusion Detection Systems: Realizing and Overcoming the Risks. The Case for Flow Mirroring,” whitepaper, Top Layer Networks, Inc., 2002.
[7]
S. Egorov, G. Savchuk, "SNORTRAN: An Optimizing Compiler for Snort Rules," whitepaper, Fidelis Security Systems, Inc.
[8]
A. Gallatin, J. Chase, and K. Yocum, “Trapeze/IP: TCP/IP at Near-Gigabit Speeds,” Proc. 1999 Usenix Technical Conference, Usenix Assoc., Berkeley, Calif., 1999, pp. 109-120.
[9]
J. Haines, R. Lippmann, D. Fried, J. Korba, and K. Das, "1999 DARPA Intrusion Detection System Evaluation: Design and Procedures," tech. report 1062, MIT Lincoln Laboratory Technical Report, Boston, Mass., 2001.
[10] G. Hinton et al, “The Microarchitecture of the Pentium 4 Processor,” Intel Technology Journal, Q1 2001. [11] C. Kruegel and T. Toth, "Automatic Rule Clustering for improved, signature-based Intrusion Detection,” tech. report, Distributed Systems Group, Technical Univ. Vienna, Austria. [12] C. Kruegel, F. Valeur, G. Vigna and R. Kemmerer, “Stateful Intrusion Detection for High-Speed Networks,” Proc. IEEE Symposium Security and Privacy, IEEE Computer Society Press, Calif., 2002. [13] D. Marr et al., “Hyper-Threading Technology Architecture and Microarchitecture”, Intel Technology Journal, vol. 6, no. 1, February 2002, pp. 4-15. [14] V. Paxson, “Bro: A System for Detecting Network Intruders in Real-Time,” Computer Networks, vol. 31, no. 23-24, 1999, pp. 2435-2463. [15] “Protocol Analysis vs. Pattern Matching,” whitepaper, Network ICE, 2000. [16] N. Puketza, K. Zhang, M. Chung, B. Mukherjee, R. Olsson, “A Methodology for Testing Intrusion Detection Systems,” IEEE Transactions Software Engineering, vol. 22, no. 10, 1996, pp. 719-729. [17] M. Ranum, “Experiences Benchmarking Intrusion Detection Systems,” whitepaper, Network Flight Recorder Security, Inc. , http://www.snort.org/docs/Benchmarking-IDS-NFR.pdf [18] M. Roesch, “Snort – Lightweight Intrusion Detection for Networks,” Proc. Usenix LISA ‘99 Conf., November 1999. http://www.snort.org/docs/lisapaper.txt [19] M. Rosenblum, E. Bugnion, S. Herrod, E. Witchel, and A. Gupta, “The Impact of Architectural Trends on Operating System Performance,” Proc. 15th ACM Symp. Operating System Principles, ACM Press, New York, N.Y, 1995. [20] R. Sekar, Y. Guang, S. Verma, T. Shanbhag, “A High-Performance Network Intrusion Detection System,” Proc. 6th ACM Symp. Computer and Communication Security, ACM Press, New York, N.Y., 1999. [21] “Snort 2.0 - Detection Revisited,” whitepaper, Sourcefire Network Security Inc, 2002.
[22] Snort Rules for Version 1.9.x as of March 25, 2003. http://www.snort.org/dl/rules/snortrules-stable.tar.gz [23] P. Steenkiste, “A Systematic Approach to Host Interface Design for High-Speed Networks”, IEEE Computer, vol. 27, no. 3, March 1994, pp. 47-57. [24] L. McVoy, C. Staelin, “lmbench: Portable Tools for Performance Analysis,” Proc. USENIX Ann. Technical Conference, Usenix Assoc., Berkeley, Calif., 1998, pp. 279294.