Characterizing User Behavior and Network Performance in a Public Wireless LAN Anand Balachandran
Geoffrey M. Voelker
Paramvir Bahl
P. Venkat Rangan
U. C., San Diego 9500 Gilman Dr. 0114 La Jolla, CA 92093
[email protected]
U. C., San Diego 9500 Gilman Dr. 0114 La Jolla, CA 92093
[email protected]
Microsoft Research One Microsoft Way Redmond, WA 98052
[email protected]
U. C., San Diego 9500 Gilman Dr. 0114 La Jolla, CA 92093
[email protected]
ABSTRACT This paper presents and analyzes user behavior and network performance in a public-area wireless network using a workload captured at a well-attended ACM conference. The goals of our study are: (1) to extend our understanding of wireless user behavior and wireless network performance; (2) to characterize wireless users in terms of a parameterized model for use with analytic and simulation studies involving wireless LAN traffic; and (3) to apply our workload analysis results to issues in wireless network deployment, such as capacity planning, and potential network optimizations, such as algorithms for load balancing across multiple access points (APs) in a wireless network.
1. INTRODUCTION Advances in communication technology and the proliferation of lightweight, hand-held devices with built-in, high-speed radio access are making wireless access to the Internet the common case rather than an exception. Wireless LAN installations based on IEEE 802.11 [8] technology are emerging as an attractive solution for providing network connectivity in corporations and universities, and in public places like conference venues, airports, shopping malls, etc. – places where individuals spend a considerable amount of their time outside of home and work. In addition to the convenience of untethered networking, contemporary wireless LANs provide relatively high data connectivity at 11 Mb/s and are easy to deploy in public settings. As part of a larger research project, we have been exploring issues in implementing and deploying public-area wireless networks, and exploring optimizations for improving their performance [1]. In order to evaluate and validate the techniques that we are developing, we consider it essential to use realistic workloads of user behavior and wireless network performance to make design decisions and tradeoffs. However, since public wireless LANs have only recently become widely deployed, such workload characterizations are scarce. Initial studies of wireless networks have explored lowlevel error models and RF signal characteristics [5], installation and maintenance issues of a campus wireless network [3], user mobility in a low-bandwidth metropolitan area network [18], and user
behavior and traffic characteristics in a university department network [19] and, very recently, a college campus [11]. In this paper, we extend previous studies by presenting and analyzing user behavior and network performance in a public-area wireless network using a trace recorded over three days at the ACM SIGCOMM’01 conference held at U.C. San Diego in August 2001. The trace consists of two parts. The first part is a record of performance monitoring data sampled from wireless access points (APs) serving the conference, and the second consists of anonymized packet headers of all wireless traffic. Both parts of the trace span the three days of the conference, capturing the workload of 300,000 flows from 195 users consuming 4.6 GB of bandwidth. The high-level goals of our study are three-fold. First, we want to supplement the existing domain knowledge about wireless user behavior and wireless network performance; research in Web infrastructure, for example, has greatly benefited from the understanding gained from many workload studies from different settings over time. By comparing and contrasting the workload in our setting with previous ones, we can begin to identify and separate wireless workload characteristics that apply to the wireless domain in general from those that are specific to a particular setting or network configuration. Second, we want to specifically characterize user behavior and network performance in a public wireless LAN environment. We characterize user behavior in terms of connection session length, user distribution across APs, mobility, application mix, and bandwidth requirements; we characterize network performance in terms of overall and individual AP load, and packet errors and retransmissions. From these analyses, we characterize wireless users in terms of a parameterized model for use with analytic and simulation studies involving wireless LAN traffic. Third, we want to apply our workload analyses to better understand issues in wireless network deployment, such as capacity planning, and potential network optimizations, such as algorithms for load balancing across multiple APs in a wireless network. For our conference workload trace, our overall analysis of user behavior shows that: • In our setting, users are evenly distributed across all APs and user arrivals are correlated in time and space. We can correlate user arrivals into the network according to a two-state Markov-Modulated Poisson Process (MMPP). The mean interarrival time during the ON state is 38 seconds, and the mean duration of the OFF state is 6 minutes. • Most of the users have short session times: 60% of the user sessions last less than 10 minutes. Users with longer ses-
sion times are idle for most of the session. The session time distribution can be approximated by a General Pareto distribution with a shape parameter of 0.78 and a scale parameter of 30.76. The R2 value is 0.9. Short session times imply that network administrators using DHCP for IP address leasing can configure DHCP to provide short-term leases, after which IP addresses can be reclaimed or renewed. • Sessions can be broadly categorized based on their bandwidth consumption into light, medium, and heavy sessions: light sessions on average generate traffic at 15 Kbps, medium sessions between 15 and 80 Kbps, and heavy sessions above 80 Kbps. The highest instantaneous bandwidth demand is 590 Kbps. The average and peak bandwidth requirements of our users are lower than those in a campus network [19], reflecting a difference in the type of tasks people do in the two settings. • Web traffic accounts for 46% of the total bandwidth of all application traffic, and 57% of all flows. Web and SSH together account for 64% of the total bandwidth and 58% of flows. Our analysis of network performance shows that: • The load distribution across APs is highly uneven and does not directly correlate to the number of users at an AP. Stated another way, the peak offered load at an AP is not reached when the number of associated users is a maximum. Rather, the load at an AP is determined more by individual user workload behavior. One implication of this result is that load balancing solely by the number of associated users may perform poorly. • The wireless channel characteristics are similar across APs; the variation is more time-dependent than location-dependent. The median packet error rate is 2.15%, and the median packet retransmission percentage is 1.63%. The rest of the paper is organized as follows. In Section 2 we provide an overview of related work. Section 3 provides a brief description of the wireless network environment where the trace was collected and describes the trace collection methodology. We then analyze the trace for user behavior in Section 4 and network performance in Section 5. Finally, we conclude in Section 6.
2. RELATED WORK Researchers at Stanford have performed a number of useful studies of wireless network usage. Recently, Tang and Baker [19] analyzed a 12-week trace collected from the wireless network used by the Stanford Computer Science department; this study built on earlier work involving fewer users and a shorter duration [12]. Their study provides a good qualitative description of how mobile users take advantage of a wireless network, although it does not give a 0 characterization of user workloads in the network. Earlier, Tang and Baker [18] also characterized user behavior in a metropolitanarea network, focusing mainly on user mobility. Furthermore, the network was spread over a larger geographical area and had very different performance characteristics. Other studies of wireless networks have focused more on network performance and less on user behavior. For example, researchers at CMU [5] examined their campus-wide WaveLAN installation. The focus of their study was on the error model and signal characteristics of the RF environment in the presence of obstacles. Another
study of the same campus wireless network [3] described the issues involved in installing and maintaining a large-scale wireless LAN and compared its performance to a wired LAN. A joint research effort between CMU and Berkeley [15] proposed a novel method for network measurement and evaluation applicable to wireless networks. The technique, called trace modulation, involves recording known workloads at a mobile host and using it as input to develop a model for network behavior. Although this work helps in developing a good model of network behavior, it does not provide a realistic characterization of user activity in a mobile setting. Simultaneous with this study, Kotz and Essien [11] traced and characterized the Dartmouth College campus-wide wireless network during their Fall 2001 term. Their workload is quite extensive, both in scope (1706 users across 476 access points) and duration (12 weeks). Whereas our study focuses on small-scale characteristics, like modeling individual user bandwidth requirements and traffic load on individual APs, Kotz and Essien focus on large-scale characteristics of the campus, such as overall application mix, overall traffic per building and AP, mobility patterns, etc. In terms of application mix, their network carries a richer set of applications that reflects the nature of campus-wide applications. For example, a much larger fraction of their traffic is addressed to unknown ports, and traffic from a backup application for laptops is a significant element of the workload. As a result, interactive applications like SSH constitute a smaller part of the workload. With the size of their network, they were able to study mobility patterns as well. Interestingly, they found that most users were stationary within a session, and overall associated with just a few APs during the term.
3.
METHODOLOGY
In this section, we first describe the configuration of the wireless network from which we collected our trace data, and then describe our methodology for trace collection and analysis.
3.1
Network Environment
Our wireless LAN was an IEEE 802.11b [8] network installed in a large auditorium where the conference sessions were held. Figure 1 shows the network configuration. The auditorium has dimensions of 110x60x27 ft and was covered by four ORiN OCO T M AP1000 wireless access points, labeled NorthEast (NE), NorthWest (NW), SouthEast (SE), and SouthWest (SW), installed in the ceiling. The APs provided overlapping coverage in the auditorium and the lobby. The western APs were close to the stage. The eastern APs were at the back of the room close to the main entrances, also providing coverage to the lobby. The subnet of APs was connected to a Cisco Catalyst 2924 switch over a 100BaseT link, which connected to the venue’s intranet, then the campus gigabit backbone, and finally to the Internet. The APs were operating at a data rate of 11 Mbps, on channels 1, 4, 7, and 11, and at a power of 100mW. The AP handoff algorithm was configured to use “small” cells. The wireless user community consisted of 195 distinct users (distinct MAC addresses), roughly 40% of the total attendees. User wireless hardware was heterogeneous, as attendees used their own personal wireless cards, and the trace includes traffic from 8 different vendors.
3.2
Trace Collection and Analysis
Table 1 summarizes the high level characteristics of the trace. Our trace consisted of two parts. First, we collected a continuous trace
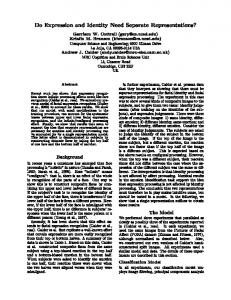
Figure 2: The number of users associated with an access point on the second day (Thursday) of the conference. http://ramp.ucsd.edu/pawn/sigcomm-trace Figure 1: The public wireless network configuration at the venue of the conference. The connection to the Cisco router and the wired backbone have been simplified because they are not central to the discussion in the paper. Attribute Number of wireless users Maximum users at an AP Total hours of trace Total bytes transmitted Total flows Peak throughput at an AP
Values 195 32 52 4.6 GB 298995 3.2 Mbps
Table 1: Overall statistics for the trace.
of SNMP data from each of the four APs over a period of 52 hours from the start of the conference. The SNMP data consisted of aggregate packet level statistics of all traffic through both interfaces of the APs, including information at the link, network, and transport levels. In addition, the trace also contained detailed information about the mobile users associated to each of the APs, including the MAC address, the received signal-to-noise ratio (SNR), and the effective throughput. To collect the SNMP data at the APs, we wrote a program called snmputil that uses the SNMP Management API in Windows. The program essentially walks the entire Management Information Base (MIB) tree exported by the APs and records the data returned from the SNMP queries. We polled the APs using snmputil approximately every minute. For post-processing, we used perl scripts that parse the SNMP output for relevant objects in the MIB tree. The second trace we collected was a tcpdump trace of the networklevel headers of the packets passing through the Cisco Catalyst 2924 switch for the duration of the conference. We anonymized sensitive information like sender and receiver IP addresses to protect user privacy, and discarded all packet payloads. We analyzed the trace using CoralReef [4], a freely available software suite for analyzing monitored network traffic. The snmputil software, our scripts, and both traces are available for download at the following URL:
4.
USER BEHAVIOR
In this section, we analyze the basic characteristics of user behavior in the wireless LAN. For analyses involving APs where the behavior is similar across all APs, for clarity we present the results for just one AP, the NorthEast (NE) AP. The conference was held on two full days, a Wednesday and Thursday, and one half day, a Friday. For our analyses, we only use the data from our traces for the scheduled times of the conference on each day: 8:00–18:00 for the full days, and 8:00–14:00 on the half day.
4.1
User Distribution across Access Points
First we characterize the distributions of users associated with APs as a function of time, and suggest a model for user arrival distributions in conference-like settings. Figure 2 shows a time-series plot of the total number of users in the conference auditorium on a single day. The dotted lines demarcate the conference sessions, lunch break, and coffee breaks. As expected from our setting, the number of associated users steadily climbs to a peak when the conference was in session (9–10:30, 11–12:30, 14–15:30, and 16–17:30), and drops significantly during the 30-minute break sessions (10:30, 12:30, 15:30 and 17:30) and the lunch break (13:00–14:00), which was in a different location. This pattern reflects expected behavior as users were socializing and enjoying refreshments during the breaks and connected during sessions. We observed that the user distribution follows the same pattern at all APs. Figure 3 is a histogram showing the average number of users associated at each AP for the entire trace. For the first half of the day we averaged across the three days, and for the second half of the day we averaged only across the first two days. From the figure, we see that all APs see approximately the same number of users through the day, with the maximum difference among APs being 35% between 9 and 10:00 A.M. We note, though, that this user distribution reflects the topology of our network and the setting, where many users were gathered in a small area during scheduled times. In contrast, the Stanford study [19], for example, looked at a network of larger geographic size where the users are unevenly distributed across the APs in the building. In that network, user distribution only across a certain subset of the APs where most of the users had offices is more even as in our workload. Figure 4 summarizes the user distribution in terms of the mean, median, and 90th percentile for the entire trace.
Figure 5: CDF of user session time. Figure 3: Average number of users associated with each access point over the entire trace.
Figure 6: Histogram of users with session time less than an hour.
Figure 4: Mean, Median, and 90th percentile of the number of users at each AP for the entire trace.
The user arrival patterns also strongly reflect the nature of a conference workload. We can see from Figure 2 that there is a steady increase in user arrivals as sessions start, and a steady decrease in users as sessions concludes. Further, there is a correlation in time between user arrivals into a cell, and a correlation in space between user arrivals to neighboring cells. Such behavior is typical of settings like classrooms, meeting and conference rooms, airport gates, etc., and can be well modeled as a Markov-Modulated Poisson Process (MMPP) [17]. We model the arrival process as governed by an underlying Markov chain, which is in one of two states, ON or OFF. The OFF state is when there are no arrivals into the system, which would typically be midway into the conference session. During the ON state, arrivals vary randomly over time with a more or less constant arrival rate. The mean inter-arrival time during the ON state is 38 seconds. The mean duration of the OFF state is 6 minutes, with longer OFF periods during the session breaks and the lunch break. Our observations indicate that the traditional method of modeling user arrivals according to a Poisson arrival process [14] may not adequately characterize scenarios where arrivals are correlated with time and space [7]. However, although the MMPP model is wellsuited to our conference setting where most users follow a common
schedule, we do not expect it to generalize to every public-area wireless network. For example, it may be appropriate in an airport network where users cluster at gates at specific times in anticipation of departures, but not for a shopping mall network where we would expect user arrivals, departures, and mobility to be more random.
4.2
User Session Duration
We now study user session duration, and discuss its implications on DHCP timeouts. We define a user session to be a contiguous sequence of time values when a certain MAC address associates and disassociates at an AP. Thus we capture user behavior as it varies from one session to another, as a user could have more than one session at one or more APs at different times during the day. Figure 5 plots the cumulative distribution of all session durations, and Figure 6 shows a histogram of the sessions lasting less than one hour for the NE access point; the results are similar for the other APs as well. Figure 5 shows that 90% of the sessions last less than one hour and 10% ranging between one and three hours, thus skewing the distribution. In order to determine a statistical distribution for user session time, we compared and fit the measured session time samples to a known analytical distribution. The PDF of the session time (not shown) closely follows a General Pareto Distribution [9] with a shape parameter of 0.78 and a scale parameter of 30.76. The coefficient of determination, R2 is 0.9. Figure 6 shows the session times as a histogram, indicating that many sessions are extremely short (5 minutes or less).
Session Type Light Medium Heavy
Mean data rate (Kbps) below 15 15-80 above 80
Peak Data Rate (Kbps) below 60 60-175 above 175
Table 2: The average and peak data rates of light, medium and heavy sessions.
medium sessions, and the remaining top 10% as heavy sessions.
Figure 7: CDF showing percentage of time users are inactive in a session.
Table 2 shows the range of average and peak data rates for a typical session for each class. The peak data rate of a heavy session is at most 590 Kbps. As will be seen in the next section, HTTP and SSH are the most commonly seen traffic; they appear in all sessions, light, medium and heavy. Therefore, we are unable to determine a unique application mix that characterizes each class of user.
We also observed that some long user sessions were mainly idle with little or no data transfer. Figure 7 shows this behavior using a CDF characterizing the percentage of time during the session that users are idle. While most of the sessions (88%) witness data transfer (i.e., are not idle) for longer than 70% of the full length of a session, about 4% are inactive for more than half of their session length. With further analysis, we found that these relatively idle sessions were mainly those with the longer session lengths in Figure 5. We attribute this behavior to users whose machines associate with an AP, but remain idle as they pay attention to the conference sessions.
Comparing data rates with the Stanford study highlights differences between our settings. That study found that users occasionally consumed most of the available bandwidth in bursts when, e.g., downloading large files. Our workload does not show similar behavior; the maximum peak data rate (recorded over a one-minute interval) was 590 Kbps, well below the maximum bandwidth of the wireless and wired networks used. This contrast reflects a difference in the type of tasks that people do in the two settings, i.e., web browsing and email versus large downloads in desktop and development settings.
Some long user sessions have disconnections of the order of tens of seconds. We observed that this was due to the fact that the received SNR at the mobile host goes below a certain threshold, either due to the varying channel conditions or due to user’s location, which in turn causes the mobile host to disassociate from the AP. We found that the SNR threshold on most hosts was between 18 and 20 dB1 .
We also note that there is some correlation between data rates and session time. The long sessions in Figure 5 have a low average data rate. In fact, by our classification, all sessions longer than 40 minutes are light sessions. Even among the shorter sessions, we see a predominance (> 60%) of light sessions. These observations are in line with what one would expect for bursty data traffic. In the next section, we analyze the data traffic further to determine popular applications and protocols.
One implication of the short session times of users has to do with IP-address leasing. Organizations hosting public networks traditionally use DHCP to provide IP addresses to subscribers. Knowing that users have short session times, network administrators can configure their DHCP servers to have short lease times on addresses, say, 10 minutes, after which IP addresses can be reclaimed or renewed. In networks that do not use a NAT [16], this scheme provides a way to overcome limited DHCP addresses by recycling addresses quickly.
4.3 User Data Rates Next we study the individual workloads of users’ sessions, and find that data rates are relatively low and correlate with session times. We measured the average data rates using the total bytes transferred to and from the mobile hosts in a one-minute interval, and averaged it over the entire session. The minimum, average, and peak bandwidths of each user session are widely spread; per session average bandwidths range from as low as 15 kbps to as high as 590 kbps. In order to categorize the sessions based on data rates, we chose three intervals in the bandwidth distribution. After sorting the sessions based on average bandwidth, we classify the lower 25th percentile of the sessions as light sessions, the 25th to the 90th percentile as 1
Note that most diagnostic utilities that monitor the state of the wireless network measure the quality of the channel in terms of signal strength, measured in dBm rather than SNR.
4.4
User Application Popularity
In this section, we report our analysis of the packet header trace. Figure 8a shows a histogram of the top protocols responsible for the traffic, and Figure 8b shows a histogram of the most popular applications seen in the trace. By byte count, we see that most traffic is generated by TCP (91%). The remaining 9% of the traffic is accounted for by UDP, ICMP, IGMP, and traffic to ports that are not well-known. We also see some IPv6 traffic, although it accounted for less than 1% of the total bytes transferred. In terms of flow count, the traffic is again dominated by TCP flows (76%) followed by UDP (23%). In Figure 8b, we can see that web browsing (HTTP) is by far the most popular application, contributing 46% of the total bytes transferred, followed by secure shell (SSH) (18%) and the Internet Cache Protocol (9%). About 5% of the traffic is due to unknown applications, which use unassigned port numbers but are based on either TCP or UDP. The only significant real-time application that we see is Real-Audio (2%). Note that we show only those applications whose contribution is 1% and above; the remaining applications that account for the decreasing numbers of bytes transferred are SMTP, PPTP, Netbios-SSN, Kerberos, IGMP, RTSP, AOL chat, NTP, and Multimedia Conference Control. By flow count, HTTP and SSH together contribute 58% of the flows. DNS “flows”, as
Figure 8: The classification of user traffic (a) by IP protocol and (b) by application.
Figure 9: Total number of access points visited by users during each day of the conference. characterized by CoralReef, are high in number (23%) although each flow is very short. The popularity of Web and SSH applications explains the small average and peak user bandwidth requirements since session bandwidths for these protocols are relatively small (e.g., mean Web object sizes are 8 KB [21], and SSH sessions are comprised of interactive user input and output). We also note that users appear to rely upon application-level security through SSH and VPN applications, and that the availability of last-hop security [10] would not be a major concern for them.
4.5 User Mobility
Figure 10: The number of handoffs seen at an AP within a given time window on the second day (Thursday) of the conference.
first two days a vast majority (> 80%) of the users are seen at more than one AP, i.e., they move around during the day. Only about 16% of the users are stationary. There is much less roaming on the last day when the conference ended at 1:00 P.M. The fact that most users are seen at more than one AP indicates that users occupy different seats (and hence associate with different APs) each time they exit and re-enter the auditorium. As would be expected, a majority of the stationary users are those that have longer sessions (see Figure 6).
One of the important conveniences of a wireless LAN is user mobility, and our trace shows that users are mobile when expected, i.e., at the beginning and end of conference sessions. Since wireless coverage was provided in the entire auditorium, users could access the network while sitting anywhere. The primary constraint to mobility is power, which was amply provided along the aisle rows in the conference hall.
In contrast, the Stanford study has very localized mobility among a subset of the installed APs. We believe that this is a key distinguishing feature between campus networks and public-area wireless networks. The former supports a user community that (a) is known and authorized a priori, and (b) accesses the network from habitual locations. Public-area wireless networks, on the other hand, deal with users who do not have assigned locations and who tend to access the network via different APs over time.
We plot user mobility in Figure 9 as a histogram showing the number of users seen at a given number of APs during each day of the conference. We see that the mobility pattern on the first two days of the conference is slightly different from the third day. On the
Having looked at mobility from the users’ standpoint, we now examine it from the standpoint of the APs. In Figure 10, we plot the number of handoffs seen at the NE AP as a function of time of day with two different time windows, 5 minutes and 15 minutes. The
Parameter Number of users per AP User session time Number of APs users seen at (degree of roaming) SNR of user session Bandwidth (light session) Bandwidth (medium session) Bandwidth (heavy session)
Minimum 0 4 min.
Mean 18 22 min.
Median 20 8 min.
90th %ile 28 61 min.
Peak 33 180 min.
1 0 dB 0-5 kbps 5-20 kbps 20-80 kbps
N/A 39.8 dB below 15 kbps 15-80 kbps 80-265 kbps
2 40 dB N/A N/A N/A
N/A 54 dB N/A N/A N/A
4 75 dB Below 60 kbps 60-175 kbps 175-590 kbps
Table 3: Parameterized model summarizing user behavior dotted lines demarcate the conference sessions, lunch break, and coffee breaks. From the perspective of an AP, we define a handoff as either a new connection or a connection handed off from another AP. Over a moving window of time samples, we plot the total number of handoffs (entering and leaving users) observed at an AP. Not unexpectedly, the peaks in both curves show that the greatest extent of mobility (change of AP association) happens soon after the break sessions. Also, as expected from Figure 2, the number of handoffs is close to zero during the lunch session.
4.6 Summary of User Behavior We summarize our conclusions of this section by giving a highlevel characterization of a wireless user in a conference setting. The high-level characterization of a user is described in the form of a parameterized model in Table 3. Specifically, our observations are: • Users are evenly distributed across all APs and user arrivals are correlated in time and space. This is a direct consequence of the conference setting. • Most of the users have short session times: 60% of the user sessions last less than 10 minutes. Users with longer session times are idle for most of the session. • User sessions can broadly be categorized based on their bandwidth consumption into light, medium, and heavy sessions: light sessions on average generate traffic at 15 Kbps, medium sessions between 15 and 80 Kbps, and heavy sessions above 80 Kbps. The highest peak data rate over a one-minute interval is 590 Kbps. • Web and SSH traffic account for about 64% of the total application traffic bytes and 58% of the flows. • Our analysis of user mobility shows that users are mobile when expected, i.e., at the beginning and end of the conference sessions. About 75% of the users are seen at more than one AP during the day. Based on our observations of user behavior, we make the following conclusions. • We can correlate user arrivals into the network according to a two-state Markov-Modulated Poisson Process (MMPP). The mean inter-arrival time during the ON state is 38 seconds, and the mean duration of the OFF state is 6 minutes. • The session time distribution can be approximated to a General Pareto Distribution with a shape parameter of 0.78 and a scale parameter of 30.76. The coefficient of determination is 0.9. Short session times imply that network administrators using DHCP for IP address leasing can configure DHCP
to provide short-term leases (< 10 min.), after which IP addresses can be reclaimed or renewed. • There is an implicit correlation between session duration and average data rates. Longer sessions typically have very low data requirements. Most of the sessions with high average data rate are very short (< 15 minutes).
5.
NETWORK PERFORMANCE
Having studied user behavior in detail, we now focus on network performance. We first examine the offered load on the wireless network at each AP. Next, we study performance of the RF channel by characterizing channel error and MAC-level retransmissions.
5.1
Offered Load in the Wireless Network
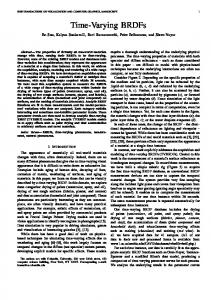
Figure 11a is a time-series plot of the wireless throughput at the NE AP for the duration of the conference. We see that the offered load on the wireless network peaks between 11 AM and 12:30 PM and again between 2 PM and 3 PM. The offered load drops considerably between 12:30 PM and 2 PM (the lunch hour). The peak throughput seen at the AP is 3.2 Mbps, about half its measured maximum capacity. Figure 11b is a similar time-series plot of the NE AP, but focuses on the second day of the conference, Thursday. Overlayed on the graph in vertical dashed lines is the conference schedule for the day, showing the greatest load during the session times. The overall bursty behavior and peaks and troughs are similar at all APs, though the absolute peak throughput at each AP varies. Figure 12 illustrates this effect by showing the offered load at each AP as a function of time on the second day of the conference. From the figure, we see that there is a rather uneven load distribution among the APs. APs NE and NW handle much higher peak loads than APs SE and SW. For example, over the three days there is a 37% difference between the peak throughput of APs NE and SW, even though they have roughly the same peak number of associated users. This behavior does not appear to be due to the location of the APs, but rather to the application workload of the users associated with the APs. Comparing the offered load at an AP in Figure 12 with the number of users in Figure 3, two things become apparent. First, even though the number of users associated to each AP during the day is roughly the same, the offered load in terms of bandwidth at the APs vary considerably. This indicates that offered load is more sensitive to individual user bandwidth requirements rather than just the number of users. Second, APs do not reach peak offered load when the number of associated users is a maximum. Again, the offered load at an AP is determined more by individual user application requirements. As a result, we conclude that existing AP load balancing algorithms that try to balance AP load according
Figure 11: The total wireless throughput at the NE AP (a) throughout the conference and (b) on the second day (Thursday). Statistic Mean Median 90th %ile
NE 2.81 2.16 5.32
% Packets in Error NW SE SW Overall 2.81 2.83 2.75 2.41 1.99 2.13 2.18 2.15 6.07 5.33 5.59 4.01
Table 4: The mean, median, and 90th percentile values of percentage packet error observed at each AP over the duration of the conference. The last column is the aggregate value across APs.
Statistic Mean Median 90th %ile
Overall Error (% packets) 2.41 2.15 4.01
Overall Retransmissions (%packets) 2.26 1.63 4.32
Table 5: The mean, median, and 90th percentile values of percentage packet error and retransmission.
and from the APs. to the number of associated users alone can perform poorly, and that such algorithms would benefit from the additional complexity of balancing users across APs according to their actual bandwidth requirements. We are investigating such algorithms in related research [1].
5.2 Channel Characteristics In this section, we analyze channel errors and retransmissions, and compare our observations with traditional analytic models for channel error. In both cases, we report the result as a percentage of the total packets transmitted in the time interval.
5.2.1
Packet Errors
Table 4 shows the mean, median, and 90th percentile of packet errors as seen at each AP and overall for the entire trace period. We calculate the error rates as a percentage of the total packets transmitted and received. This data is obtained from the SNMP trace, where the APs maintain a running count of the total number of packets transmitted and received and the number of packets in error. We take into account both inbound packets that could not be delivered to a higher layer protocol due to errors, and outbound packets that could not be transmitted due to a poor channel. From the table we see that the error rates are low but not insignificant, and similar for all APs. Although our environment was a large auditorium without many obstructions, obtaining a clear lineof-sight with the AP may have been difficult for a number of users: in many cases, users were seated with machines on their laps with people in seats in front and to their sides, and RF signals would have had to propagate through human obstructions on their way to
To look at error patterns more closely, Figure 13 plots the variation of error as seen at the NE access point during the second day (Thursday). We see that the error rates are bursty over time, and can be quite high for significant periods of time. For ten minutes just after 11am, for example, error rates varied between 6–28%. Comparing with Figure 10, we see that this time period correlates to a large number of handoffs. To model error rates as a function of time, we characterize the channel behavior in two states, good and bad, as has been done previously [6, 20, 22]. The good state is when the packet error rate is fairly steady, while the bad state is characterized by bursts of high error rate. Table 4 shows the parameter values when applying this model to all traffic in our trace. When characterized this way, we find that the parameter values for our model of channel error are greater than those traditionally used in simulations [13, 14]. Further, the mean duration of the bad state is less than 10% of the duration of the good state. The difference between our measurements and values previously used by other researchers may be explained in the following manner. Our measurements reflect the errors at the packet level rather than bit level, and represent values that must be taken into account in optimizing higher level protocol design. For example, TCP’s performance is influenced to a large extent by the packet error rate and not the bit error rate [2]. The lower time-scale errors, seen at the bit level, are hidden from higher layers and often handled efficiently in hardware. Furthermore, we do not believe that these error rates are an artifact due to an implementation problem by a particular vendor since we saw packets from 8 popular wireless hardware
Figure 12: The total wireless throughput at each AP through the day. vendors.
5.2.2
MAC-level Retransmissions
Table 5 presents the mean, median, and 90th percentile of the packet retransmissions for the NE AP through a typical day as a percentage of the total packets transmitted and received. Retransmissions at the MAC level are necessitated when poor channel conditions result in the original packet not being received and successfully decoded at the AP. The number of link-level retransmissions does not match the number of errors because the error count also includes MAC-level beacons in error. Since beacons are not retransmitted, the number of retransmissions is less than the number of packet errors. The table indicates that a small fraction of the packet errors, roughly 6% on average, are due to beacon packet errors.
5.3 Summary of Network Performance Overall, our analysis shows that: • Not surprisingly, the offered load on the network directly correlates with the conference schedule. It is highest during the talks, and lowest during the breaks. • The bandwidth distribution across APs is highly uneven and does not directly correlate to the number of users at an AP. Rather, the load at an AP is determined more by individual user workload behavior.
trace collected at the ACM SIGCOMM’01 conference held at U.C. San Diego in August, 2001. The goals of our study were to extend our understanding of wireless user behavior and wireless network performance by comparing and contrasting the workload in our setting with previous ones, to characterize wireless users in terms of a parametrized model for use with analytic and simulation studies involving wireless LAN traffic, and to apply our workload analysis results to better understand issues in wireless network deployment and potential network optimizations. For our conference workload of 195 users, our high-level results indicate that most sessions are relatively short (< 10 minutes), and longer sessions tend to be idle for the majority of time. Short session times imply that network administrators using DHCP for IP address leasing can configure DHCP to provide short-term leases, after which IP addresses can be reclaimed or renewed. Web browsing and secure shell are the dominant applications (64% of all bytes, 58% of all flows). In accordance with the dominant applications, we found that both average and peak individual user bandwidth requirements are relatively small. These low bandwidth requirements imply that, even with current 802.11b wireless technology, few APs are needed for a large number of users in such settings, and capacity planning will
• Even with just four APs for 195 users, the network is overprovisioned. None of the APs in the network reach their maximum capacity even with peak loads. • The wireless channel characteristics are similar across APs; the variation is more time-dependent than location-dependent. The overall median packet error rate is 2.15%, and the median packet retransmission percentage is 1.63%.
6. CONCLUSIONS In this paper we have presented and analyzed user behavior and network performance in a public-area wireless network based on a Figure 13: The percentage of packets that are in error.
be made even easier with the advent of higher capacity 802.11a wireless technology. We also found that the load distribution in terms of bandwidth across APs is highly uneven and not very well correlated with the number of users associated with those APs. As a result, we conclude that existing AP load balancing algorithms that attempt to balance AP load according to the number of users alone can perform poorly, and that such balancing algorithms would benefit from the additional complexity of balancing users across APs according to their actual bandwidth requirements. Finally, we note that the workload in this study is from a particular setting, a computer networking conference, characterized by a concentrated space and scheduled periods of use. This workload likely shares characteristics with similar wireless settings like classrooms, meeting and conference rooms, airport gates, etc., but does not represent all settings in which public-area wireless networks will be deployed. Consequently, our hope is that others will perform future studies of user behavior and network performance in similar and different wireless networks so that general characteristics and trends can be identified over time. The snmputil program, analysis scripts, and trace data used in this study are available at: http://ramp.ucsd.edu/pawn/sigcomm-trace
7. ACKNOWLEDGMENTS We would like to particularly thank those people who helped make this study possible. David Hutches from CSE and the School of Engineering, Don McLaughlin from Administrative Computing and Telecommunications, and Jim Madden from Network Operations installed the wireless network in the auditorium for the benefit of the conference. Elazar Harel, Assistant Vice Chancellor for ACT, generously funded the equipment and time for the wireless installation. David Hutches was also instrumental in providing SNMP access to the APs, and David Moore at CAIDA provided equipment, software, and expertise for our packet traces. We are also grateful to Renata Teixeira, Kameswari Chebrolu, and Narayanan Sriram Ramabhadran for their comments on the paper, and the SIGMETRICS referees for their thorough comments and suggestions. This research was supported in part by DARPA Grant N66001-011-8933, and a grant from Microsoft Research.
8. REFERENCES [1] A. Balachandran, P. Bahl, and G. Voelker. Hot-Spot Congestion Relief and User Service Guarantees in Public-area Wireless Networks. In Proceedings of WMCSA’02 – to appear, June 2002. [2] H. Balakrishnan, V. N. Padmanabhan, S. Seshan, and R. H. Katz. A comparison of mechanisms for improving TCP performance over Wireless links. IEEE/ACM Trans. on Networking, 15(5):745–770, December 1997. [3] B. J. Bennington and C. R. Bartel. Wireless Andrew: Experience building a high speed, Campus-Wide Wireless Data Network. In Proceedings of ACM MobiCom’97, pages 55–65, August 1997. [4] CAIDA. Coralreef: http://www.caida.org/tools/measurement/coralreef/. [5] D. Eckardt and P. Steenkiste. Measurement and Analysis of the Error Characteristics of an In-Building Wireless
Network. In Proceedings of ACM SIGCOMM’96, pages 243–254, August 1996. [6] E. N. Gilbert. Capacity of a Burst-noise Channel. Bell Systems Technical Journal, 39(2):1253–1265, September 1960. [7] N. Hegde and K. Sohraby. Blocking in large mobile cellular networks with bursty traffic. In Proceedings of the ACM SIGMETRICS’01, pages 123–132, June 2001. [8] IEEE. 802.11b/d3.0 Wireless LAN Medium Access Control (MAC) and Physical Layer (PHY) Specification, August 1999. [9] R. Jain. The Art of Computer Systems Performance Analysis. John Wiley and Sons, New York, 1991. [10] V. Jain, P. Congdon, J. R. Vollbrecht, A. Smith, R. Yavatkar, B. Rosen, and J. Roese. Port-based Network Access Control. IEEE Draft, September 1999. [11] D. Kotz and K. Essien. Characterizing Usage of a Campus-wide Wireless Network. Technical Report TR2002-423, Dartmouth College, March 2002. [12] K. Lai, M. Roussopoulos, D. Tang, X. Zhao, and M. Baker. Experiences with a Mobile Testbed. Worldwide Computing and Its Applications, Lectures notes in Computer Science, pages 222–237, 1998. [13] S. Lu, T. Nandagopal, and V. Bharghavan. A wireless fair service algorithm for packet cellular networks. In Proceedings of ACM MobiCom’98, pages 10–20, October 1998. [14] T. S. E. Ng, I. Stoica, and H. Zhang. Packet Fair Queueing Algorithms for Wireless Networks with Location-dependent Errors. In Proceedings of IEEE INFOCOM’98, pages 1103–1111, April 1998. [15] B. Noble, M. Satyanarayanan, G. Nguyen, and R. Katz. Trace-based Mobile Network Emulation. In Proceedings of ACM SIGCOMM’97, pages 51–61, September 1997. [16] Y. Rekhter, B. Moskowitz, D. Karrenberg, and G. D. Groot. Address allocation for Private Internets. IETF RFC 1597, March 1994. [17] K. Sohraby and A. Kolarov. A mathematical model for representing aggregate traffic in mobile networks. In Proceedings of the 7th International Conference on Personal, Mobile, and Spread Spectrum Communications, December 1996. [18] D. Tang and M. Baker. Analysis of a Metropolitan-Area Wireless Network. In Proceedings of ACM MobiCom’99, pages 13–23, August 1999. [19] D. Tang and M. Baker. Analysis of a Local-Area Wireless Network. In Proceedings of ACM MobiCom’00, pages 1–10, August 2000. [20] H. S. Wang and N. Moayeri. Finite State Markov Channel – A Useful Model for Radio Communication Channels. IEEE Transactions on Vehicular Technology, 44(1):163–171, February 1995.
[21] A. Wolman, G. Voelker, N. Sharma, N. Cardwell, A. Karlin, and H. M. Levy. On the scale and performance of cooperative Web proxy caching. In Proceedings of SOSP’99, pages 16–31, December 1999. [22] M. Zorzi, R. R. Rao, and L. B. Milstein. On The Accuracy Of a First-order Markov Model for data transmission on fading channels. In Proceedings of IEEE ICUPC’95, pages 211–215, November 1995.