within the unity editor without writing a single line of code. The pie chart can be ..... The online version of this doc
Chart And Graph Features Quick Start Folders of interest Bar Chart Pie Chart Graph Chart Legend Overview Bar Chart Canvas World Space Category settings Pie Chart canvas World Space Pie Category Graph Chart Graph Category Radar Chart Radar Category Gradient Materials Both world space and canvas chart contain the following settings Animations Chart Axis Labels Support
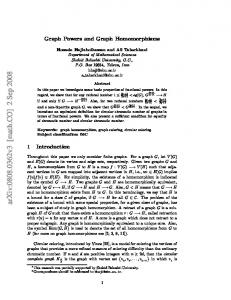
Features Chart And Graph is a powerful, state of the art charting asset for Unity3d. Use it to create customizable 2d and 3d charts from within the unity editor without writing even one line of code.
Or use the more advanced features and feed your charts with live data. Some features of Chart And Graph are: ● Full source code included ● Full editor preview and custom inspectors for all charts ● 2D/3D Responsive bar chart with labels ,supporting multiple categories and groups and can be set up completely from within the unity editor without writing a single line of code. The bar chart can be customized even more by using your own materials and prefabs instead of the default ones. ● 2D/3d Responsive pie chart and torus chart with labels, can be set up completely from within the unity editor without writing a single line of code. The pie chart can be customized even more by using your own materials and prefabs instead of the default ones. ● 2D Graph chart , with multiple categories , line fill and point marks. Visual appearance can be set up from within the unity editor without writing a single line of code. The graph chart can be customized even more by using your own materials for lines, line fill, and points. ● The axis components feature customized materials and appearance, date labels, texture tiling along the axis lines, and more. ● A legend prefab that can be used with all types of charts , and Chart animation components for bar and pie charts ● Includes gradient material for both canvas and world space
Quick Start Important Notice: The world space gradient shaders require the unity toon shader from the standard assets package. For more information look at this page The following tutorials assume you have imported the entire Chart And Graph package into your project. Notice the charts menu that has been added unders the tools menu of your editor , it can be used to add new charts to the current scene.
Folders of interest Chart And Graph / Demos/DemoScenes : various sample scenes from the demo project and some that are not included in the demo project. Chart And Graph/Demos/Tutorials : The quick start tutorials that appear later in this section Chart And Graph / Prefabs: prefabs that can be assigned to the charts and labels , be sure to explore this part of the library Chart And Graph/ Materials: useful materials for canvas charts , this include line styles and point styles for the axis and graph chart
Bar Chart 1. Go to Tools->Charts->Bar and select the type of bar chart you would like to create. A new chart object should appear in the scene ( if a canvas chart is selected it should appear under a canvas). 2. Select the bar object and view it in the inspector. Notice the data section of the bar chart inspector.
3. Expand both Categories and groups. You can add groups and categories by typing a name and clicking the add button. You can remove and rename groups and categories by clicking the “...” button near each one. For the sake of demonstration , We will assume that “category *” is renamed to “player *” and “group *” is renamed to “value *” 4. To edit the chart values from the editor click the “Edit Value” button 5. To update the bar chart from your script , create a new monobehaviour named BarChartFeed and add the following code to your script : void Start () { BarChart barChart = GetComponent(); if (barChart != null) { barChart.DataSource.SetValue("Player 1", "Value 1", Random.value * 20); barChart.DataSource.SlideValue("Player 2","Value 1", Random.value * 20, 40f); } } NOTICE: calling SetValue and SlideValue must be done with your own group and category names. Notice spaces and case letters 6. Add a BarFeedChart component to the bar chart object and click play. 7. The full example can be found in Assets\Chart and Graph\Demos\Tutorials\Bar
Pie Chart 1. Go to Tools->Charts->Pie Or Tools->Charts->Torus and select the type of chart you would like to create. A new chart object should appear in the scene ( if a canvas chart is selected it should appear under a canvas). 2. Select the pie or torus object and view it in the inspector. Notice the data section of the chart inspector.
3. Expand the Categories foldout. You can add categories by typing a name and clicking the add button. You can remove and rename categories by clicking the “...” button near each one. For the sake of demonstration , We will assume that “category *” is renamed to “player *”. 4. You can change the amount of each pie slice by editing it’s input box. 5. To update the pie chart from your script , create a new monobehaviour named PieChartFeed and add the following code to your script : void Start () { PieChart pie = GetComponent(); if(pie != null) { pie.DataSource.SlideValue("Player 1", 50, 10f); pie.DataSource.SetValue("Player 2", Random.value * 10); } }
NOTICE: calling set value must be done with your own category names. Notice spaces and case letters 6. Add a PieFeedChart component to the pie chart object and click play. 7. The full example can be found in Assets\Chart and Graph\Demos\Tutorials\Pie
Graph Chart 1. Add a canvas to the scene. Go to Tools->Charts->Graph and select the type of graph you would like to create. The chart should apear under the canvas. 2. Select the graph object and view it in the inspector. Notice the data section of the chart inspector.
3. Expand the Categories foldout. You can add categories by typing a name and clicking the add button. You can remove and rename categories by clicking the “...” button near each one. For the sake of demonstration , We will assume that “category *” is renamed to “player *”. 4. Graph data can only be changed through source code. The graph appearance can be customized in the editor. 5. To update the graph chart data from your script , create a new monobehaviour named GraphChartFeed and add the following code to your script : void Start () { GraphChart graph = GetComponent(); if (graph != null) { graph.DataSource.StartBatch(); graph.DataSource.ClearCategory("Player 1"); graph.DataSource.ClearCategory("Player 2"); for (int i = 0; i < 30; i++) { graph.DataSource.AddPointToCategory("Player 1",Random.value*10f,Random.value*10f); graph.DataSource.AddPointToCategory("Player 2", Random.value * 10f, Random.value * 10f); } graph.DataSource.EndBatch(); } }
NOTICE: calling set value must be done with your own category names. Notice spaces and case letters
6. Add a GraphFeedChart component to the graph chart object and click play. 7. The full example can be found in Assets\Chart and Graph\Demos\Tutorials\Graph
Legend 1. Add a canvas to the scene. Go to Tools->Charts->Legend. A new legend object will be created under the canvas 2. Select the legend object in the inspector
3. Drag any chart gameobject to the chart field of the inspector.
Overview Chart And Graph contains a few base component that can be used in order to create charts and customize them. The basic chart components are : WorldSpaceBarChart - 3d bar charts CanvasBarChart - canvas bar charts WorldSpacePieChart - 3d pie and torus charts CanvasPieChart - canvas pie charts GraphChart - canvas graph charts Once you have added one of the base components to the a gameobject , you can add the following additional setting components : HorizontalAxis/VerticalAxis - both bar and graph charts support axis display. Add these components to define the axis display. ItemLabels/CategoryLabels/GroupLabes - these components define lables settings for the chart, item labels appear for each item of the chart (for example each bar or pe slice). Category and group labels correspond to the categories and groups of the chart data.
Bar Chart Canvas
Bar Clicked - occurs when the a bar is clicked. Receives BarEventArgs with data. Bar Hovered - occurs when the a bar is hovered. Receives BarEventArgs with data. Non Hovered - occurs when the pointer leaves the current bar and no other bar is hovered. Height Ratio - The height ratio of the chart , the width is calculated by the other properties. Once the width and height ratio is set, the chart is fit into the rect transform. Bar Prefab - Use the default prefabs in Assets/Chart And Graph/Prefabs/Canvas/Bar. You can use your own prefab , make sure to set it’s size to a unity size and it pivot to bottom center. Axis Separation - the gap between the bars and the chart edges Bar Separation - the gap between bars within the same group. Group Separation - the gap between different groups. Bar Size - the size of each bar.
World Space
Bar Clicked - occurs when the a bar is clicked. Receives BarEventArgs with data. Bar Hovered - occurs when the a bar is hovered. Receives BarEventArgs with data. Non Hovered - occurs when the pointer leaves the current bar and no other bar is hovered. Height Ratio - The height ratio of the chart , the width is calculated by the other properties. Bar Prefab - Use the default prefabs in Assets/Chart And Graph/Prefabs/3d/. You can use your own prefab , make sure to set it’s size to a unity size and it pivot to bottom center. Axis Separation - the gap between the bars and the chart edges. This includes depth and breadth for 3d effects
Bar Separation - the gap between bars within the same group.This includes depth and breadth for 3d effects Group Separation - the gap between different groups.This includes depth and breadth for 3d effects Bar Size - the size of each bar. This includes depth and breadth for 3d effects
Category settings
Normal - the standard material for this category Hover - this color is assigned to the material when the bar is hovered. Use Color.clear for no effect Selected - this color is assigned to the material when the bar is selected. Use Color.clear for no effect.
Pie Chart canvas
Pie Clicked - occurs when the a pie is clicked. Receives PieEventArgs with data. Pie Hovered - occurs when the a pie is hovered. Receives PieEventArgs with data. Non Hovered - occurs when the pointer leaves the current pie and no other pie is hovered. Mesh segments - the amount of vertex segments in the pie mesh. Start Angle - the start angle of the pie chart. Value is in degrees Angle Span - the angle span of the pie chart. Value is in degrees
Spacing Angle- the spacing angle between pie slices. Value is in degrees Radius - the radius of the pie chart Torus Radius - the inner radius of the pie chart. Set this value to 0 for a pie chart , set this value to more than 0 for a torus chart. Extrusion - Translates the pie slices outwards for a non 0 value Prefab - Use one of the default prefabs in Assets/Chart And Graph/Prefabs/Canvas/Pie. Or use your own prefab by adding PieCanvasGenerator to it. Line Thickness - thickness for label lines in the pie chart. Line Spacing - spacing for label lines in the pie chart Line Material - material for labels lines in the pie chart
World Space
Pie Clicked - occurs when the a pie is clicked. Receives PieEventArgs with data. Pie Hovered - occurs when the a pie is hovered. Receives PieEventArgs with data.
Non Hovered - occurs when the pointer leaves the current pie and no other pie is hovered. Mesh segments - the amount of vertex segments in the pie mesh. Start Angle - the start angle of the pie chart. Value is in degrees Angle Span - the angle span of the pie chart. Value is in degrees Spacing Angle- the spacing angle between pie slices. Value is in degrees Radius - the radius of the pie chart Torus Radius - the inner radius of the pie chart. Set this value to 0 for a pie chart , set this value to more than 0 for a torus chart. Extrusion - Translates the pie slices outwards for a non 0 value Prefab - Use one of the default prefabs in Assets/Chart And Graph/Prefabs/3d. Or use your own prefab by adding WorldSpacePieGenerator to it.
Pie Category
Amount - the value of the category Normal - the standard material for this category Hover - this color is assigned to the material when the bar is hovered. Use Color.clear for no effect Selected - this color is assigned to the material when the bar is selected. Use Color.clear for no effect.
Graph Chart
Height/Width Ratio - the height and width ratio of the chart. For example if width is twice the size of height then the chart will have a 2:1 ratio. Note that the only thing that matters is the ratio between these values, because the chart is fitted into the rect transform it belongs to.
Graph Category
Material - The Material for the category graph line Line Tiling - line tiling can be used to create effects such as dotted lines. Use Stretch to stretch the texture over the entire line , or set the tile factor to make the texture repeat itself. Remember that the texture repeat mode must be enabled. Inner Fill - Material for the fill under the category line. Stretch Fill - If true the fill is stretched along the graph shape , if false the material is masked by the line shape. Point Material - the material used for the category points. Point Size - the size of the category points.
Radar Chart
Radius - the radius of the radar chart in units for 3d or pixels for 2d Angle - Use this to set the starting angle of the radar chart. This like rotation only that it keeps text labels aligned with the viewer Axis Point Material - the material used for radar axis points , for 3d chart this should be used along with a prefab. Leave this blank and the radar chart axis will have no dots Axis Line Material - the material used for radar axis lines, for 3d chart this should be used along with a prefab. Leave this blank and the radar chart axis will have no lines Axis Thickness - the thickness of the radar chart axis lines Axis Point Size - the size of a radar axis point Axis Add - for 3d radar chart , use this to create a 3d effect for the axis. Total Axis Devisions - the number of axis devisions for the radar chart. Axis Prefab - for 3d charts , use this to set a prefab for the axis lines Axis Point Prefab - for 3d charts , use this to set a prefab for the axis points
Radar Category
Separation - for 3d radar only. Set the depth of the category relative to the axis Curve - for 3d radar only , make the category mesh go along a curve instead of a plane Fill Material - The material used for the fill part of the radar category Fill Smoothing - for 3d radar only. Set the smoothing for a curved radar category Line Prefab - the prefab used for the line part of the category mesh Line Thickness - the thickness of the line part of the category mesh Line Material - the material for the line part of the category mesh Point Prefab - the point prefab for point part of the category mesh Point Size - the point size for the point part of the category mesh Point Material - the point material for the point part of the category mesh.
Gradient Materials The gradient shaders can be found under the Chart menu item in the shader selection menu
Both world space and canvas chart contain the following settings
Angle - the angle of the gradient. 0 for vertical gradient, 90 for horizontal , etc. Combine - this value is used by the chart components in order to change the color of the gradient. The combined value is interpolated with the gradient material by it’s alpha value. Setting the alpha value to 0 has no effect, and is the default value. From - the start color of the gradient
To - the end color of the gradient
Animations Use the BarAnimation component to animate Bar Charts. User the PieAnimation component to animate Pie Charts.
Chart Axis Each axis has both main divisions and sub divisions. Use the simple view to quickly set values for both of the division types. Use advance view to customize each division type. Sub divisions are for each main division. So if there are 5 main division and 5 sub division there will be a total of 5*5 = 25 divisions.
Depth- the depth of the axis relative to the chart. Format- the format of the axis labels. Can be either a number, a date , a time or a date time. Use the custom function of DataSource and DateUtillity to set date and time values. Mark Back Length - when mark depth in a non zero. This value is the size of the far side of the mark. Mark Length - the size of the near side of the mark
Mark Depth - the depth size of the mark Mark Thickness- the thickness of the mark Text Prefab- prefab for text labels. You can use the defualt prefabs in Assets/Chart And Graph/Prefabs Text Prefix/Suffix- added to each axis label text. ( a use case would be adding a “$” sign to indicate an amount of money) Fraction Digits - the maximum amount of fraction digits in the text lables. Font size - the font size of the text lables. Font Sharpness - adjust this to make the fonts look sharper. Text Depth - set the label position along the z axis Text Separation - set the label position along the line of the axis. Alignment - change the label side ( right or left)
Labels Label components can be added for categories, items and groups :
Text Prefab- prefab for text labels. You can use the defualt prefabs in Assets/Chart And Graph/Prefabs Text Prefix/Suffix- added to each axis label text. ( a use case would be adding a “$” sign to indicate an amount of money). You can also use some macros like