MICHAEL BACH, 1 PETER HISS 2 & JENS ROVER 3 t UniversitiJts-Augenklinik, D-7800 Freiburg, BRD; 2Universitiits-Augenklinik, D-2400. Liibeck, BRD ; 3 ...
Documenta Ophthalmologica 69:315-322 (1988) 9 Kluwer Academic Publishers, Dordrecht - Printed in the Netherlands
Check-size specific changes of pattern electroretinogram in patients with early open-angle glaucoma MICHAEL BACH, 1 PETER HISS 2 & JENS ROVER 3 t UniversitiJts-Augenklinik, D-7800 Freiburg, BRD; 2Universitiits-Augenklinik, D-2400 Liibeck, BRD ; 3Augenklinik der Sthdt. Krankenanstalten, D-4800 Bielefeld, BRD
Key words: check size, glaucoma, pattern electroretinogram Abstract. The pattern electroretinogram was recorded in patients with initial stages of visual field defects due to open-angle glaucoma and in age-matched normal subjects. Both normal subjects and glaucoma patients had a visual acuity above 0.8. Counterphasing checkerboard patterns were used as visual stimuli with a range of check sizes from 0.8~ to 15~ at 7.8 reversals/s. Whereas the amplitude in glaucoma patients was nearly normal for large check sizes, it was significantly reduced for small check sizes (p = 0.003). Possibly two separate mechanisms that generate the pattern electroretinogram for small and large checks are differentially affected; they may be related to the magnocellular and parvocellular systems. The difference between normals and glaucoma patients was even more significant when the ratios of the amplitudes at small and large check sizes were compared (p < 0.0002). When this ratio is used, the amplitude variability can be partly overcome and the pattern electroretinogram can be a sensitive indicator of ganglion cell function.
Introduction
T h e earliest recognizable signs o f chronic open-angle g l a u c o m a are changes in the retinal nerve fiber layer a n d the optic nerve head, which usually occur earlier t h a n the visual field defects. As detection o f ganglion cell d a m a g e by o p h t h a l m o s c o p y has a great variability between different examiners and often does not give positive results in early stages o f the disease as judged by visual field examination, a n u m b e r o f investigators have tried to find early psychophysical disturbances in glaucoma, for a recent review see D r a n c e and Airaksinen [1]. Statistical differences o f g r o u p m e a n s for psychophysical p a r a m e t e r s in g l a u c o m a and also in patients with ocular hypertension have been found. Electrophysiological studies in g l a u c o m a revealed amplitude reduction in the visual evoked potential a n d the p a t t e r n electroretinogram ( P E R G ) with pattern-reversal stimuli, while the luminance E R G remained unaltered [2, 3, 4]. H o w e v e r , the wide overlap between p a r a m e t e r s o f n o r m a l a n d g l a u c o m a t o u s eyes m a d e it impossible to d r a w diagnostic conclusions for a given individual on the basis o f these tests.
316 In a study concerning the functional origin of the PERG, we found a loss of response to all check sizes, including very large checks (15 ~ in patients with nearly complete optic atrophy. To study the transition from the normal to the atrophic condition, the present study was designed to analyze the dependency of check size in the PERG in early stages of glaucoma.
Material and methods
Glaucoma patients and visual normals We examined 15 eyes of 9 patients (mean age 60 + 9 years) with chronic open-angle glaucoma with glaucomatous visual field defects in stage 1 and 2 (stage 1, only relative defects; stage 2, spot-like, or arcuate, absolute defects, not connected with the blind spot [5]) and 8 eyes of 8 age-matched visual normals (mean age 58 _+ 6 years). The visual acuity was 0.8 or better, and the visual acuities in normal (mean visual acuity 0.95 __+ 0.13) and glaucomatous eyes (mean visual acuity 0.94 • 0.09) were closely matched. The visual acuity should always be taken into consideration, as reduction of visual acuity to 0.6 by cataract or defocus reduces the PERG amplitudes, especially for small (~< 0.8 ~ checks [6, 7]. No patient included in this study received miotic therapy. Any effect of pupil diameter [8] would thus affect both groups. The refraction was corrected for the viewing distance of 57 cm. The visual fields were tested with an automated static perimeter (Octopus 2000R, program G1).
Stimulation
Steady-state stimuli were presented on a TV monitor with a resolution of 704 • 290 pixel at a frame-rate of 50 Hz. For pattern-stimulation we used high-contrast (98%) checkerboards with a mean luminance of 62cd/m 2. Check sizes ranged from 0.8 ~ up to a size determined by the stimulus displayed where four checks covered 26 ~ x 34 o at the viewing distance of 57 cm (this check size we will refer to as 15 ~ For all check sizes the borders of the checks met at the center of the screen. The temporal frequency was 3.9 Hz (corresponding to 7.8 reversals/s). Luminance stimulation was performed by flashing the unpatterned display between luminances of 0.1 and 124cd/m 2 at a flash rate of 7.8/s with a bright-to-dark ratio of 0.5. As no bright surround was provided, some stray light could stimulate the peripheral retina. In the center of the screen a small cross served as fixation mark.
317 The other eye was patched. To monitor the attention of the subjects, we asked them to report a randomly chosen digit which appeared for 300 ms every 5-10 s instead of the cross.
Recording ERG responses were recorded with gold foil electrodes [9] placed between lower lid and sclera and referenced to the forehead; one ear was grounded. The signal was amplified and filtered by a standard electroencephalography machine (T6nnies) with a bandpass setting of 1.6-70 Hz (first order filters) and recorded by a small computer (Z80, CP/M +). Analog to digital conversion was performed with a resolution of 10 bits and a sampling rate of 500 Hz. Sweeps of 512 ms duration were averaged and continuously displayed. Sweeps exceeding an adjustable artifact threshold (usually 100 #V) were rejected. The computer also generated the stimuli. To facilitate Fourier analysis of steady-state responses, the reversal frequency was adjusted to yield an integer number of reversals per sweep, thus eliminating effects of 'spillover' in the spectrum. The amplitude was measured in the frequency domain as the magnitude of the first harmonic at the reversal frequency of 7.8 Hz. An estimate of the noise amplitude, based on the average of the two neighboring frequencies, was subtracted (with extinguished PERG, this procedure occasionally leads to negative amplitudes). Triggering was frame-locked (thus avoiding latency jitter) and occurred only on even reversals, i.e. only when the top left square became bright. Otherwise luminance responses due to asymmetries, e.g. by erratic fixation in the large check condition, would not be detected and might lead to artifactual high amplitudes at the reversal frequency [10]. With even triggering, asymmetries are easily detected as they produce a strong fundamental response at 3.9 Hz. All stimulus conditions were counterbalanced and measured at least twice to assess the reproducibility.
Results Fig. 1 depicts PERG traces for a check size of 0.8 ~ (left column), 15 ~ (center), and unpatterned luminance stimulation (right) in a normal subject (top row), a patient with beginning glaucomatous disturbances (middle), and one with advanced optic atrophy due to glaucoma (bottom). Note that under these stimulus conditions the PERG is virtually identical for the small and large check conditions in the normal subject. Optic atrophy (bottom
318
m
J
Normal subject (;laucoma. e a r l y stage Glaucoma, advanced stage
~ ~
,o[
~V i 100 ms
~
,o[
~V
.
/c~
^
_
w Wwk/
.
~V
Fig. 1. P E R G traces for a check size of 0.8 o (left column), 15 o (center), and unpatterned luminance stimulation (right). Three cases are depicted: a normal subject (top row), a patient with beginning glaucomatous disturbances (middle), and a patient with advanced optic atrophy due to glaucoma (bottom). The P E R G is virtually identical for the small and large check condition in the normal subject. In an early stage of glaucoma (middle row), attenuation of P E R G depends on check size. Progressive optic atrophy leads to P E R G loss irrespective of check size, while luminance responses are not reduced.
row) leads to P E R G loss irrespective of check size, but the luminance response remains intact (the more sinusoidal appearance was not a consistent finding). In early stages of glaucoma we found selective attenuation of P E R G amplitude: very low response to 0.8 o checks, but near-normal levels when we used 15 o checks. This difference in amplitude (based on Fourier analysis) with small and large check sizes is further demonstrated in Fig. 2. Mean amplitudes for normals are about equal for all check sizes, while in early glaucoma patients there is a threefold increase from a low value at 0.8 o to an amplitude close to normal at 15 o check size. The reduction of mean amplitudes is highly significant (p < 0.003) for small check sizes (0.8 o), whereas there is no significant difference at large check sizes (p > 0.05). The standard error of the mean (SEM) looks higher in the normal eyes. This can be attributed, however, to the lower sample size and to the higher mean amplitude; the relative variance is comparable between normal and early glaucoma eyes. Our results for the 0.8 o check size condition are replotted in Fig. 3, which shows the P E R G amplitudes of all eyes and the mean with 96% confidence limits (/~ ___ 2 SD). The categories from left to right indicate normal and glaucomatous eyes in stage 1 and 2 of glaucomatous visual field defects [5]. Although the mean amplitudes of normal and glaucomatous eyes differ
319 ["
2.0-
r Normal ~ubjects
1.5. > d) "0
1.0,
::&
'-'2 "ID
x,t
E .< 0 -1
X
normals
xtX X
stage 1 stage 2 glaucoma patients
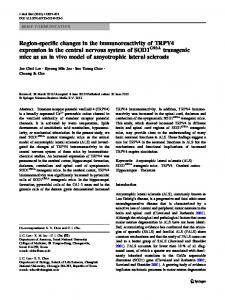
Fig. 3. Raw P E R G amplitudes (crosses), mean amplitudes and confidence limits (# ___ 2 SD) for a check size of 0.8 ~ subjects as in Fig. 2. The confidence interval for normal eyes nearly overlaps the range of the glaucomatous eyes.
320 'I..0 "-'2. < 00
,5
X
v
~o
xxt X
,