validate that certain properties inside the black box are sat- isfied during program execution. Recently program spectra have been proposed to characterize a ...
Selected as one of the Best Papers. Appears in Proceedings of the 20th IEEE International Conference on Software Maintenance An extended version is invited for submission to a special issue of IEEE Transactions on Software Engineering (TSE)
Checking Inside the Black Box: Regression Testing Based on Value Spectra Differences Tao Xie
David Notkin
Department of Computer Science & Engineering University of Washington Seattle, WA 98195, USA E-mail: {taoxie,notkin}@cs.washington.edu Abstract
has been used to expose faults complementing the traditional black box output checking approach. Runtime assertion [2, 15] or inferred invariant checking [4, 6] is used to validate that certain properties inside the black box are satisfied during program execution. Recently program spectra have been proposed to characterize a program’s behavior inside the black box [14]. Structural program spectra, such as branch, path, data dependence, and execution trace spectra, have been proposed in the literature [3, 7, 14]. In this paper, we propose a new class of program spectra called value spectra. The value spectra enrich the existing program spectra family [3, 7, 14], which primarily include structural spectra. Value spectra capture internal program states during a test execution. An internal program state is characterized by the values of the variables in scope. We collect internal program states at each user-function entry and exit as the value spectra of a test execution. A deviation is the difference between the value of a variable in a new program version and the corresponding one in an old version. We compare the value spectra from an old version and a new version, and use the spectra differences to detect behavior deviations in the new version. We use a deviationpropagation call tree to show the details of the deviations. A deviation root is a program location in the new version that triggers specific behavior deviations. A deviation root is among a set of program locations that are changed between versions. We propose two heuristics to locate deviation roots based on the deviation-propagation call tree. Identifying the deviation roots for deviations can help understand the reasons for the deviations and determine whether the deviations are regression-fault symptoms or just expected. Identified deviation roots can be additionally used to locate regression faults if there are any. This paper makes the following main contributions: • We propose a new class of program spectra, called value spectra, to enrich the existing program spectra family. We present three variants of value spectra. • We compare the value spectra from an old version and
Comparing behaviors of program versions has become an important task in software maintenance and regression testing. Traditional regression testing strongly focuses on black-box comparison of program outputs. Program spectra have recently been proposed to characterize a program’s behavior inside the black box. Comparing program spectra of program versions offers insights into the internal behavior differences between versions. In this paper, we present a new class of program spectra, value spectra, which enriches the existing program spectra family. We compare the value spectra of an old version and a new version to detect internal behavior deviations in the new version. We use a deviation-propagation call tree to present the deviation details. Based on the deviation-propagation call tree, we propose two heuristics to locate deviation roots, which are program locations that trigger the behavior deviations. We have conducted an experiment on seven C programs to evaluate our approach. The results show that our approach can effectively expose program behavior differences between versions even when their program outputs are the same, and our approach reports deviation roots with high accuracy for most programs.
1. Introduction Regression testing retests a program after it is modified. In addition to validating new added functionality, regression testing compares the behavior of a new version to the behavior of an old version to assure that no regression faults are introduced. When the outputs produced by two versions are different, regression faults are exposed. However, even if a variable-value difference is caused immediately after a new faulty statement is executed, the fault might not be propagated to the observable outputs because of the information loss or hiding effects. Checking inside the black box
28
a new version to detect behavior deviations in the new version. We use a deviation-propagation call tree to show the details of the deviations. • We propose two heuristics to locate deviation roots based on the deviation-propagation call tree. • We conduct an experiment on seven C programs to evaluate our new approach. The experimental results show that our approach can effectively report internal behavior differences between versions even when their program outputs are the same. Our deviation-root localization reports deviation roots with high accuracy for most programs. The next section proposes value spectra. Section 3 describes how we exploit the differences between value spectra of the same test on two versions. Section 4 describes the experiment that we conduct to evaluate our approach. Section 5 discusses related work and then Section 6 concludes.
#include int max(int a, int b) { if (a >= b) { return a; } else { return b; } } int main(int argc, char *argv[]) { int i, j; if (argc != 3) { printf("Wrong arguments!"); return 1; } i = atoi(argv[1]); j = atoi(argv[2]); if (max(i,j) >= 0){ if (max(i, j) == 0){ printf("0"); } else { printf("1"); } } else { printf("-1"); } return 0; }
2. Value Spectra This section introduces value spectra, which are used to characterize program behavior. We first describe internal program state transitions in the granularity of user functions. Based on the internal program state transitions, we next define three variants of value spectra.
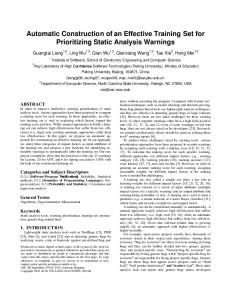
Figure 1. A sample C program
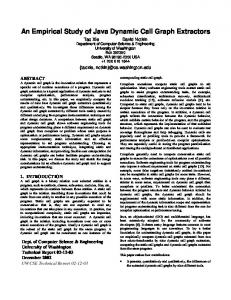
additionally comprises the variable values that are directly or indirectly reachable from the pointer-type variable. A function execution is characterized by its function-entry and function-exit states. To illustrate value spectra, we use a sample C program shown in Figure 1. This program receives two integers as command-line arguments. It outputs -1 if the maximum of two integers is less than 0, outputs 0 if the maximum of them is equal to 0, and outputs 1 if the maximum of them is greater than 0. When the program receives fewer or more than two command-line arguments, it outputs an error message. Figure 2 shows the internal program state transitions of the sample program with the command line arguments of "0 1". In the program execution, the main function calls the max function twice with the same arguments, and then outputs "1" as is shown inside the cloud in Figure 2.
2.1. Internal Program State Transitions The execution of a program can be considered as a sequence of internal program states [21]. Each internal program state comprises the program’s in-scope variables and their values at a particular execution point. Each program execution unit (in the granularity of statement, block, code fragment, function, or component) receives an internal program state and then produces a new one. The program execution points can be the entry and exit of a user-function execution when the program execution units are those code fragments separated by user-function call sites. Program output statements (usually I/O output operations) can appear within any of those program execution units. Since it is relatively expensive in practice to capture all internal program states between the executions of program statements, we focus on internal program states in the granularity of user functions, instead of statements. A function-entry state is an internal program state at the entry of a function execution. A function-entry state comprises the function’s argument values and global variable values. A function-exit state is an internal program state at the exit of a function execution. A function-exit state comprises the function return value, updated argument values, and global variable values. Note that a function-exit state does not consider those local variable values. If any of the preceding variables at the function entry or exit is of a pointer type, the function-entry or function-exit state
2.2. Value Spectra Types Several classes of program spectra are proposed in the literature, including branch, path, data-dependence, execution trace, and output spectra [3, 7, 14]. Execution-trace spectra record the sequence of program statements traversed as a program executes. Output spectra record the output values produced by a program as it executes [7]. Except for output spectra, all these spectra are based on execution structure. We refer to these spectra as structural spectra. We propose a new class of program spectra, value spec-
29
tra. Value spectra track the variable values in internal program states, which are exercised as a program executes. We propose three new variants of value spectra: • User-function value hit spectra (in short as value hit spectra). Value hit spectra indicate whether a userfunction execution is exercised. • User-function value count spectra (in short as value count spectra). Value count spectra indicate the number of times that a user-function execution is exercised. • User-function value trace spectra (in short as value trace spectra). Value trace spectra record the sequence of the user-function executions traversed as a program executes. Table 1 shows the value spectra and the output spectra for the sample C program execution with input "0 1". We represent a user-function execution using the following form:
argc argv[1]
3
a
“0”
b
0
a
1
b
argv[2]
ret
“1”
0
a
1
b
0
a
1
b ret
1
0
argc
3
1
argv[1]
“0”
argv[2] 1
“1” ret
0
“1”
main entry state
max entry state
max exit state
max entry state
max function exec-1
max exit state
main exit state
max function exec-2
main function exec
Figure 2. Internal program state transitions of the sample C program execution with input
funcname(entry(argvals),exit(argvals,ret))
"0 1"
where funcname represents the function name, argvals followed by entry represents the argument values and global variable values at the function entry, argvals followed by exit represents the updated argument values and global variable values at the function exit, and ret represents the return value of the function. Function executions in value hit spectra or value count spectra have no ordering among them but those in value trace spectra do have ordering. In value count spectra, a count marker of "* num" is appended to the end of each function execution to show that the function execution is exercised num times. Note that if we change the second max function call from max(i,j) to max(j,i), we will have two distinct entities for max in the value hit and value count spectra. It is because these two function executions will become distinct with different function-entry or function-exit states. In value trace spectra, the markers of "∨" are inserted in the function-execution sequence to indicate the returns of function executions [13]. The value trace spectra for the sample program shows that main calls max twice. Without these markers, the same function-execution sequence would result from main calling max and max calling max. Harrold et al. define subsumption relationships among program spectra [7]. Spectra type S1 subsumes spectra type S2 if and only if whenever the S2 spectra for program P, version P’, and input i differ, the S1 spectra for P, P’, and i differ. Spectra type S1 strictly subsumes spectra type S2 if S1 subsumes S2 and for some program P, version P’, and i, the S1 spectra differ but the S2 spectra do not. Spectra types S1 and S2 are incomparable if neither S1 strictly subsumes S2 nor S2 strictly subsumes S1. The value trace spectra strictly subsume the value count spectra, and the value count spectra strictly subsume the value hit spectra. The output spectra are incomparable with any of the three value spectra, since the program’s output statements inside a particular user function body might output some constants or variable values that are not captured
in that user function’s entry or exit state. For example, when we shuffle those printf statements in the main function body, the program still has the same value spectra but different output spectra. On the other hand, the executions with different value spectra might have the same output spectra. However, when those function bodies containing output statements are not modified in version P’, the value trace spectra strictly subsumes the output spectra. In addition, if we also collect the entry and exit states of system output functions in the value trace spectra, the value trace spectra strictly subsume the output spectra. Execution-trace spectra strictly subsume any other program spectra, including the three value spectra. Traditional structural spectra, such as branch, path, and data-dependence spectra are incomparable with any of the three value spectra. For example, when we change the statement of i = atoi(argv[1]) to i = atoi(argv[1]) + 1, we will have the same traditional structural spectra but different value spectra with input "0 1" running on the two versions. On the other hand, when we move the statement of printf("1") from within the inner else branch to after the inner else branch, and add a redundant statement i = i + 1 after the printf("1") statement, we will have different traditional structural spectra, but the same value spectra with input "0 1" running on the two versions.
3. Value Spectra Differences This section presents how we exploit the differences between value spectra of the same test on two versions. We first describe how we compare value spectra. We then describe the deviation propagations exhibited by spectra dif-
30
spectra value hit spectra value count spectra value trace spectra output spectra
profiled entities main(entry(3,"0","1"),exit(3,"0","1",0)), max(entry(0,1),exit(0,1,1)) main(entry(3,"0","1"),exit(3,"0","1",0))*1, max(entry(0,1),exit(0,1,1))*2 main(entry(3,"0","1"),exit(3,"0","1",0)), max(entry(0,1),exit(0,1,1)), ∨, max(entry(0,1),exit(0,1,1)), ∨, ∨ "1"
Table 1. Value spectra for the sample program with input "0 1" ferences. We finally present two heuristics to locate deviation roots based on deviation propagation.
tion executions are exercised. If we want to determine just whether two value trace spectra are the same, we can simply compare the concatenated function-execution sequence to see whether they are the same. If we want to determine the detailed function-execution differences between two value trace spectra, we can use the constructed dynamic call tree and the GNU Diffutils [5] to match up the compared function executions from two value trace spectra. After the matching, when a function execution f is present in the old (new) version but absent in the new (old) version, we can consider that an empty function execution in the new (old) version is compared with f.
3.1. Spectra Comparison In this paper, we primarily focus on the comparison of value spectra from the same test running on an old version and a new version. We need to compare function executions from two versions when comparing the value spectra from these versions. We can reduce the comparison of two function executions to the comparison of the function names, signatures, and the corresponding variable values in the function-entry and function-exit states from these two function executions. When some variables in a function entry or exit state are pointers, their variable values are memory addresses. In the presence of these pointer variables, running a test on the same program twice might produce different value spectra. If we just ignore these pointer-variable values, we lose the referencing relationships among variables. To address this problem, we perform a linearization algorithm on each function-entry or function-exit state. In this paper, we omit the details of the algorithm, which is described elsewhere [19]. This mechanism avoids comparing memory addresses but still compares referencing relationships. If two function executions have the same function name, signature, linearized function-entry state, and linearized function-exit state, these two function executions are equivalent. The comparison of value count spectra additionally considers the times that equivalent function executions are exercised. The value hit or value count spectra do not distinguish two equivalent function executions that are called by different callers or in different sequence order. In the comparison of value hit or value count spectra, given a function execution in the new version, the compared function execution in the old version is the one that has the same function name, signature, and the same function-entry state. If we cannot find such a function execution in the old version, the compared function execution is an empty function execution. An empty function execution has a different function name, function signature, function-entry state, or functionexit state from any other regular function executions. The comparison of value trace spectra further considers the calling context and sequence order in which func-
3.2. Deviation Propagation Assume fe is a function execution in the new version and fe’ is its compared function execution in the old version. If fe and fe’ are equivalent, then fe is a non-deviated function execution. If fe and fe’ are not equivalent, then fe is a deviated function execution. We have categorized a deviated function execution into one of the following two types: • Deviation container. fe is a deviation container, if fe has the same function name and signature, and the same function-entry state as fe’, but has a different function-exit state from fe’. There is a certain behavior deviation inside a deviation container. Note that when there is a certain behavior deviation inside a function execution, the function execution might not be observed to be a deviation container, since the behavior deviation might not be propagated to the function exit. • Deviation follower. fe is a a deviation follower, if fe does not have the same function-entry state as fe’. There is a certain behavior deviation before a deviation follower. For value count spectra, there is an additional situation that a function execution is categorized as a deviation follower besides the preceding condition. If the count of an equivalent function execution from two versions are different, we need to use a matching technique (similar as the one used in the value trace spectra comparison) to identify which particular function executions in one version are absent in the other version.
31
(The execution of the 58th test) main |__initialize |__alt_sep_test |__Non_Crossing_Biased_Climb | |__Inhibit_Biased_Climb | |__Own_Above_Threat |__Non_Crossing_Biased_Descend | |__Inhibit_Biased_Climb | |__Own_Below_Threat--------[dev follower] | |__ALIM--------------------[dev follower] |__Own_Above_Threat
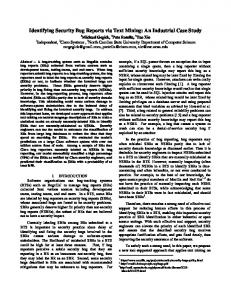
The details of value spectra differences can provide insights into deviation propagation in the execution of the new version. We first construct a regular dynamic call tree from the data trace collected during a test execution. We then annotate the call tree with deviation information to form a deviation-propagation call tree. Figure 3 shows the deviation-propagation call trees of two test executions on a new (faulty) version of the tcas program. The tcas program, its faulty versions, and test suite are contained in a set of siemens programs [8], which are used in the experiment described in Section 4. In the call trees, each node is associated with a function execution, and parent node calls its children nodes. For brevity, each node is marked with only the corresponding function name. The execution order among function executions is from the top to the bottom, with the earliest one at the top. If there is any deviated function execution, its deviation type is marked in the end of the function name. Usually behavior deviations are originated from certain program locations that are changed in the new version. These program locations are called deviation roots. The function that contains a deviation root is called deviationroot container. In the new (faulty) version of the tcas program, a relational operator > in the old (correct) version is changed to >=. The function that contains this changed line is Non Crossing Biased Descend. Some variable values at later points after a deviationroot execution might differ from the ones in the old version because of the propagation of the deviations at the deviation root. The deviations at the function exit of the deviation-root container might cause the deviation-root container to be observed as a deviation container. Note that some callers of the deviation-root container might also be observed as deviation containers. For example, in the lower call tree of Figure 3, the deviation-root container Non Crossing Biased Descend is observed as a deviation container and its caller alt sep test is also observed as a deviation container. Sometimes deviations after a deviation-root execution might not be propagated to the exit of the deviation-root container, but the deviations might be propagated to the entries of some callees of the deviation-root container, causing these callees to be observed as deviation followers. For example, in the upper call tree of Figure 3, the deviation-root container’s callees Own Below Threat and ALIM are observed as deviation followers.
(The execution of the 91st test) main |__initialize |__alt_sep_test-------------------[dev container] |__Non_Crossing_Biased_Climb | |__Inhibit_Biased_Climb | |__Own_Above_Threat | |__ALIM |__Own_Below_Threat |__Non_Crossing_Biased_Descend-[dev container] |__Inhibit_Biased_Climb |__Own_Below_Threat
Figure 3. Deviation-propagation call trees of a new version (the 9th faulty version) of the tcas program
by observing value spectra differences. This task is called deviation-root localization. A deviation container’s function-entry state is not deviated but its function-exit state is deviated. In contrast, a deviation follower’s function-entry state has already been deviated. The function-entry or function-exit state of a nondeviated function execution is usually not deviated. Deviation roots are likely to be within those statements executed within a deviation container or before a deviation follower. The following two heuristics are to narrow down the scope for deviation roots based on deviation propagation effects: Heuristic 1 Assume f is a deviation follower and g is the caller of f. If (1) g is not a deviation follower, but a deviation container or a non-deviated function execution, and (2) neither a deviation container nor a deviation follower is present between the entry of g and the call site of f, deviation roots are likely to be among those statements executed between the entry of g and the call site of f, excluding user-function-call statements. Heuristic 2 Assume f is a deviation container. If none of f’s callees is a deviation follower, deviation roots are likely to be among those statements executed within f’s function body, excluding user-function-call statements. For example, in the upper and lower call trees of Figure 3, we use Heuristic 1 and Heuristic 2 to accurately locate the deviation root to be among those statements in Non Crossing Biased Descend, respectively. When multiple changes are made at different program locations in the new version, there might be more than one de-
3.3. Deviation-Root Localization In the previous section, we have discussed how deviations are propagated given a known deviation root. This section explores the reverse direction: locating deviation roots
32
viation root that causes behavior deviations. If a deviation root’s deviation effect is not propagated to the execution of another deviation root, and each deviation root causes their own value spectra differences, our heuristics can locate both deviation roots at the same time.
program printtok printtok2 replace schedule schedule2 tcas totinfo
4. Experiment
funcs 18 19 21 18 16 9 7
loc 402 483 516 299 297 138 346
tests 4130 4115 5542 2650 2710 1608 1052
vers 7/7 10/10 12/32 9/9 10/10 9/41 6/23
|trc|(kb/t) 36 50 71 982 272 8 27
Table 2. Subject programs used in the experiment
This section presents the experiment that we conduct to evaluate our approach. We first describe the instrumentation, objective, and measures of the experiment. We then present and discuss the experimental results. We finally discuss scalability issues and threats to validity.
space cost (in kilobytes) of storing data traces collected for a test. We perform the experiment on a Linux machine with a Pentium IV 2.8 GHz processor. In the experiment, we use the original program as the old version and the faulty program as the new version. We use all the test cases in the test suite for each program. To control the scale of the experiment, for those programs with more than 10 faulty versions, we select only those faulty versions in an order from the first version to make each selected version have at least one faulty function that has not yet occurred in previously selected versions.
4.1. Instrumentation We prototype our approach to determine the practical utility. Our prototype is based on the Daikon [4] front end for C programs. Daikon is a system for dynamically detecting likely program invariants. It runs an instrumented program, collects and examines the values that it computes, and detects patterns and relationships among those values. The Daikon front end instruments C program code for collecting data traces during program executions. We have developed several Perl scripts to compute and compare all three variants of value spectra and output spectra from the collected data traces. In the experiment, we have implemented the deviation-root localization for only value hit spectra, and we plan to implement and experiment the deviationroot localization for value count and value trace spectra in future work. Given two spectra, our tools report in textual form whether these two spectra are different. For value hit spectra, our tools can display value spectra differences in deviation-propagation call trees in plain text (as is shown in Figure 3) and report deviation-root locations also in textual form. We use seven C programs as subjects in the experiment. The researchers at Siemens Research created these seven programs with faulty versions and a set of test cases [8]; these programs are popularly referred as the siemens programs. The researchers constructed the faulty versions by manually seeding faults that were as realistic as possible. Each faulty version differs from the original program by one to five lines of code. The researchers kept only the faults that were detected by at least three and at most 350 test cases in the test suite. Columns 1–4 of Table 2 show the program names, number of functions, lines of executable code, and number of tests of these seven subject programs, respectively. Column 5 contains two numbers separated by "/". The first number is the number of the faulty versions selected in this experiment and the second number is the total number of faulty versions. Column 6 shows the average
4.2. Objective and Measures The objective of the experiment is to investigate the following questions: 1. How different are the three value spectra types and output spectra type in terms of their deviation-exposing capability? 2. How accurately do the deviation-root localization heuristics locate the deviation root? Given spectra type S, program P , new version P 0 , and the set CT of tests that cover the changed lines, let DT (S, P, P 0 , CT ) be the set of tests each of which exhibits S spectra differences and LT (S, P, P 0 , CT ) be the set of tests each of which exhibits spectra differences and we use these differences to accurately locate deviation roots. To answer Questions 1 and 2, we use the following two measures respectively: • Deviation exposure ratio. The deviation exposure ratio for spectra type S is the number of the tests in DT (S, P, P 0 , CT ) divided by the number of the tests 0 ,CT )| in CT , given by the equation: |DT (S,P,P |CT | • Deviation-root localization ratio. The deviation-root localization ratio for spectra type S is the number of the tests in LT (S, P, P 0 , CT ) divided by the number of the tests in DT (S, P, P 0 , CT ), given by the equa|LT (S,P,P 0 ,CT )| tion: |DT (S,P,P 0 ,CT )|
33
0
0.2
0.4
0.6
0.8
1.0
Higher values of either measure indicate better results. In the experiment, we measure the deviation-root localization ratio in the function granularity for the convenience of measurement. That is, when the deviation-root localization locates the deviation-root containers (the functions that contain changed lines), we consider that the localization accurately locates the deviation root. For those changed lines that are in global data definition portion, we consider the deviation-root containers to be those functions that contain the executable code referencing the variables containing the changed data. We measure deviation exposure ratios for each combination of a program, its new version, and a spectra type. We measure deviation-root localization ratios for each combination of a program, its new version, and value hit spectra type.
output
value hit
value count
value trace
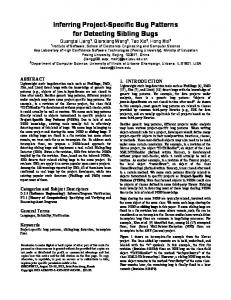
Figure 4. Experimental results of deviation exposure ratios
4.3. Results
0
0.2
0.4
0.6
0.8
1.0
Figures 4 and 5 use boxplots to present the experimental results. The box in a boxplot shows the median value as the central line, and the first and third quartiles as the lower and upper edges of the box. The whiskers shown above and below the boxes technically represent the largest and smallest observations that are less than 1.5 box lengths from the end of the box. In practice, these observations are the lowest and highest values that are likely to be observed. Small circles beyond the whiskers are outliers. Figure 4 shows the experimental results of deviation exposure ratios. The vertical axis lists deviation exposure ratios and the horizontal axis lists four spectra types: output, value hit, value count, and value trace spectra. Figure 5 shows the experimental results of deviation-root localization ratios for value hit spectra. The vertical axis lists deviation-root localization ratios and the horizontal axis lists subject names. We observed that checking value spectra differences increases the deviation exposure ratio about a factor of three compared to checking program output differences. This indicates that a relatively large portion of deviations could not be propagated to program outputs. There are no significant differences of the deviation exposure ratios among the three value spectra, except that the third quartile of the value trace spectra is slightly higher than the one of the value hit or value count spectra. In Figure 5, the deviation-root localization ratios are near 1.0 for all subjects except for the schedule2 program; therefore, their boxes are collapsed to almost a straight line near the top of the figure. The results show that our heuristics for value hit spectra can accurately locate deviation roots for all subjects except for the schedule2 program. We inspected schedule2’s traces carefully to find out the reasons. By default, the Daikon front end instru-
printtok
printtok2
replace
schedule schedule2
tcas
totinfo
Figure 5. Experimental results of deviationroot localization ratios for value hit spectra
ments nested or recursive types (structs that have struct members) with the instrumentation depth of three. For example, given a pointer to the root of a tree structure, we collect the values of only those tree nodes that are within the tree depth of three. In schedule2, we did not collect complete program state information in a key linked-list struct using the instrumentation depth of three. In some of schedule2’s faulty versions, deviations occur on the key linked-list struct beyond the depth of three. Therefore we could not detect the deviations at the exits of deviation roots. We expect that we could increase the deviation-root localization ratios after increasing the instrumentation depth. The experiment simulates the scenario of introducing regression faults into programs during program modifications. When programmers perform a modification that is not ex-
34
Cost = O(|vars| × |userf uncs| × |testsuite|) where |vars| is the number of variables at the entry and exit of a user function, |userf uncs| is the number of instrumented user functions, and |testsuite| is the size of the test suite. To address scalability, we can reduce |testsuite| by applying our approach on only those tests selected by regression test selection techniques [16]. In addition, we can also reduce |userf uncs| by instrumenting only those modified functions and their (statically determined) up-ton-level callers. The reduced scope of instrumentation trades a global view of deviation propagation for efficiency.
pected to change program behavior, our spectra comparison approach can show the occurrences of unintended deviations and our deviation-root localization accurately locates the regression faults. Moreover, we can reverse the version order by treating the faulty version as the old version and the correct version as the new version. Then we can conduct a similar experiment on them. This simulates the scenario of fixing program bugs. Since our spectra comparison is symmetry, we expect to get the same experimental results. This shows that when programmers perform a bug-fixing modification, our approach can show them the occurrences of the intended deviations.
4.5. Threats to Validity 4.4. Scalability The threats to external validity primarily include the degree to which the subject programs, faults or program changes, and test cases are representative of true practice. The siemens programs are small and most of the faulty versions involve simple, one- or two-line manually seeded faults. Moreover, the new versions in our experiment do not incorporate other fault-free changes since all the changes made on faulty versions deliberately introduce regression faults. These threats could be reduced by more experiments on wider types of subjects in future work. The threats to internal validity are instrumentation effects that can bias our results. Faults in our prototype and the Daikon front end might cause such effects. To reduce these threats, we manually inspected the spectra differences on a dozen of traces for each program subject. One threat to construct validity is that our experiment makes use of the data traces collected during executions, assuming that these precisely capture the internal program states for each execution point. However, in practice the Daikon front end explores nested structures up to the depth of only three by default.
The space cost of our approach is primarily the space for storing collected data traces. The last column of Table 2 shows the average space in kilobytes (KB) required for storing data trace for a test. The average required space for a test ranges from 8 to 71 KB except for the schedule and schedule2 programs (with the space of 982 and 272 KB, respectively), because these two programs contain global linked-list structs, whose collected values require much space. The time cost of our approach is primarily the time of running instrumented code (collecting and storing data traces) as well as computing and comparing value spectra. The slowdown ratio of instrumentation is the time of running a test on instrumented code divided by the time of running the same test on uninstrumented code. We observed that the average slowdown ratio of instrumentation ranges from 2 to 7 except for the schedule and schedule2 programs (with the ratios of 48 and 31, respectively). The average elapsed real time for running a test on instrumented code ranges from 7 to 30 milliseconds (ms) except for the schedule and schedule2 programs (with the time of 218 and 137 ms, respectively). The elapsed real time for computing and comparing two value spectra of a test ranges from 24 to 170 ms except for the schedule and schedule2 programs (with the time of 3783 and 1366 ms, respectively). We speculate that applying our approach on larger programs could achieve better improvement of deviation exposure over program output checking, because deviations are probably less likely to be propagated to the outputs of larger programs. We speculate that deviation-root localization ratios might be less affected by the scale of programs than the type of variables used by programs (e.g., simple versus complex data structures). In future work, we plan to validate these speculations empirically. Larger programs require higher space and time costs. The time or space cost of our approach can be characterized as
5. Related Work Reps et al. use program spectra to characterize a program’s behavior inside the black box [14]. They compare path spectra from two test executions on the same program to tackle the Year 2000 problem. Harrold et al. empirically investigate the relationship between structural spectra differences and output spectra differences of two program versions in regression testing [7]. The structural program spectra that they investigate include branch, path, data dependence, and execution trace spectra. Their experimental results show that when a test input causes program output differences between versions, the test input is likely to cause structural spectra differences. However their results show that the reverse is not true. In future work, we plan to extend our approach to work on structural spectra. For example, we can similarly annotate a regular dynamic call tree with marks for structurally-deviated function executions.
35
However, we cannot further categorize structurally-deviated function executions into deviation containers or deviation followers, because based on only structural spectra we cannot determine whether the entry state of a structurallydeviated function execution is deviated. Since the propagation information is coarser, we speculate that our adapted approach for structural spectra would be less effective for deviation propagation and deviation-root localization. However, we need to empirically validate this hypothesis. In future work, we plan to empirically compare the approaches for structural spectra and value spectra. Memon et al. model a GUI state in terms of the widgets that the GUI contains, their properties, and the values of the properties [11]. A GUI state corresponds to a function-entry or function-exit state in our approach. Their experimental results show that comparing more-detailed GUI states (e.g., GUI states associated with all or visible windows) from two versions can detect faults more effectively than comparing less-detailed GUI states (e.g., GUI states associated with the active window or widget). Our experiment shows a similar result: checking more-detailed behavior inside the black box can more effectively expose behavior deviations than checking just the black-box output. Our work differs from their work in two main aspects: our approach is not limited for GUI applications and our approach additionally investigates deviation propagation and deviation-root localization. Abramson et al. develop the relative debugging technique to use a series of user-defined assertions between a reference program and a suspect program [1]. These assertions specify key data structures that must be equivalent at specific locations in two programs. Then a relative debugger automatically compares the data structures and reports any differences while both versions are executed concurrently. Our approach does not require user-defined assertions but compares states at the entries and exits of user functions. Jaramillo et al. develop the comparison checking approach to compare the outputs and values computed by source level statements in the unoptimized and optimized versions of a source program [9]. Their approach requires the optimizer writer to specify the mappings between the unoptimized and optimized versions in the optimization implementation. Their approach locates the earliest point where the unoptimized and optimized programs differ during the comparison checking. Our approach operates at the granularity of user-function executions and uses two heuristics to locate deviation roots instead of using the earliest deviation points. Moreover, our approach does not require any extra user inputs and targets at testing general applications rather than optimizers. McCamant and Ernst use the Daikon tool [4] to compare the inferred program properties for the old component in the context of the system and for the new component in the context of its test suite [10]. If the comparison shows
that the new component does not make all the guarantees that the old one did, then their tool predicts that the upgrade may affect system behavior, and should not be performed before further scrutiny. Their approach operates on the component black-box boundary, whereas our approach operates inside the black box of the component or program. In addition, their approach compares abstracted behavior using different tests for two versions, whereas our approach compares the actual variable values using the same test for two versions. Zeller develops the delta debugging algorithm to systematically determine the minimal set of failure-inducing changes between versions given external failure symptoms [20]. His algorithm achieves this goal by rerunning the same test on the old version with different subsets of changes. Our approach runs the same test on two versions, observes their internal behavior deviations, and locates deviation roots. Zeller’s later work isolates the relevant variables and values by systematically narrowing the internal program state differences between a passing and a failing test execution on a faulty version [21]. Our approach observes the internal program state differences between the same test’s executions on two versions. Zeller’s approach requires the user to specify program locations where to compare internal program states, whereas our approach compares the program states at user-function entries and exits. Fault propagation has been investigated in the testing literature. Thompson et al. propose the RELAY model to understand how a fault may or may not cause a failure on some test executions [17]. Voas presents the PIE (Propagation, Infection, and Execution) analysis to assess the probability that under a given input distribution, if a fault exists in a code component, it will result in a failure [18]. The PIE analysis focuses on the estimation and analysis of fault exposure probability with the goal of generating or selecting test cases that propagate the faults to outputs. Our approach focuses on regression testing and proactively exposes behavior deviations by checking inside the black box instead of checking only black-box outputs. Our approach also offers an empirical way of studying fault propagation behavior complementing existing analytic approaches. Reese and Leveson present the software deviation analysis technique to determine whether a software specification can behave well when there are deviations in data inputs from an imperfect environment [12]. Given a requirements specification, a list of safety-critical program outputs, assumptions about particular deviations in program inputs, their technique produces the constraints on the internal program states that are sufficient to lead to an output deviation in a safety-critical program output. Our approach operates on two program versions and the deviations are rooted from some program locations that are changed between versions, rather than from program inputs.
36
6. Conclusion
[7] M. J. Harrold, G. Rothermel, K. Sayre, R. Wu, and L. Yi. An empirical investigation of the relationship between spectra differences and regression faults. Journal of Software Testing, Verification and Reliability, 10(3):171–194, 2000. [8] M. Hutchins, H. Foster, T. Goradia, and T. Ostrand. Experiments of the effectiveness of dataflow- and controlflowbased test adequacy criteria. In Proceedings of the 16th International Conference on Software Engineering, pages 191– 200, 1994. [9] C. Jaramillo, R. Gupta, and M. L. Soffa. Debugging and testing optimizers through comparison checking. In J. Knoop and W. Zimmermann, editors, Electronic Notes in Theoretical Computer Science, volume 65. Elsevier, 2002. [10] S. McCamant and M. D. Ernst. Predicting problems caused by component upgrades. In Proceedings of the 10th ESEC/FSE, pages 287–296, 2003. [11] A. M. Memon, I. Banerjee, and A. Nagarajan. What test oracle should I use for effective GUI testing? In Proceedings of 18th IEEE International Conference on Automated Software Engineering, pages 164–173, 2003. [12] J. D. Reese and N. G. Leveson. Software deviation analysis. In Proceedings of the 19th International Conference on Software Engineering, pages 250–260, 1997. [13] S. P. Reiss and M. Renieris. Encoding program executions. In Proceedings of the 23rd International Conference on Software Engineering, pages 221–230, 2001. [14] T. Reps, T. Ball, M. Das, and J. Larus. The use of program profiling for software maintenance with applications to the year 2000 problem. In Proceedings of the 6th ESEC/FSE, pages 432–449, 1997. [15] D. S. Rosenblum. Towards a method of programming with assertions. In Proceedings of the 14th International Conference on Software Engineering, pages 92–104, 1992. [16] G. Rothermel and M. J. Harrold. A safe, efficient regression test selection technique. ACM Trans. Softw. Eng. Methodol., 6(2):173–210, 1997. [17] M. C. Thompson, D. J. Richardson, and L. A. Clarke. An information flow model of fault detection. In Proceedings of the International Symposium on Software Testing and Analysis, pages 182–192, 1993. [18] J. M. Voas. PIE: A dynamic failure-based technique. IEEE Transactions on Software Engineering, 18(8):717– 727, 1992. [19] T. Xie, D. Marinov, and D. Notkin. Rostra: A framework for detecting redundant object-oriented unit tests. In Proceedings of 19th IEEE International Conference on Automated Software Engineering, 2004. [20] A. Zeller. Yesterday, my program worked. Today, it does not. Why? In Proceedings of the 7th ESEC/FSE, pages 253–267, 1999. [21] A. Zeller. Isolating cause-effect chains from computer programs. In Proceedings of the 10th ACM SIGSOFT Symposium on Foundations of Software Engineering, pages 1–10, 2002.
We have developed a new class of program spectra called value spectra, which enrich the existing program spectra family. We exploit value spectra differences between an old version and a new version in regression testing. We use these value spectra differences to expose internal behavior deviations inside the black box. We also investigate deviation propagation and develop two heuristics to locate deviation roots. If there are regression faults, our deviation-root localization additionally addresses the regression fault localization problem. We have conducted an experiment on seven C program subjects. The experimental results show that our new approach can effectively detect behavior deviations even before deviations are (or even if they are not) propagated to outputs. The results also show that our deviation-root localization can accurately locate the deviation roots for most subjects.
Acknowledgments We thank Michael Ernst, the Daikon project members at MIT, Mary Jean Harrold, and Gregg Rothermel for helping with experiment instrumentation. We thank Miryung Kim, Andrew Peterson, Vibha Sazawal, and the anonymous reviewers for their valuable feedback on an earlier version of this paper. This work was supported in part by the National Science Foundation under grant ITR 0086003. We acknowledge support through the High Dependability Computing Program from NASA Ames cooperative agreement NCC2-1298.
References [1] D. Abramson, I. Foster, J. Michalakes, and R. Socic. Relative debugging: a new methodology for debugging scientific applications. Communications of the ACM, 39(11):69–77, 1996. [2] D. M. Andrews. Using executable assertions for testing and fault tolerance. In Proceedings of the 9th International Symposium on Fault-Tolerant Computing, pages 102–105, 1979. [3] T. Ball and J. R. Larus. Efficient path profiling. In Proceedings of the 29th ACM/IEEE International Symposium on Microarchitecture, pages 46–57, 1996. [4] M. D. Ernst, J. Cockrell, W. G. Griswold, and D. Notkin. Dynamically discovering likely program invariants to support program evolution. IEEE Trans. Softw. Eng., 27(2):99–123, 2001. [5] GNU. GNU diffutils. http://www.gnu.org/ software/diffutils/, 2002. [6] S. Hangal and M. S. Lam. Tracking down software bugs using automatic anomaly detection. In Proceedings of the 24th International Conference on Software Engineering, pages 291–301, 2002.
37