Jul 20, 1999 - during the Pacific Exploratory Mission-Tropics A. (PEM-Tropics ... dashed lines at 1000 hPa, while the subtropical anticyclones are denoted "A." ...
JOURNAL OF GEOPHYSICAL
RESEARCH, VOL. 104, NO. D13, PAGES 16,181-16,196, JULY 20, 1999
Chemical characteristics of air from differing source regions during the Pacific Exploratory Mission-Tropics A (PEM-Tropics A) Ashley S. Board,• Henry E. Fuelberg,1 Gerald L. Gregory,2 Brian G. Heikes,3 Martin G. Schultz,4 Donald R. Blake? Jack E. Dibb, 6 Scott T. Sandholm,7 and Robert W. Talbot 6 Abstract. Ten-day backwardtrajectoriesare usedto determinethe originsof air parcels arrivingat airborneDC-8 chemicalmeasurementsitesduringNASA's PacificExploratory Mission-TropicsA (PEM-T) that was conductedduringAugust-October1996.Those sites at which the air had a commongeographicalorigin and transporthistoryare grouped together,and statisticalmeasuresof chemicalcharacteristics are computed.Temporal changesin potentialtemperatureare usedto determinewhether trajectoriesexperiencea significantconvectiveinfluenceduring the 10-dayperiod. Those trajectoriesthat do not experiencea significantconvectiveinfluenceare dividedinto four geographicalcategories dependingon their originsand paths.Air parcelsoriginatingover Africa and South America are characterizedby enhancedmixing ratios of 03, CO, HNO3, and PAN. The backwardtrajectoriestravel at high altitudes(--•10-11 km), coveringlong distancesdue to strongupper-tropospheric westerlywinds.The observedenhancementof combustionrelated speciesis attributedto biomassburningfrom distantsourcesto the west, extending even to SouthAmerica. The relativelylarge value of Be-7 probablyis due either to less efficientremoval of aerosolsfrom upper troposphericair or to small stratospheric contributions.Aged marine parcelsare found to have relativelysmall concentrationsof burning-relatedspecies.Although thesetrajectoriesarrive at a wide range of aircraft altitudes,they do not passover a land massduring the preceding10-dayperiod. Air passingover Australiabut no other land massexhibitsa combustionsignature;however, photochemicalproductspeciessuchas 03 and PAN are lessenhancedthan in the longrange transportcategory.These trajectoriestravel shorterdistancesand are at lower altitudes(--•5-8 km) than thosereachingAfrica and/or SouthAmerica. The combustion influenceon theseparcelsis attributedto biomassburningemissionsinjectedover Australia. That burningis lesswidespreadthan in Africa and SouthAmerica. Finally, trajectoriesoriginatingover SoutheastAsia appear to receive a weak combustion influence.However, comparedto Africa and South America, SoutheastAsia has a relativelysmallincidenceof biomassburning.There is little combustioninput from Australia due to the high transportaltitudescomparedto the lower heightsof the convection.The SoutheastAsian parcelsexhibitthe greatestNOx to •NO/ratio of any category,perhapsdue to lightning.Parcelsexperiencinga significantconvectiveinfluence also are examined.Most of theseparcelspassthroughwidespread,persistentconvection alongeither the South PacificConvergenceZone or Intertropical ConvergenceZone approximately5 daysprior to arrivingat the aircraft locations.Thus the categorymostly representsmarine convection.Mixing ratios of peroxidesand acidsin the convective categoryare found to be smallerthan in parcelsnot experiencingconvection.Small mixing ratios of Be-7 and Pb-210 suggestparticle removalby precipitation.
•Department of Meteorology, FloridaStateUniversity, Tallahassee. 2NASALangleyResearch Center,Hampton,Virginia. 3Graduate Schoolof Oceanography, University of RhodeIsland,Narragansett. 4Department of EarthandPlanetary Sciences, HarvardUniversity, Cambridge, Massachusetts. SDepartment of Chemistry, University of California,Irvine. 6Institute for theStudyof Earth,Oceans, andSpace,University of NewHampshire, Durham. ?Department of EarthandAtmospheric Sciences, GeorgiaInstituteof Technology, Atlanta. Copyright1999 by the American GeophysicalUnion. Paper number 1999JD900021. 0148-0227/99/1999JD900021 $09.00
16,181
16,182
BOARD
ET AL.: CHEMICAL
CHARACTERISTICS
½1)
40 o
-2o -40 -60 i
i
-8060 801O0120140160180-160-140-120-1 O0-80-60-40 b) 2O 0 -20 -40 -60
-80
80 1 O0 120 140 160 180-160-140-120-1
O0 -80
-60
-40
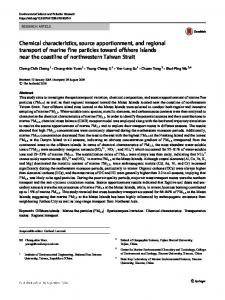
Figure 1. Schematic showing mean streamlines during PEM-T (August 14 to October 6, 1996) for (a) 1000 and (b) 500 hPa. Locationsof the ITCZ and SPCZ are indicated by dashedlinesat 1000hPa,while the subtropicalanticyclones are denoted "A." At 500 hPa, anticycloniccirculationcentersare indicatedas A, while ridge lines are dashed.
1.
Introduction
Relationshipsbetween the originsof troposphericair parcels,their transporthistories,and their chemicalcharacteristics often are not well known. This is especiallytrue for remote regionsof the world where both meteorologicaland chemical data are limited and where the transport time from source regionsis many days.The southernPacific Ocean Basin, the focusof NASA's PacificExploratoryMission-TropicsA (PEMT), is such a region. Hoell et al. [1999] provide a complete descriptionof PEM-T. It was conductedfrom August 14 to October6, 1996, duringthe southernhemisphericdry season, usingtwo NASA aircraft, the DC-8 and P-3B. Fuelberget al. [1999] give a detailed discussion of meteorologicalconditionsthat were importantto long-rangetransport during the PEM-T period. Therefore only major featuresare repeated here. At 1000 hPa (Figure la), subtropicalanticyclones dominated
(18øS,150øW). The ITCZ and westernmostportion of the SPCZ mergedinto one convergenceline near the Philippines. Mean middletroposphericflow patterns(500 hPa, -5.5 km mean sea level (msl), Figure lb) includedseveralsubtropical anticyclones near 30øN and 15øS.Ridge axesextendingwesteast from these centersencompassed nearly the entire North and South Pacific Basins.The ridge lines and anticyclones producedwesterlywinds north of -30øN and south of -15øS, that is, the prevailingwesterlies.However, the tropical latitudesin betweenwere dominatedby easterlywinds.Flow patternswere similarat 300 hPa (-9 km, not shown).The southern subtropicaljet streamwas located near 30øS,exhibiting only smallday-to-daychangesin intensityand location.Max-
imummeanwindspeeds>40 m s-• werelocatedoversouth-
4O
60
OF AIR
both the North
and South Pacific
Oceans
(denoted"A"). These anticyclonicregionsgenerallywere devoid of clouds,containingtemperatureinversionsin the lower tropospherebecauseof their subsidingmotion. The resulting southeasterlyand northeasterlytrade winds in the tropical southernand northern hemispheres,respectively,producedan area of low-levelconvergence near 10øN,that is, the Intertropical ConvergenceZone (ITCZ). Ascendingmotion along the ITCZ producedwidespreadcloudsand convectiveprecipitation. Similarly,the South PacificConvergenceZone (SPCZ) [Vincent,1994]wasa regionof ascending motionand extensive cloudinessand precipitation.The SPCZ extendedsoutheastward from the western portion of the ITCZ to near Tahiti
westernAustralia.The polar jet streamexhibitedlarge day-today variabilityin both speedand location. Meteorologicalconditionsgreatlyinfluencethe transportof by-productsfrom regionsof biomassburning.Major areasof biomassburning over southernAfrica, South America, Australia, and Indonesiaduring austral springhave been documentedby Hao and Liu [1994],Hurst et al. [1996],Elvidgeand Baugh[1996],Fishmanet al. [1996],andOlsonet al. [1999].The burningover southernAfrica and SouthAmerica generallyis much greater than over Australia and Indonesia(European Space Agency, Global Fire Atlas, 1998, available at http:// sharkl.esrin.esa.it/FIRE/fire.html). Air frequentlyrecirculates over the burningregionsof southernAfrica before leavingthe eastern African coast and traveling into the Indian Ocean [Garstang et al., 1996;Tysonetal., 1996].Thompson etal. [1996] alsoconcludedthat air frequentlyis transportedeastwardfrom Africa
into the Indian
Ocean.
This air can reach the South
Pacific Basin, the region of PEM-T [Fuelberget al., 1999; Schultzet al., 1999; Vay et al., 1999], therebyincreasingtrace gasconcentrations in the region.Schultzetal. [1999]noted that a significantincreasein troposphericO3 over the tropical SouthPacificOceanresultedfrom biomassburningoverBrazil and southern
Africa.
By-productsof biomassburningcanbe transportedaloft by deep convection[Pickeringet al., 1990, 1991, 1992, 1996].Detaileddiscussions of thisprocessalsoare providedby Chatfield and Delany[1990]andScalaet al. [1990].Oncecarriedaloft by convection,the burningby-productscanbe transportedquickly to distantlocationsby the relativelystrongupper-tropospheric winds.
Concentrationsand lifetimesof mostchemicalspeciesin the atmosphereare affectedby (1) the locationwheresourceemissionsare injected(i.e., transporttime to the regionof study), (2) the mechanismof injection(i.e., injectedasfreshemissions at high,dry transportaltitudesor injectedat low altitudesand then transportedaloft), and (3) the surroundingenvironment (particularlytemperature,moisture,andsolarconditions)during transport. For example, in the marine boundary layer (MBL), the lifetime of O_•is only 2-5 days [Fishmanet al., 1991],whereasit increasesto -90 daysin the middle tropospherewhere the air is drier. Thus dry air aloft, often associated with large-scalesubsidence,helps maintain continental pollutionplumesfor long periodsof time. Consequently,longrangetransportof theseplumesis possibleif the pollutantsrise out of the boundarylayer and into the middle or upper tropospherewhere there is relativelydry air and strongwind speeds [Krishnamuftiet al., 1993]. The objective of this paper is to investigaterelations between the originsof air parcels,their transporthistories,and
BOARD ET AL.' CHEMICAL
their chemicalcharacteristicsduring the PEM-T period. We examine 14 DC-8 flights that traversedthe southernhemispherenorth of 35øS(Figure 2). Hoell et al. [1999] describe these flights in detail. Each flight ranged from 8-10 hours duration at altitudesfrom 0.2-12 km. They traversedan area
CHARACTERISTICS
OF AIR
16,183
o)
-40
from near Easter Island west to the Solomon Islands, and from
Hawaii southto New Zealand. We use 10-daybackwardtra-80 -40 0 40 80 120 160 -160 -120 -80 jectoriesto determinethe originsof air parcels.Parcelshaving commonoriginsand transporthistoriesare groupedtogether, b) and their chemicalcharacteristics measuredby the DC-8 are evaluated.Thisprocedureis the reverseof usingtrajectoriesto determinethe originsof air parcelshavinga particularchemical signature.Althoughall chemicalspeciesmeasuredaboard the DC-8 were considered,we will focuson speciesthat are mostimportantto the givengeographicalcategories.Previous studiesthat have used somewhatsimilar approachesinclude -80 -40 0 40 80 120 160-160-120 -80 Gregoryet al. [1996, 1999] and Talbotet al. [1994, 1996a,b, Figure 2. (a) Sourceregionsof trajectoryclustersin the non19971. convectivecategories:(1) aged marine, (2) long-range,(3) Australia,(4) Australia/Southeast Asia, and (5) not classified. (b) Sourceregionsof trajectoryclustersin the convectivecat2. Data and Methodology .egory:(6) ITCZ and (7) SPCZ. Flight tracksfor the DC-8 2.1. Meteorological Data during PEM-T that were usedin the current studyare superThe global griddedmeteorologicaldata used for this re- imposed.Only thoseflight segmentsnorth of 35øSwere invessearchwere preparedby the EuropeanCentre for Medium- tigated. RangeWeatherForecasting (ECMWF) [Bengtsson, 1985;Hollingsworthet al., 1986].The variousmeteorologicalparameters were availabletwicedaily(0000and 1200UTC) at a horizontal Arrival locationsof our 10-daybackwardtrajectorieswere resolutionof 2.5ølongitudeby 2.5ølatitudeat 13 isobariclevels chosenalong the flight tracks(Figure 2) at intervalsof 2.5ø. (1000, 925, 850, 700, 500, 400, 300, 250, 200, 150, 100,70, and Additional trajectorieswere calculatedin areasof significant 50 hPa). Our computationaldomain was 75øSto 25øN and aircraftaltitudechange(> 1000feet). Arrival timeswere either 75øW westward to 60øW. 0000 or 1200 UTC on each flight day, that is, the time closest Kinematicbackwardtrajectoryanalysiswasemployedto de- to the flight. Sincethe reliability of individualtrajectoriesis terminelikelysourceregionsand transportpathsof air parcels affected by the erroneousplacementof meteorologicalfeasampledduringthe PEM-T flights.The kinematicschemeuses tures and by horizontaland verticalwind shear,we employed only the horizontaland verticalwind componentsto track air a "clusteringtechnique"[e.g.,Merrillet al., 1985;Fuelbergetal., parcels[Draxler,1991;Dory and Perkey,1993;Krishnamurtiet 1996a]. That is, at each trajectoryarrival location along the al., 1993;Garstanget al., 1996].There are no "explicitassump- flight track, we superimposed a 4ø x 4ø squareto createfour tions"aboutthe flowfield, for example,the isentropicassump- additional arrival points. Thus each cluster consistedof five tion. Additionaldetailsaboutthe trajectorymodelare givenby trajectories,one at the centerof the square(the originalflight Fuelberget al. [1999].Kinematictrajectoriesare comparedwith track point) and four new pointsat the corners.We did not their isentropiccounterparts by Fuelberget al. [1996b]. considerflight locationswithin the MBL becausebackward All trajectoriesare subjectto limitationsdue to data avail- trajectoriesarrivingat suchlow altitudesgenerallyterminateat ability and numericalprocedures.The relativelycoarsespatial the surfacebefore the end of 10 days. and temporalresolutionof the ECMWF data doesnot resolve small, short-livedmesoscalephenomena.For example,winds 2.2. Data Groups associated with individual convective elements are not adeA seriesof testsassessed the reliability of the trajectories, quatelyresolved,althoughcompositeeffectsof the convective that is, whether they could be used confidentlyto describe elements are included. In addition, sincethe Pacific Basin is a originsof the variouschemicalsamples.The first test considrelativelydata sparseregion,meteorologicalfeaturesare less ered horizontalwind shear. Specifically,at least three of the accuratelyplacedthan over data rich areas.Althoughthe EC- five trajectoriescomprisinga clusterwere requiredto have a MWF vertical motions needed to calculate our kinematic traconsistentgeographicalorigin. That is, at least three trajectojectoriesprobablyare the leastreliableof the variousmeteo- riesmusthaveoriginatedwithin one of the five regionsthat are rological parameters,all of the parametersare dynamically shownin Figure 2a and describedin later paragraphs.If this consistent with eachother. In addition,Stohlet al. [1995]have requirementwasnot met, the point wasexcludedfrom further notedthat the temporal,horizontal,andverticalinterpolations consideration. Test two wasusedto distinguishbetweentwo major categorequiredby the kinematicschemeare a sourceof uncertainty. These variousdata and numericallimitationsproducetrajec- riesof trajectories:nonconvective and convective.For the nontorieswhoseaccuracydeteriorateswith increasingtime. None- convectivecategory,at least three of five trajectoriespassing theless,both kinematic and isentropictrajectoriesof 7 days the commonorigin test had to experiencechangesin potential durationor longerare relativelycommonin the literature,for temperature(theta) 10øC changein theta within a 24-hour period. In addition,of those that experiencedthe > 10øCtheta change,at leastthree must havepassedthroughextensivesatellite-observed convectionon the day that the large diabaticchangeoccurred. The final checkrequired trajectoriesto remain within the data domain for at least 5 days.Those traveling outsidethe domain between days 5 and 10 were retained only if their geographicalcategoryat that time was clearly known. This situationusuallyoccurredwhen parcelsreachedthe western border of the domain(60øW,near SouthAmerica) between days5 and 10. Upon completingthesechecks,the remainingclustershad at least three out of five trajectoriesthat passedboth the theta and geographicalorigin testsand did not terminate within 5 daysof arriving at the flight track. A total of 133 out of the original367 clustersarrivingbetween0ø and 35øSremainedin the nonconvection category.Similarly,the convectivecategory consistedof 18 clusters.Although this is a major reductionin sample size, we believe these trajectoriescan be used with confidenceto determinethe originsof air parcelssampledby the DC-8. The representativeness of this final data set is described in section 2.3.
Trajectory clusterspassingthe quality control tests were classifiedaccordingto their sourceregionand transportpath. We used four categoriesfor clustersnot encounteringwidespread,significantconvection,and two categoriesfor clusters that did experiencesuchconvection(Figure2). The agedmarine trajectories(labeled1 in Figure 2a) originatedover the PacificOcean and remainedoverwater (eastof 40øE)during the entire 10-day calculationperiod. Long-rangetrajectories (labeled2) originatedwest of 40øEand trackedeastwardtoward the PacificBasin.Most of thesetrajectoriestraveledover southern Africa and/or South America. The Australian cate-
gory(labeled3) includestrajectories,whichtraveledoverAustralia duringthe 10-dayperiod. However, they did not travel over any other land massand did not extendwestof 65øE.The fourth category representstrajectorieswhich traveled over SoutheastAsia beforepassingoverAustraliaand then into the Pacific Basin. Trajectories originatingin region 5 were not classified so there would be a clear distinction
between
cate-
gories2 and 3.
The convectivegroup consistedof two categories(Figure 2b), one representingparcelsexperiencingextensiveconvection near the ITCZ (labeled 6), and the other for parcels influenced bywidespread convection nearthe SPCZ (labeled7). 2.3.
Chemical
Our chemical
Data
data set links the measured
chemical
data with
the kinematicbackwardtrajectories.It was preparedat Harvard University from archived files submittedby the DC-8 principalinvestigators to the PEM-T projectoffice.Thesearchived files are public domain at the web site http://wwwgte'larc'nasa'gøv'The archivedfiles identify the responsible investigator,the instrumentaltechnique,and the instrument performancecharacteristics. Specifically,the merged data set was a 5 min averageof the chemicaldata centered on each trajectoryarrivallocationalongthe flight track.As noted earlier, most of these locations were at intervals of 2.5ø. In some
cases,averageslessthan 5 min were required to avoid time overlaps.When a chemicalmeasurementwas below the level
CHARACTERISTICS
OF AIR
of detection(LOD, valuesofHoelletal. [1999]),we substituted that value for the measured one. LOD values are underlined in
the tables of chemicalconcentrations that follow to identify their contributionsto the analyses. Table 1 describesthe representativeness of our data set as a functionof altitude. Specifically,the valuesfrom Schultzet al. [1999] are mediansof all PEM-T measurementsbetween0ø and 35øS.Exceptfor the lessfrequenthydrocarbonsamples, thesevalueswere obtainedfrom a mergeddata set at 1 min intervals.The other two columnsin eachaltituderangedenote mediansfor our original367 trajectorylocationsand final set of 133locations.As statedabove,thesevaluesrepresent5 min averagescentered at each trajectory location. The statistics show that most trajectoriespassingthe various checksdescribedearlier (Trj2) arrive at the flight tracksin the middle and upper troposphere.The correspondingchemical data closelyrepresentthe complete PEM-T population in most cases.
Various atmosphericchemicalspeciescan be usedto determine originsof air samplesand the influencesof atmospheric processes suchas convectionand mixing.In general,one must examinea numberof speciesin orderto representand understand the chemicalsignatureof troposphericair in remote regions.Suchair may have a mixedorigin and may have been processed,either photochemicallyor by mixing, at various times.Although we have examinedall speciesmeasuredonboardthe DC-8, the followingdiscussions are limited to those specieswhich we believe are most informativefor the issues being considered. Ozone concentrations[Gregoryet al., 1996, 1999; Talbotet al., 1994, 1996a,b, 1997]typicallyare greatestin stratosphericallyinfluencedair (> 120ppbv),are enhancedin plumesoriginatingfrom land sources(70-100 ppbv),are relativelysmall (40-60 ppbv)in cleanair, usuallyare smallin MBL air (20 to 30 ppbv), and can be very small (