Research Article
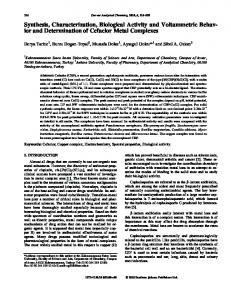
Chemoinformatic characterization of activity and selectivity switches of antiprotozoal compounds Background: Benzimidazole derivatives are promising compounds for the treatment of parasitic infections. The structure–activity relationships of 91 benzimidazoles with activity against Trichomonas vaginalis and Giardia intestinalis were analyzed using a novel activity landscape modeling approach. Results: We identified two prominent cases of ‘activity switches’ and ‘selectivity switches’ where two R group substitutions in the benzimidazole scaffold completely invert the activity and selectivity pattern for T. vaginalis and G. intestinalis. Conclusion: A chemoinformatic methodology was used to rapidly identify discrete structural changes around the central scaffold that are associated with large changes in biological activity for each parasite. The structure–activity relationships for the benzimidazole derivatives is smooth for both protozoan with few but markedly important activity cliffs. Systematic exploration of structure–activity relationships (SAR) of large data sets frequently require the application of computational approaches. Quantification of activity and selectivity cliffs has been the subject of methodology development for activity landscape modeling [1–3] . Most of the activity landscape methods developed so far use fingerprint-based representations calculated from whole molecular structures. Some substructurebased representations have been explored for multitarget activity landscapes, for example using matched molecular pairs [4] . Recently, we proposed a simple but powerful approach to characterize the SAR of an analog series by conducting a systematic pairwise comparison of the R groups of all molecular pairs in a data set tested across two biological endpoints [5] . This approach facilitates the rapid identification of opposing changes in activity due to specific changes in structure. The method is an extension of dual-activity difference (DAD) maps that were designed to explore the SAR of diverse data sets with activity against two targets [6,7] . Analog series of benzimidazole derivatives play a central role in the optimization of antiparasitic agents [8] . Synthesis and biological testing of several series over the years have led to the improvement of the antiparasitic spectrum of activity [9–16] . Previous studies suggest that substitutions at positions 1, 2, 5 and 6 of the benzimidazole ring are sensitive to changes in antiparasitic activity (Figure 1) . In addition,
some benzimidazole derivatives have shown activity against more than one parasite, especially those with halogen moieties, demonstrating a broader potential use against protozoal infections. Herein, we assembled a large compound set of 91 benzimidazole derivatives synthesized in different series over the last 11 years (Figure 1) and tested against Trichomonas vaginalis and Giardia intestinalis. All compounds have been evaluated by the Yépez-Mulia group and most of them have been synthesized in-house [9–16] . The series of benzimidazoles summarized in F igure 1 are part of a continued effort to understand the structural requirements for antiprotozoal activity against the intestinal protozoan (G. intestinalis) and urogenital tract parasite (T. vaginalis). In this work, the 91 compounds were subject to an initial SAR exploration using activity landscape modeling with a systematic pairwise comparison of the R groups of all molecular pairs. This intuitive method compares systematic changes in the substitutions of the analog series and, subsequently, finds the associations between those changes and the response in biological activity. As described below, a subset of benzimidazole derivatives was previously analyzed using fingerprint-based approaches. The SAR presented in this work constitutes a step further toward the design and optimization of new, more selective benzimidazole derivatives with antiprotozoa activity.
Rodrigo Aguayo-Ortiz1, Jaime Pérez-Villanueva2 , Alicia Hernández-Campos1, Rafael Castillo1, Nathalie Meurice3 & José L Medina-Franco*3
10.4155/FMC.13.173 © 2013 Future Science Ltd
Future Med. Chem. (2013) 6(3), 1–14
ISSN 1756-8919
1 Facultad de Química, Departamento de Farmacia, Universidad Nacional Autónoma de México, México, DF 04510, Mexico 2 Departamento de Sistemas Biológicos, División de Ciencias Biológicas y de la Salud, UAM-X México, DF 04960, Mexico 3 Mayo Clinic, Scottsdale, Arizona, AZ 85259, USA *Author for correspondence: Tel.: +1 480 301 4773 Fax: +1 480 301 9162 E-mail:
[email protected]
1
Research Article | Aguayo-Ortiz, Pérez-Villanueva, Hernandez-Campos et al. Key Terms
Methods set In this work, we extended our previous SAR ana lysis of benzimidazole derivatives using a larger set of 91 compounds summarized in Figure 1 [6] . The chemical structures and potency are presented in Table 1. Each molecule in the set has reported half maximal inhibitory concentrations (IC50) that were obtained from in vitro susceptibility assays for G. intestinalis and T. vaginalis [9–16] . The 91 compounds were purified and tested by the Yépez-Mulia group of under similar conditions. The initial IC50 values (in µM) were converted to pIC50 (-logIC50) values.
Data
Multitarget activity landscapes: Chemical space
of a set of compounds annotated with biological activity for two or more biological endpoints.
Dual-activity difference map: Plot of activity difference
for two targets. The distribution of the data points is independent of the molecular similarity. Dual-activity difference map identifies dualtarget cliffs with inverse and direct structure-activity relationships and ‘selectivity switches’.
DAD
The SAR of data sets tested with two biological end points can be characterized using pairwise comparisons portrayed in DAD maps. As we have described before, given a set of N compounds tested with targets I and II [6,7,17,18] , the DAD map depicts N(N-1)/2 pairwise potency differences for each possible pair in the data set against both targets. The potency differences for target T for each molecular pair are calculated with the expression: DpIC50 (T) i,j = pIC50 (T) i - pIC50 (T) j Equation 1
where pIC50 (T) i and pIC50 (T) j are the activities of the ith and jth molecules (j>i) against the two targets and T represents T. vaginalis or
H F Cl Br CF3 CN NO2 OCH3 OCHF2 SCH2CH2CH3 COC6H5 2,3-Cl2C6H3O C10H7O COOCH3 OCH2CH3
H, Cl, Br R3 R4
N R2 N
R5 R6 H, Br
R1 H, CH3
CF3 CF2CF3 CONH2 CONHCH3 CONH(CH3)2 COOCH2CH3 CH(OH)CH3 COCF3 NHCOOCH3 SCH2CH2OH SCH2CH2N(CH3)2 SCH2CH2N(C2H5)2 SCH2CH2CH2N(CH3)2 SCH2CH2(N-piperidyl) SCH2CH2(N-morpholinyl) SCH2CH2(p-nitrophenyl) SCH2CH2(1H-imidazolyl) SOCH2-(4-methoxy-3,5-dimethylpyridin-2-yl) SOCH2-(4-[3-mthoxypropoxy]-3-methylpyridin-2-yl) SOCH2-(3,4-dimethoxypyridin-2-yl)
Figure 1. Core scaffold of the 91 benzimidazoles analyzed in this work and the substituents that have been used in the synthesis of benzimidazole derivatives. The chemical structures of the 91 compounds are shown in Table 1. Data taken from [9–16] .
2
Future Med. Chem. (2013) 6(3)
G. intestinalis. It is worth noting that DpIC50 can have positive or negative values providing information about the directionality of the SAR. Therefore, DAD maps are able to differentiate pairs of molecules where the structural change increases the activity for one target but decreases the activity for the other [7] . A generic DAD map is illustrated in Figure 2 . Vertical and horizontal lines at DpIC50 ± t define boundaries for low/high potency difference for targets I and II, respectively. Here, we set t = 1, one log unit or a tenfold activity change, so that data points be considered with low potency difference if -1 ≤ DpIC50 ≤ 1 for each target. The boundaries define zones Z1–Z5 in Figure 2 . Structural modifications for molecule pairs that fall into zone Z1 (small or a large structural change) have a similar impact on the activity against the two targets (increase or decrease in activity). Therefore, Z1 is associated with similar SAR of the pair of compounds for both targets. In sharp contrast, pairs of compounds that fall into Z2 indicate that the change in activity for the compounds in the pair is opposite for I and II. Thus, the structural changes in the pair of compounds in Z2 are associated with an inverse SAR or switch-in activity [3,5] , for example, increases the activity for one target but decreases the activity for the other target. Data points in Z3 and Z4 correspond to pairs of molecules with the same or similar activity for one target (I or II, respectively), but different activity for the other target (II or I, respectively). Data points in Z5 demonstate a pair of compounds with similar activity (or identical if D activity = 0 for both targets) against I and II. In other words, structural changes in the pairs of compounds in Z5 have little or no impact on the activity against the two targets. As previously noted, the classification of data points in an DAD map is independent of the structure similarity [5–7,17,18] . All graphic figures in this work were prepared using Tableau Public [101] . Pairwise comparison of the R group substitutions Since DAD maps are based on pairwise comparisons, it is feasible to incorporate pairwise structure relationships by distinguishing each molecular pair by the number of substitutions around the core scaffold in Figure 1. Similar to our previous work, the number of different R groups for each pair of compounds was determined by comparing the text strings of the chemical names of the substituents in Table 1 (one to six) [5] . future science group
Chemoinformatic characterization of activity & selectivity switches
| Research Article
Table 1. Chemical structures of the benzimidazoles used in this study, as well as biological activity against Trichomonas vaginalis and Giardia intestinalis. R3 R4
N R2 N
R5 R6
Number
R1
Benzimidazole substitution
pIC50
Ref.
R1
R2
R3
R4
R5
R6
Tv
Gi
1
H
CF3
H
H
H
H
5.50
6.97
[9]
2
CH3
CF3
H
CF3
H
H
5.39
5.94
[9]
3
CH3
CF3
H
H
CF3
H
5.27
5.05
[9]
4
CH3
CF3
H
Propylthio
H
H
6.70
4.98
[10]
5
CH3
CF3
H
H
Propylthio
H
5.59
5.85
[10]
6
CH3
CF3
H
Benzoyl
H
H
4.53
5.96
[10]
7
CH3
CF3
H
H
Benzoyl
H
4.97
5.89
[10]
8
H
CF3
H
Cl
H
H
6.35
5.89
[9]
9
H
CF3
H
F
H
H
5.50
6.31
[9]
10
H
CF3
H
CF3
H
H
6.63
6.17
[9]
11
H
CF3
H
CN
H
H
5.64
5.75
[9]
12
H
CF3
H
Propylthio
H
H
6.46
5.82
[10]
13
H
CF3
H
Benzoyl
H
H
4.55
5.64
[10]
14
H
CF3
H
Br
H
H
5.80
6.19
[11]
15
H
CF3
Br
H
Br
H
6.72
6.60
[11]
16
H
CF3
Br
Br
Br
H
6.57
6.85
[11]
17
H
CF3
H
Br
Br
H
6.66
6.92
[11]
18
H
CF3
Br
Br
Br
Br
8.70
7.25
[11]
19
H
CF3
H
NO2
NO2
H
6.24
6.62
[11]
20
H
C2F5
H
Cl
Cl
H
6.52
6.25
[11]
21
H
C2F5
Br
Br
Br
Br
5.00
7.64
[11]
22
H
CF3
H
2,3-Cl2C6H3O
H
H
6.27
7.27
[15]
23
CH3
CF3
H
2,3-Cl2C6H3O
H
H
7.80
7.52
[15]
24
CH3
CF3
H
H
2,3-Cl2C6H3O
H
6.96
7.20
[15]
25
H
CF3
H
C10H7O
Cl
H
7.07
8.30
[15]
26
CH3
CF3
H
C10H7O
Cl
H
6.01
7.64
[15]
27
CH3
CF3
H
Cl
C10H7O
H
6.35
7.92
[15]
28
H
CF3
H
Cl
Cl
H
6.63
7.11
[15]
29
CH3
CF3
H
Cl
H
H
6.62
7.38
[15]
30
CH3
CONH2
H
H
Cl
H
6.96
7.12
[12]
31
CH3
CONHCH3
H
H
Cl
H
6.98
7.15
[12]
32
CH3
CON(CH3)2
H
H
Cl
H
6.62
7.40
[12]
33
CH3
COOCH2CH3
H
H
Cl
H
7.72
7.32
[12]
34
CH3
CH(OH)CH3
H
H
Cl
H
6.96
7.15
[12]
35
CH3
COCH3
H
H
Cl
H
6.64
7.17
[12]
36
CH3
CONH2
H
Cl
H
H
6.73
6.63
[12]
37
CH3
CONHCH3
H
Cl
H
H
6.45
6.45
[12]
38
CH3
CON(CH3)2
H
Cl
H
H
6.68
6.61
[12]
39
CH3
COOCH2CH3
H
Cl
H
H
7.57
7.40
[12]
future science group
www.future-science.com
3
Research Article | Aguayo-Ortiz, Pérez-Villanueva, Hernandez-Campos et al. Table 1. Chemical structures of the benzimidazoles used in this study, as well as biological activity against Trichomonas vaginalis and Giardia intestinalis (cont.). R3 R4
N R2 N
R5
R1
R6
Number
Benzimidazole substitution
pIC50
Ref.
R1
R2
R3
R4
R5
R6
Tv
Gi
40
CH3
CH(OH)CH3
H
Cl
H
H
7.02
7.42
[12]
41
CH3
COCH3
H
Cl
H
H
6.88
7.30
[12]
42
CH3
CONH2
H
Cl
Cl
H
6.87
6.34
[12]
42
CH3
CONHCH3
H
Cl
Cl
H
6.65
6.82
[12]
44
CH3
CON(CH3)2
H
Cl
Cl
H
7.12
7.13
[12]
45
CH3
COOCH2CH3
H
Cl
Cl
H
7.53
7.56
[12]
46
CH3
CH(OH)CH3
H
Cl
Cl
H
7.39
7.69
[12]
47
CH3
COCH3
H
Cl
Cl
H
7.20
7.46
[12]
48
CH3
CONH2
H
H
H
H
6.78
7.03
[12]
49
CH3
CONHCH3
H
H
H
H
6.98
7.22
[12]
50
CH3
CON(CH3)2
H
H
H
H
6.37
6.29
[12]
51
CH3
COOCH2CH3
H
H
H
H
7.07
7.16
[12]
52
CH3
CH(OH)CH3
H
H
H
H
6.78
7.17
[12]
53
CH3
COCH3
H
H
H
H
6.68
7.06
[12]
54
H
SCH2CH2OH
Cl
H
Cl
H
6.16
7.42
[13]
55
H
SCH2CH2OH
Br
H
Br
H
6.83
6.98
[13]
56
H
SCH2CH2N(CH3)2
Cl
H
Cl
H
7.14
7.68
[13]
57
H
SCH2CH2N(CH3)2
Br
H
Br
H
6.51
7.54
[13]
58
H
SCH2CH2N(C2H5)2
Cl
H
Cl
H
7.39
7.72
[13]
59
H
SCH2CH2N(C2H5)2
Br
H
Br
H
7.53
7.46
[13]
60
H
SCH2CH2CH2N(CH3)2
Cl
H
Cl
H
7.07
7.14
[13]
61
H
SCH2CH2CH2N(CH3)2
Br
H
Br
H
7.99
7.69
[13]
62
H
SCH2CH2-(N-piperidyl)
Cl
H
Cl
H
7.14
7.26
[13]
63
H
SCH2CH2-(N-piperidyl)
Br
H
Br
H
7.69
6.90
[13]
64
H
SCH2CH2-(N-morpholinyl)
Cl
H
Cl
H
7.29
7.41
[13]
65
H
SCH2CH2-(N-morpholinyl)
Br
H
Br
H
7.23
7.23
[13]
66
H
SCH2CH2-(p-nitrophenyl)
Cl
H
Cl
H
7.96
7.09
[13]
67
H
SCH2CH2-(p-nitrophenyl)
Br
H
Br
H
8.48
7.43
[13]
68
H
SCH2CH2-(1H-imidazol-1-yl)
H
H
H
H
6.75
6.93
[16]
69
H
SCH2CH2-(1H-imidazol-1-yl)
H
Cl
H
H
6.77
7.09
[16]
70
H
SCH2CH2-(1H-imidazol-1-yl)
H
Cl
Cl
H
6.85
7.12
[16]
71
CH3
SCH2CH2-(1H-imidazol-1-yl)
H
H
H
H
6.83
7.06
[16]
72
CH3
SCH2CH2-(1H-imidazol-1-yl)
H
H
Cl
H
6.89
7.19
[16]
73
CH3
SCH2CH2-(1H-imidazol-1-yl)
H
Cl
H
H
6.87
7.18
[16]
74
CH3
SCH2CH2-(1H-imidazol-1-yl)
H
Cl
Cl
H
7.02
7.16
[16]
75
H
SCH2CH2-(1H-imidazol-1-yl)
H
COOCH3
H
H
6.96
7.11
[16]
76
H
SCH2CH2-(1H-imidazol-1-yl)
H
COOCH3
Cl
H
7.14
7.26
[16]
4
Future Med. Chem. (2013) 6(3)
future science group
Chemoinformatic characterization of activity & selectivity switches
| Research Article
Table 1. Chemical structures of the benzimidazoles used in this study, as well as biological activity against Trichomonas vaginalis and Giardia intestinalis (cont.). R3 R4
N R2 N
R5
R1
R6
Number
Benzimidazole substitution
pIC50
Ref.
R1
R2
R3
R4
R5
R6
Tv
Gi
77
CH3
SCH2CH2-(1H-imidazol-1-yl)
H
H
COOCH3
H
6.93
7.24
[16]
78
CH3
SCH2CH2-(1H-imidazol-1-yl)
H
Cl
COOCH3
H
7.06
7.25
[16]
79
CH3
SCH2CH2-(1H-imidazol-1-yl)
H
COOCH3
H
H
7.11
7.21
[16]
80
CH3
SCH2CH2-(1H-imidazol-1-yl)
H
COOCH3
Cl
H
7.03
7.35
[16]
81
H
SCH2CH2-(1H-imidazol-1-yl)
H
OCH2CH3
H
H
7.14
7.25
[16]
82
H
SCH2CH2-(1H-imidazol-1yl)
H
OCH2CH3
Cl
H
7.00
7.33
[16]
83
CH3
SCH2CH2-(1H-imidazol-1-yl)
H
H
OCH2CH3
H
7.14
7.34
[16]
84
CH3
SCH2CH2-(1H-imidazol-1-yl)
H
Cl
OCH2CH3
H
7.16
7.45
[16]
85
CH3
SCH2CH2-(1H-imidazol-1-yl)
H
OCH2CH3
H
H
7.12
8.08
[16]
86
CH3
SCH2CH2-(1H-imidazol-1yl)
H
OCH2CH3
Cl
H
7.01
7.68
[16]
87
H
SOCH2-(4-methoxy-3,5-dimethylpyridin-2-yl)
H
OCH3
H
H
6.92
7.02
[14]
88
H
H
H
H
H
6.91
7.14
[14]
89
H
H
H
H
H
6.98
7.74
[14]
90
H
SOCH2-[3-methyl-4-(2,2,2-trifluoroethoxy) pyridin-2-yl] SOCH2-[4-(3-methoxypropoxy)-3methylpyridin-2-yl] SOCH2-(3,4-dimethoxypyridin-2-yl)
H
OCHF2
H
H
7.12
7.80
[14]
91
H
NHCOOCH3
H
Propylthio
H
H
5.80
7.43
[14]
Analysis of the SAR was focused on data points in the DAD maps with one or two substitutions since these examples are straightforward to interpret from the experimental point of view. As noted above, distinguishing molecular pairs based on the different number of R groups around a core scaffold is a substructure-based approach to represent chemical structures. The substructure-based representation of compounds has been proposed in activity landscape studies to enhance interpretability of the SAR [4] and address the ‘facts versus artifacts’ issue of activity cliffs [19] . Fingerprint representations & structure similarity Although this work is focused on the analysis of the SAR based on different substituents, for comparison, we computed pairwise structural similarity values using the Tanimoto coefficient [20,21] with the following molecular fingerprint representations implemented in Molecular Operating Environment, version 2011.10 (Montreal, Canada) [22,102] : Molecular Access future science group
System (MACCS) keys (166-bits); pharmacophore atom triangle (piDAPH3); and typed graph distance (TGD). These three fingerprints were selected based on the results of a previous work with 32 compounds of this library [23] . In that study, the fingerprints were selected from 12 fingerprint-based structural representations based on the overall low linear correlation of the similarity values. MACCS keys used in this work are a predefined set of 166 structural keys; piDAPH3 is a 3D fingerprint spatial three-point pharmacophore, employing any set of three possible atom types (pi system, donor, acceptor); TGD includes all pharmacophore atom pair combinations together with the topological distance between them (i.e., number of involved bonds) [24,25] . As reference, we also computed the average similarity of all three measures as a ‘consensus’ measure (mean similarity) [7,23] . We employed in-house scripts to conduct the pairwise comparisons of activity and data and prepare the input tables for generating the DAD maps. Calculations were done on personal computers running Windows 7 64 bit. www.future-science.com
Key Term Activity cliff: Chemical compounds with high similar structure but unexpectedly very different biological activity.
5
∆ Activity II
Research Article | Aguayo-Ortiz, Pérez-Villanueva, Hernandez-Campos et al. Z2
Z3
Z1
Z4
Z5
Z4
Z1
Z3
Z2
(0+t) 0 (0-t)
(0-t) 0 (0+t) ∆ Activity I
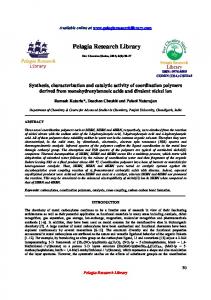
Figure 2. General form of a dual-activity difference map for targets I and II. The lines intersect the axes at potency difference values of 0 ± t for example t = 1 (one log unit). The regions are as follows: Z1, substitution(s) result in a significant decrease or increase of activity in both targets; Z2, substitution(s) increase activity for one target, while decreasing activity for the other target significantly; Z3 and Z4, substitution(s) result in significant changes in activity on one target, but not an appreciable change on the other; Z5, substitution(s) result in similar activities against both targets.
Results & discussion of structural similarity & potency measures In order to have a general notion of the structural diversity of the data set, the 4095 pairwise similarities of the 91 benzimidazole derivatives were calculated using the Tanimoto coefficient and three different fingerprint representations, namely MACCS, piDAPH3, and TGD fingerprints. The mean similarity was computed from the average of all three Tanimoto/fingerprint similarities (see Methods section). Table 2 summarizes the distribution of the similarity values of all 4095 pairwise comparisons. Table 2 also summarizes the pairwise similarities of benzimidazoles with one, two, three, four, five or six substitution changes (288, 857, 1304, 1138, 425 and 83 pairs of compounds, respectively). Despite the fact that the 91 molecules share the benzimidazole scaffold, selected fingerprints were able to differentiate the compounds as deduced from the median (0.56), mean (0.58) and other statistics. Table 2 shows that, in general, as the number of substituent modifications increases from 1 to 6 the similarity values decreases. For example the 288 pairs of compounds with one substitution change have higher similarity than the 83 pairs of compounds with
Distribution
6
Future Med. Chem. (2013) 6(3)
five and six substitution modifications. MACCS keys were the only fingerprint representation that presented an inverse relationship between the pairs of compounds with four, five and six substitutions. This exception may be due to the number of pairs in each group. The absolute pairwise potency difference for each parasite corresponding to all 4095 pairwise comparisons is summarized in Table 3. In general, the entire data set shows a lower potency difference for G. intestinalis than for T. vaginalis, as deduced from the median (0.490 and 0.550, respectively) and other statistics. This suggests that all compounds analyzed here have a broader spectrum of activity against G. intestinalis, while T. vaginalis is more sensitive to the structural changes in the benzimidazole series. Table 3 also summarizes the distribution of the potency difference for pairs of compounds with 1 to 6 changes in the R groups. Interestingly, for T. vaginalis the potency difference decreases from one to six substitutions. On the other hand, G. intestinalis shows a slight increase in the potency difference between one and two, and five and six substitutions, unlike the other substitutions. In addition, two and six changes in R groups show increased absolute potency differences in activity for G. intestinalis (median values of 1.32 and 0.31, respectively) being more sensitive than T. vaginalis (median values of 1.24 and 0.12, respectively). This result suggests that two or six substitutions may produce more activity cliffs in G. intestinalis than T. vaginalis. Similar conclusions were obtained in previous studies with smaller sets of 32 and 55 benzimidazole derivatives [6,23] . The different cliffs found for each protozoa are discussed in the next section with emphasis on the ‘activity switches’ recently proposed [5] . DAD maps Figure 3 shows the DAD maps with pairwise potency differences corresponding to pairs of compounds with one (288 data points) and two (857 data points) changes in the R groups; Table 4 below the plots provides the number and percentage of data points in each region for compound pairs with one and two substitution changes. DAD maps for pairs of compounds with three (1304 data points), four (1138 data points), five (425 data points) and six (83 data points) substitution modifications are shown in Supplementary Figure S1. Of note, the distribution of the data points in all DAD maps is independent of the structure similarity. future science group
Chemoinformatic characterization of activity & selectivity switches
| Research Article
Table 2. Number of pairwise comparisons for 1–6 changes in the R groups and summary of the distribution of the molecular similarity using Tanimoto and three different fingerprints. Statistics Number of pairs
All compounds
Number of substitutions 1
2
3
4
5
6
288
857
1304
1138
425
83
0.792 0.886 0.767 0.667 0.149
0.615 0.732 0.627 0.510 0.161
0.521 0.628 0.541 0.435 0.136
0.446 0.511 0.468 0.396 0.107
0.457 0.541 0.486 0.412 0.112
0.488 0.548 0.492 0.432 0.085
0.775 0.855 0.741 0.630 0.155
0.563 0.662 0.575 0.464 0.149
0.500 0.595 0.520 0.425 0.136
0.458 0.536 0.470 0.389 0.115
0.495 0.532 0.477 0.432 0.098
0.450 0.484 0.425 0.338 0.092
0.662 0.751 0.675 0.582 0.126
0.832 0.922 0.821 0.717 0.117
0.725 0.828 0.732 0.632 0.129
0.658 0.749 0.670 0.582 0.115
0.632 0.707 0.632 0.559 0.100
0.617 0.677 0.617 0.561 0.092
0.544 0.601 0.553 0.495 0.075
0.555 0.646 0.583 0.499 0.121
0.773 0.864 0.776 0.688 0.114
0.631 0.711 0.645 0.561 0.124
0.559 0.642 0.577 0.501 0.104
0.518 0.562 0.523 0.475 0.076
0.522 0.555 0.527 0.485 0.067
0.502 0.527 0.490 0.449 0.063
4095
Molecular access system Median Q3 Mean Q1 SD
0.509 0.646 0.548 0.429 0.156
Pharmacophore atom triangle Median Q3 Mean Q1 SD
0.505 0.610 0.527 0.425 0.149
Typed graph distance Median Q3 Mean Q1 SD Mean similarity† Median Q3 Mean Q1 SD
Computed from the average similarity of MACCS, piDAPH3 and TGD fingerprints. MACCS: Molecular Access System; Q1: First quartile; Q3: Third quartile; SD: Standard deviation; TGD: Typed graph distance.
†
Table 3. Distribution of the absolute potency difference for the two targets, corresponding to all pairwise comparisons for all compounds and pairs of compounds with 1–6 changes in the R groups. Statistics Number of pairs
All compounds
Number of substitutions 1
2
3
4
5
6
288
857
1304
1138
425
83
0.550 1.160 0.775 0.240 0.697
1.470 1.730 1.406 1.095 0.624
1.240 1.940 1.292 0.550 0.849
0.550 0.970 0.705 0.260 0.597
0.380 0.640 0.461 0.180 0.376
0.260 0.760 0.456 0.120 0.468
0.120 0.205 0.284 0.050 0.427
0.490 1.030 0.672 0.200 0.589
1.205 1.948 1.237 0.505 0.797
1.320 1.600 1.300 0.980 0.557
0.380 0.713 0.480 0.170 0.385
0.360 0.650 0.448 0.170 0.351
0.200 0.370 0.270 0.090 0.236
0.310 0.480 0.342 0.120 0.244
4095
Trichomonas vaginalis Median Q3 Mean Q1 SD Giardia intestinalis Median Q3 Mean Q1 SD
Q1: First quartile; Q3: Third quartile; SD: Standard deviation.
future science group
www.future-science.com
7
Research Article | Aguayo-Ortiz, Pérez-Villanueva, Hernandez-Campos et al. 4
compounds with minor structural modifications that invert drastically the selectivity pattern for two targets.
R-cliffs: Pair of compounds
where a single or double substitution around the core scaffold dramatically modifies the biological activity.
∆pIC50 Giardia intestinalis
Selectivity switch: Pair of
Z2
Z3
2 1 0 Z4
Z4 Z5
-1 -2 -3 Z1
-4 -5
Z3 -4
4
Z1
3
-3 -2 -1 0 1 2 3 ∆pIC50 Trichomonas vaginalis
Z2 4
5
∆pIC50 Giardia intestinalis
Key Terms
Z2
Z3
Z1
3 2 1 0 Z4
Z4 Z5
-1 -2 -3 Z1 -4 -5 -4
Z3
Z2
-3 -2 -1 0 1 2 3 4 ∆pIC50 Trichomonas vaginalis
5
Figure 3. Dual-activity difference maps for the 91 compounds. Each data point represents a pairwise comparison with (A) one (288 data points) and (B) two changes in the R groups (857 data points). For color see the online version of the paper www.future-science.com/doi/full/10.4155/FMC.13.173
Table 4. The number and percentage of data points in each region of the map for compound pairs with single and double substitutions, respectively. Region Interpretation Z1
Z2
Z3 Z4 Z5
Substitution changes activity for Trichomonas vaginalis and Giardia intestinalis in similar magnitude and direction Substitution changes activity for Trichomonas vaginalis and Giardia intestinalis in similar magnitude but opposite direction Substitution changes activity for Giardia intestinalis but not for Trichomonas vaginalis Substitution changes activity for Trichomonas vaginalis but not for Giardia intestinalis Substitution does not change significantly (≤1 log potency) the activity for Trichomonas vaginalis and Giardia intestinalis
Figure 3A & B shows that 78.1% (225 pairs) and 61.5% (527 pairs) of the data points in the DAD maps are in zone Z5 for compounds with single and double substitutions, respectively. Overall, as indicated in Supplementary Table S1, as the number of substitutions increases from one to six, the percentage of pairs of compounds in Z5 decreases, except for five substitutions. The DAD maps in Figure 3 also indicate the presence of data points in the regions Z1–Z4. As discussed in the Methods section compound pairs in these zones point to one or two R group replacements that change drastically the activity of the molecules for one or the two parasites. Differences in percentages of data points in regions Z4 and Z3 suggest that T. vaginalis is more sensitive to single substitutions than G. intestinalis. In contrast, G. intestinalis is
8
Single Double 288 pairs total 857 pairs total
Future Med. Chem. (2013) 6(3)
10 (3.47%)
130 (15.17%)
0 (0.00%)
2 (0.23%)
21 (7.29%) 32 (11.11%) 225 (78.13%)
118 (13.77%) 80 (9.33%) 527 (61.49%)
more sensitive to double substitutions than T. vaginalis. This result is in agreement with the results in Table 3 discussed above. Mapping
structure similarity on DAD maps filtered by the number of substituents S upplementary Figure S2 shows four DAD maps with data points corresponding to one, two, three and four substitutions. Data points are colored by the mean structure similarity using a continuous scale from less similar (green) to more similar (red). These results further support, in a visual manner, that pairs of compounds with only one different R group are more similar than compounds pairs with two, three, four, five and six substitutions (Table 2 & S upplementary Figure S2) . future science group
Chemoinformatic characterization of activity & selectivity switches The SAR analysis from zones Z3 and Z4 (e.g., single-target activity cliffs) of a subset of 55 benzimidazoles has been previously studied by our group [6,7] . In this paper we analyzed a larger set focusing the analysis of the SAR on discrete structural changes that modifies the activity for both parasites in the same (Z1) and opposite direction (Z2), respectively. In the next sections further details of ‘activity switches’ (compound in Z2) are discussed first followed by representative examples of dual-target activity 4
| Research Article
cliffs with similar magnitude and direction in the SAR (compound pairs in Z1). Of note, there are no ‘activity switches’ with one substitution (Figure 3 & Table 4) . Activity
switches (Z2) with two substitutions Figure 4 & Table 5 shows a DAD map displaying 857 pairs of compounds with two changes in the R groups. As expected from the molecular similarity results, a lower structural similarity
Z2
∆pIC50 Giardia intestinalis
3 2
1/4
1 0 -1
4/9
-2 -3 Z2
-4 -5
H
-4
-3
-2 -1 0 1 2 ∆pIC50 Trichomonas vaginalis S
N
3
4
N
F
CF3
CF3 N
5
N CF3
N
N
CH3
H
1
H
9
4
Tv: 3134 nM
Tv: 200 nM
Tv: 3147 nM
Gi: 107 nM
Gi: 10450 nM
Gi: 489 nM
Figure 4. Activity switches for double substitutions. The switches are readily identified in the zone Z2 of the dual-activity difference maps. The structural changes in each pair are highlighted in red. Gi: Giardia intestinalis; Tv: Trichomonas vaginalis. For color see the online version of the paper www.future-science.com/doi/full/10.4155/FMC.13.173
Table 5. The potency difference and fingerprint-based similarity values for each pair. Pair
DpIC50Tv
DpIC50Gi
Mean similarity
MACCS
piDAPH3
TGD
1/4
-1.20
1.99
0.510
0.524
0.464
0.542
4/9
1.20
-1.33
0.521
0.512
0.464
0.586
Gi: Giardia intestinalis; MACCS: Molecular Access System; TGD: Typed graph distance; Tv: Trichomonas vaginalis.
future science group
www.future-science.com
9
Research Article | Aguayo-Ortiz, Pérez-Villanueva, Hernandez-Campos et al. 4
Z1
∆pIC50 Giardia intestinalis
3 2 1 15/61 0
5/24 7/24
-1
6/23 -2
13/22
6/29
-3 -4 -5
2/29
2/23
3/24
Z1 -4
-3
4/23 -2 -1 0 1 2 ∆pIC50 Trichomonas vaginalis F3C
3
4
5
Cl
N
N CF3
CF3 N
N CH3
CH3 2
29
Tv: 4098 nM
Tv: 238 nM
Gi: 1144 nM
Gi: 42 nM
Cl
S
N
O
Cl
CF3
O N
N CF3
N
CF3
N
CH3
CH3
23
4 Tv: 200 nM Gi: 10,450 nM
N 6
Tv: 16 nM Gi: 30 nM Br
Tv: 29,590 nM Gi: 1098 nM Br
N
N N
CF3 N H
Br
CH3
S Br
15 Tv: 190 nM Gi: 250 nM
N H 61 Tv: 11 nM Gi: 20 nM
Figure 5. Dual target activity cliffs for single substitutions with the same direction for example increases or decreases the activity for the two targets. The ten activity cliffs with direct structure–activity relationships are readily identified in the zone Z1 of the dual-activity difference maps. The structural changes in each pair are highlighted in red. Tv: Trichomonas vaginalis; Gi: Giardia intestinalis. For color see the online version of the paper www.future-science.com/doi/full/10.4155/FMC.13.173
10
Future Med. Chem. (2013) 6(3)
future science group
Chemoinformatic characterization of activity & selectivity switches
| Research Article
Table 6. Dual target activity cliffs for single substitutions with the same direction for example increases or decreases the activity for the two targets. Pair
DpIC50Tv
DpIC50Gi
Mean similarity MACCS
piDAPH3
TGD
6/23
-3.27
-1.56
0.714
0.810
0.362
0.970
2/23
-2.41
-1.58
0.653
0.756
0.405
0.798
6/29
-2.09
-1.42
0.660
0.838
0.425
0.717
7/24
-1.99
-1.31
0.788
0.810
0.595
0.959
13/22
-1.72
-1.63
0.704
0.722
0.513
0.876
3/24
-1.69
-2.15
0.632
0.707
0.397
0.793
5/24
-1.37
-1.35
0.675
0.608
0.523
0.894
15/61
-1.27
-1.09
0.672
0.440
0.840
0.737
2/29
-1.23
-1.44
0.956
0.939
1.000
0.929
4/23
-1.10
-2.54
0.719
0.608
0.644
0.905
Summarizes the potency difference and fingerprint-based similarity values for each pair. Data points in Figure 5 are color-coded by the mean structure similarity using a continuous scale from more similar (red) to less similar (green). Gi: Giardia intestinalis; MACCS: Molecular Access System; TGD: Typed graph distance; Tv: Trichomonas vaginalis.
of the pairs of compounds with two substitution changes were observed as compared with pairs with one substitution modification (see also Table 2). Figure 4 also presents the chemical structures and biological activity of the two ‘activity switches’ in Z2; Table 5 shows the potency difference and the structural similarity for each pair. For the two ‘activity switches’ in Figure 4, the two changes in the R groups have a large and opposite effect on the activity for T. vaginalis and G. intestinalis. Compound 4 is present in the two ‘activity switches’, in which the replacement of the methyl to hydrogen in R1, in both molecule pairs, and the substitution of the S-propyl to hydrogen (compound 1) or fluorine (compound 9) in R4 increases the activity for G. intestinalis. The two R group replacements increase the activity in 1.99 log units and 1.33 log units in the molecule pairs 1/4 and 4/9, respectively. In sharp contrast, the same replacements decrease the activity for T. vaginalis in approximately 1.20 log units in both molecule pairs. These pairs of compounds are also examples of ‘selectivity switches’ since 1 and 9 are selective for G. intestinalis ,whereas 4 is selective for T. vaginalis. The mean structural similarity of the compounds pairs 1/4 (0.51) and 4/9 (0.52) are lower than the mean similarity of the entire data set (0.58). These results indicate that the switches discussed in Figure 4 present high structural differences according to the fingerprint-based representation. In the following subsections dual- and single-target activity cliffs with one R group replacement ( R-cliffs) are discussed [26] . future science group
Dual-target
substitution
activity cliffs (Z1) with one
Figure 5 & Table 6 show a DAD map with pairs of compounds with one change in the R groups labeling the ten data points in Z1. The figure also illustrates the chemical structures of six representative molecule pairs. Compounds such as 3, 7, 6, 5, 2 & 24 were frequently identified in these pairs and can be regarded as dual-target activity cliff generators [27] . It is clear from the figure that the change in the R group for all ten pairs simultaneously increases (or decreases) the activity for both parasites in more than one log unit. Interestingly, most compounds in the pairs are regioisomers showing similar behavior in activity (2–7, 23 & 24; Table 1) . These pairs of compounds demonstrates that the R4 or R5 substitutions are independent of a steric hindrance since 29 has a small substituent compared with 23 ; however, both compounds have better activity than 2 and 6 that have substituents with similar size. At this position, the SAR for T. vaginalis and G. intestinalis appears to be different from Entamoeba histolytica in which a steric hindrance at position R5 favors the antiamoebic activity [28] . Finally, the pair of compounds 15/61 illustrate that the replacement of a trifluoromethyl to an N,N-dimethyl-3-thiopropanamine in R 2 increases the activity for both parasites. Single-target
substitution
activity cliffs with one
shows a single-target activity cliff with a very large potency difference (i.e., more than three log units) or deep
Figure 6 & Table 7
www.future-science.com
11
Research Article | Aguayo-Ortiz, Pérez-Villanueva, Hernandez-Campos et al. 4
∆pIC50 Giardia intestinalis
3 2 1 0
Z4
-1 18/21 -2 -3 -4 -5
-4
-3
-2 -1 0 1 2 ∆pIC50 Trichomonas vaginalis
Br Br
3
5
Br N
Br
N
Br
N H
CF2CF3
CF3 N H
Br
4
Br
Br
18 Tv: 2 nM Gi: 56 nM
21 Tv: 10,100 nM Gi: 23 nM
Figure 6. Activity cliff for Trichomonas vaginalis (deep cliffs with >3 log units in potency difference for single substitutions). The structural changes are highlighted in red. Tv: Trichomonas vaginalis; Gi: Giardia intestinalis. For color see the online version of the paper www.future-science.com/doi/ full/10.4155/FMC.13.173
Table 7. The potency difference and fingerprint-based similarity values. Pair
DpIC50Tv DpIC50Gi Mean similarity MACCS piDAPH3 TGD
18/21 3.70
-0.39
0.975
1.000
1.000
1.000
Gi: Giardia intestinalis; MACCS: Molecular Access System; TGD: Typed graph distance; Tv: Trichomonas vaginalis.
activity cliff [23] only for T. vaginalis. The singlesubstitution difference between 18 and 21 is a CF3 to C2F5 in R 2. However, this structural change does not have a major impact (