Based on the 1992 UFD inventory there were of 17,010 municipal trees in Cheyenne. Publicly managed trees accounted for 48% (8,103) of the total, while ...
CITY
OF
CHEYENNE, WYOMING
M U N I C I P A L TR E E R E S O U R C E AN A L Y S I S
BY
PAULA J. PEPER1 E. GREGORY MCP HERSON1 JAMES R. SIMPSON1 SCOTT E. MACO1 QINGFU XIAO2 1
CENTER FOR URBAN FOREST RESEARCH USDA FOREST S ERVICE, PACIFIC SOUTHWEST RESEARCH STATION C/O D EPT. OF ENVIRONMENTAL H ORTICULTURE UNIVERSITY OF CALIFORNIA DAVIS, CA 95616-8587 2
DEPARTMENT OF LAND, AIR, AND WATER RESOURCES UNIVERSITY OF CALIFORNIA , DAVIS, CA
—A UGUST 2004—
A CKNOWLEDGMENTS Lisa Olson and Randy Overstreet (Cheyenne Urban Forestry Division) along with Mark Hughes (Wyoming State Forestry Division) provided valuable information for this report. Numerous people assisted with data collection, provided technical assistance and historical information: Jesse Hoekstra, Tommy Mouton, and Mary Street (CUFR); Chris Weydeveld and Josh Amend (North Wind Environmental); Tom and Carole Eppler (Porch Swing B & B); and Susan Ford (U.S. Forest Service, S&PF, Region 2).
Table of Contents ACKNOWLEDGMENTS ............................................................................................................ 2 EXECUTIVE SUMMARY .......................................................................................................... 8 CHAPTER ONE—INTRODUCTION ..................................................................................... 11 CHAPTER TWO—CHEYENNE’S MUNICIPAL TREE RESOURCE .............................. 13 HISTORY AND CURRENT MANAGEMENT .................................................................................... 13 TREE NUMBERS ......................................................................................................................... 16 SPECIES COMPOSITION AND RICHNESS ...................................................................................... 17 DIVERSITY ................................................................................................................................. 18 SPECIES IMPORTANCE ................................................................................................................ 18 STREET TREES P ER CAPITA........................................................................................................ 20 STOCKING LEVEL ....................................................................................................................... 20 AGE STRUCTURE ........................................................................................................................ 21 TREE CONDITION ....................................................................................................................... 24 TREE CANOPY ............................................................................................................................ 26 LOCATION & OTHER F EATURES ................................................................................................. 28 MAINTENANCE NEEDS ............................................................................................................... 29 General Pruning ................................................................................................................... 29 Safety and Removals ............................................................................................................. 30 CHAPTER THREE—COSTS OF MANAGING CHEYENNE’S MUNICIPAL TREES .. 32 FISCAL YEAR 2001-2002 PROGRAM EXPENDITURES ................................................................. 32 Costs of Managing Public Trees ........................................................................................... 32
Tree Planting and Establishment .......................................................................................... 33 Mature Tree Care.................................................................................................................. 34 Administration....................................................................................................................... 35 CHAPTER FOUR—BENEFITS OF CHEYENNE MUNICIPAL TREES .......................... 36 INTRODUCTION .......................................................................................................................... 36 ENERGY SAVINGS ...................................................................................................................... 36 ELECTRICITY AND NATURAL GAS RESULTS ............................................................................... 37 ATMOSPHERIC CARBON DIOXIDE REDUCTIONS ......................................................................... 39 AIR QUALITY IMPROVEMENT ..................................................................................................... 40 Deposition and Interception Result ...................................................................................... 41 Avoided Pollutants and BVOC Emissions Result ................................................................. 41 Net Air Quality Improvement................................................................................................ 42 STORM -WATER RUNOFF REDUCTIONS ....................................................................................... 43 PROPERTY VALUES AND OTHER BENEFITS ................................................................................ 45 TOTAL ANNUAL NET BENEFITS AND BENEFIT-COST RATIO (BCR) ........................................... 46 CHAPTER FIVE—MANAGEMENT IMPLICATIONS ....................................................... 52 RESOURCE COMPLEXITY ............................................................................................................ 53 RESOURCE EXTENT .................................................................................................................... 58 PRUNING & MAINTENANCE ....................................................................................................... 59 CHAPTER SIX—CONCLUSION ............................................................................................ 61 CHAPTER SEVEN—REFERENCES ...................................................................................... 64 REFERENCES .............................................................................................................................. 64
APPENDIX A: TREE DISTRIBUTION .................................................................................. 70 APPENDIX B: METHODOLOGY AND PROCEDURES ..................................................... 71 GROWTH MODELING.................................................................................................................. 71 IDENTIFYING & CALCULATING BENEFITS .................................................................................. 74 Energy Savings...................................................................................................................... 75 Electricity and Natural Gas Methodology ........................................................................ 77 Single-Family Residential Adjustments ........................................................................... 81 Multi-Family Residential Analysis ................................................................................... 86 Commercial and Other Buildings ..................................................................................... 86 Atmospheric Carbon Dioxide Reduction.......................................................................... 87 Avoided CO2 Emissions Methodology............................................................................. 88 Improving Air Quality........................................................................................................... 89 Avoided Emissions Methodology..................................................................................... 89 Deposition and Interception Methodology ....................................................................... 90 BVOC Emissions Methodology ....................................................................................... 91 Reducing Storm-water Runoff and Hydrology...................................................................... 91 Storm-water Methodology ................................................................................................ 91 Aesthetics & Other Benefits.................................................................................................. 92 Property Value and Other Benefits Methodology ............................................................ 95 ESTIMATING MAGNITUDE OF BENEFITS ..................................................................................... 97 Categorizing Trees by DBH Class ........................................................................................ 98 Applying Benefit Resource Units to Each Tree..................................................................... 98 Matching Significant Species with Modeled Species ............................................................ 99
Grouping Remaining “Other” Trees by Type ...................................................................... 99 CALCULATING N ET BENEFITS AND BENEFIT-COST RATIO ....................................................... 100 Net Benefits and Costs Methodology .................................................................................. 101 ASSESSING STRUCTURE ........................................................................................................... 102 APPENDIX C: SPECIES CODE AND RELATIVE PERFORMANCE INDEX REFERENCE LIST.................................................................................................................. 103 APPENDIX D: TOTAL STREET RIGHT-OF-WAY AND PARK TREE NUMBERS.... 104 RESIDENTIAL SOUTH OF P ERSHING .......................................................................................... 104 DOWNTOWN............................................................................................................................. 105 RESIDENTIAL NORTH OF P ERSHING.......................................................................................... 106 JAYCEE PARK ........................................................................................................................... 107 PIONEER PARK ......................................................................................................................... 107 MARTIN LUTHER KING PARK................................................................................................... 108 OPTIMIST PARK........................................................................................................................ 108 TIMBERLAND PARK.................................................................................................................. 109 CIVITAN PARK ......................................................................................................................... 109 LINCOLN PARK......................................................................................................................... 110 UNITED NATIONS PARK ........................................................................................................... 110 BRIMMER PARK ....................................................................................................................... 111 CAHILL PARK ........................................................................................................................... 111 MYLAR PARK ........................................................................................................................... 112 SMALLEY PARK ........................................................................................................................ 112 HOLIDAY PARK ........................................................................................................................ 113
LIONS PARK.............................................................................................................................. 114 AIRPORT GOLF COURSE ............................................................................................................ 114 PRAIRIE VIEW GOLF COURSE .................................................................................................... 115 CHEYENNE CEMETERY ............................................................................................................. 115 BAR X ...................................................................................................................................... 116
E XECUTIVE S UMMARY Street trees in Cheyenne are comprised of two distinct populations, those managed by the city’s Urban Forestry Division (UFD) and those inspected by the UFD but managed by private property owners. Over the years Cheyenne has invested millions in its municipal forest. The primary question that this study asks is whether the accrued benefits from Cheyenne’s street trees justify the annual expenditures?
This analysis combines results of a 1992 citywide inventory with benefit-cost modeling data to produce four types of information (Maco 2003): 1. 2. 3. 4.
Resource structure (species composition, diversity, age distribution, condition, etc.) Resource function (ma gnitude of environmental and aesthetic benefits) Resource value (dollar value of benefits realized) Resource management needs (sustainability, pruning, planting)
RESOURCE STRUCTURE •
Based on the 1992 UFD inventory there were of 17,010 municipal trees in Che yenne. Publicly managed trees accounted for 48% (8,103) of the total, while privately cared for trees comprised the remaining 52% (8,907).
•
There are many opportunities to increase the resource extent. Approximately 6,300 sites—41% of all street tree-planting sites—were unplanted. Conversely, the parks are fully stocked
•
Citywide, the resource represented 58 different tree species, a notable number considering climate restrictions. However, because many were newer introductions to the city and few in number, overall diversity was low.
•
Having the most leaf area and canopy cover, Cottonwood and Siberian elm were the dominant street tree species in Cheyenne, contributing over 50% of the total tree leaf area and 60% of the total canopy cover. Ponderosa/Austrian pine, Blue spruce, and Cottonwood dominated park tree plantings.
•
The age structure for all public trees in Cheyenne differed from the ideal only in having slightly fewer numbers of mature or older trees and almost 12% more newly out-planted
8
trees. This increase in new plantings may assist in maintaining a flow of benefits that could otherwise drop due to a gap in street tree planting that appears to have occurred between 12 and 20 years ago. RESOURCE FUNCTION AND VALUE •
Because of Cheyenne’s severe climate conditions, energy savings from trees are higher than those that would be found in more sheltered locations. Electricity and natural gas saved annually from both shading and climate effects totaled 1,175 MWh and 21,370 Mbtu, respectively, for a total retail savings of $186,986 ($10.99/tree). Benefits from conifers in parks ($6.27/tree) exceeded street conifer benefits ($3.68/tree), but large deciduous street trees produced six times the benefits of large deciduous park trees.
•
Citywide, municipal trees sequestered 664 tons of the greenhouse gas carbon dioxide. The same trees offset an additional 1,120 tons through reductions in energy plant emissions. Street trees had an annual net sequestration rate of approximately 491 tons and reduced emissions by another 788 tons. The combination of these savings was valued at $29,135 ($1.71/tree) annually.
•
Annual air pollutant uptake by tree foliage (pollutant deposition and particulate interception) was 2.3 tons combined. The total value of this benefit for all street trees was $8,429, or about $0.50/tree.
•
The high biogenic volatile organic compound (BVOC) emission rates associated with the city’s predominant species was counteracted by energy savings associated with less fossil fuel consumption (due to the shade and climate effects of the trees). The resultant net benefit was approximately $3,480 or $0.20/tree.
•
The ability of Cheyenne’s municipal trees to intercept rain—thereby avoiding stormwater runoff—was estimated at 760,191 ft3 annually. The total value of this benefit to the city was $55,301. Citywide, the average street tree intercepted 334 gallons, valued at $3.25, annually.
•
The estimated total annual benefit associated with property value increases and other less tangible benefits was approximately $403,000 or $24/tree on average. American elm ($44/tree), and Hackberry ($39/tree) were on the high end, while Pinyon pine ($3/tree), Juniper species ($4/tree), Birch ($8/tree), and Quaking aspen ($11/tree) averaged the least benefits.
•
Overall, annual benefits were determined largely by tree size, where large-stature trees typically produced greater benefits. For example, average small or young trees produced $19/tree in benefits, maturing medium-sized trees produced $38/tree, mature large trees produced $66/tree, and large old trees produced annual benefits of $80/tree.
•
The municipal tree resource of Cheyenne is a valuable asset, providing approximately $686 thousand ($40/tree) in total annual benefits to the community. The city currently
9
spends approximately $19/tree on their care. Over the years Cheyenne has invested millions in its municipal forest. Citizens are now receiving a relatively large return on that investment – receiving $2.09 in benefits for every $1 spent on tree care. Continued investment in ma nagement is critical to insuring that residents receive a greater return on investment in the future. RESOURCE MANAGEMENT N EEDS •
Achieving resource sustainability requires increasing diversity by balancing new plantings of proven, long- lived species with ne wer successful introductions, maximizing available growth space to provide the largest amount of leaf area and canopy coverage as the trees mature. Continued replacement of senescent Cottonwood and Siberian elm with a variety of long- lived medium and large-stature broadleaf deciduous tree species is recommended.
•
Focusing planting efforts along streets where stocking levels are lowest will improve the distribution of benefits provided to all neighborhoods. To this end a current inventory of all Cheyenne street trees will aid in overseeing and tracking management.
•
Tree health and pruning management needs for street trees were substantial compared to well- maintained park trees. Extensive public education on appropriate pruning and irrigation frequencies to demonstrate the resultant beneficial effects on tree health is necessary; this could assist in improving the functionality, longevity, and the overall benefits produced by street trees. Functionality and longevity would be further bolstered through the establishment of a consistent pruning program for street trees.
Cheyenne’s street trees are a fantastically dynamic resource. Managers of this resource and the community alike can delight in knowing that street trees do improve the quality of life in Cheyenne, but they are also faced with a fragile resource that needs constant care to maximize and sustain these benefits through the foreseeable future. In a city where the climate poses a constant challenge to tree growth and health, this is no easy task. The cha llenge will be to maximize net benefits from available growth space over the long-term, providing a resource that is both functional and sustainable.
10
C HAPTER O NE —I NTRODUCTION Cheyenne’s Urban Forestry Division (UFD) manages approximately 8,900 trees along streets and 8,100 trees in parks. The municipal forest is comprised of two distinct populations, those managed and maintained entirely by the Division (park trees) and those overseen by the Division but predominantly maintained by private property owners (street trees). The UFD believes that the public’s investment in stewardship of Cheyenne’s urban forest produces benefits that outweigh the costs to the community. Cheyenne, the state capital and largest city in Wyoming, is an active economic, cultural and political center for the northern plains. With population growth increasing nearly 6 percent over the past 10 years to 53,011 citizens, current community goals include maintaining and enhancing the integrity of community neighborhoods, retaining neighborhood character and providing high quality residential neighborhoods. Research indicates that healthy city trees can mitigate impacts of development on air quality, climate, energy for heating and cooling buildings, and storm-water runoff. Healthy street trees increase real estate values, provide neighborhoods with a sense of place, and foster psychological health. Street and park trees are associated with other intangibles such as increased community attractiveness and recreational opportunities that make Cheyenne a more enjoyable place to work and play. Cheyenne’s urban forest creates a setting that helps attract tourism and retain businesses and residents.
However, in an era of dwindling public funds and rising expenditures, residents and elected officials often scrutinize expenditures that are considered “non-essential” such as planting and management of the municipal forest. Although the current program has demonstrated its economic efficiency, questions remain regarding the need for the level of service presently
11
provided. Hence, the primary question that this study asks is whether the accrued benefits from Cheyenne’s street trees justify the annual expenditures?
In answering this question, information is provided to: 1. Assist decision- makers to assess and justify the degree of funding and type of management program appropriate for this city’s urban forest. 2. Provide critical baseline information for the evaluation of program cost-efficiency and alternative management structures. 3. Highlight the relevance and relationship of Cheyenne’s municipal tree resource to local quality of life issues such as environmental health, economic development, and psychological health. 4. Provide quantifiable data to assist in developing alternative funding sources through utility purveyors, air quality districts, federal or state agencies, legislative initiatives, or local assessment fees.
This report consists of seven chapters and four appendices: Chapter One—Introduction: Describes purpose of the study. Chapter Two—Cheyenne’s Municipal Tree Resource: Describes the current structure of the street tree resource. Chapter Three—Costs of Managing Cheyenne’s Municipal Trees: Details management expenditures for publicly and privately managed trees. Chapter Four—Benefits of Cheyenne Municipal Trees: Quantifies estimated value of tangible benefits and calculates net benefits and a benefit-cost ratio for each population segment. Chapter Five—Management Implications : Evaluates relevancy of this analysis to current programs and posits management challenges with goals of street tree management. Chapter Six—Conclusion: Final word on the use of this analysis. Chapter Seven—References: Lists publications cited in the study and the contributions made by various participants not cited as authors. Appendix A: Tree Distribution. Appendix B: Describes benefits, procedures and methodology in calculating structure, function, and value of the street tree resource. Appendix C: Species Code and Relative Performance Index Reference List. Appendix D: Total Street Right-of-Way and Park Tree Numbers.
12
C HAPTER T WO —C HEYENNE’ S M UNICIPAL T REE R ESOURCE
HISTORY AND CURRENT MANAGEMENT Initially established as a construction camp for the Union Pacific Railroad, the City of Cheyenne was founded in 1867. By 1875 over 5,000 people lived within the city. Settlement came so quickly the town was nicknamed “Magic City of the Plains”; however, tree planting was a slow and challenging process. Nine years after establishment, Mrs. Nannie Steel reported there were only 12 trees in Cheyenne (Cheyenne Botanic Gardens 2004). In 1878, James Flood Jenkins planted his first of many trees in the city. Mr. Jenkins was instrumental in establishing the first Cheyenne Arbor Day in 1882 and many subsequent plans for tree planting, maintenance and park treeing and development (Jenkins undated personal memoirs).
Climate extremes, high elevation (6,062ft), and coarse alkaline soil with little water- holding capacity presented these early citizens with one of the harshest growing climates in the United States. That has not changed in the 137 years since establishment. Thirty- year average minimum and maximum temperatures range from 14.8ΕF to 81.9ΕF, respectively, with extremes of -34ΕF to 100ΕF. Cheyenne has the highest incidence of hailstorms in the nation (averaging 10 per year), receives an average 15 inches of precipitation annually, and is the fourth windiest city in the nation (13 mph average). Despite these conditions the city has a highly regarded tree program and has received recognition as a Tree City USA for 22 years, as well as 7 Growth Awards and 2 Merit Awards from the National Arbor Day Foundation. Additionally, the program received international recognition, earning a Gold Leaf Award from the International Society of Arboriculture.
13
In 2003 the UFD employed 8 full time staff to manage and maintain municipal trees. The city is responsible for the management and maintenance of trees and all other woody vegetation on all public properties including parks, golf courses, cemeteries, medians, triangles, islands, and other city maintained public lands. Although tree maintenance on street right-of-way (ROW) is the responsibility of each homeowner or business, residents are required to consult with the City Forester before any tree trimming, plant ing, or removal is conducted. Additionally, the Division provides education programs and other information for citizens, conducts tree inspections on residential lots, tests, licenses and regulates commercial arborists and pesticide applicators within the city, and provides planning and planting advice for new tree installations. The UFD also provides citizens with a wealth of information on Cheyenne trees, tree care, ordinances, and current issues affecting the urban forest on a well- managed website (http://www.cheyennetrees.com). Residents receive an initial 30-day notice when their trees require maintenance. If the required work is not completed after second notification, the UFD will put the work out to bid and bill the property owner. However, the city ultimately assumes responsibility for the cost if the money cannot be collected.
In this report, all city-maintained trees are referred to as “park” trees. “Street” trees are resident maintained trees in public rights-of-way, the majority of which are planting strips adjacent to residences or businesses.
In 1992, the Division conducted the first full tree inventory for the city. In 2001, a partial inventory for the core area of town was completed and currently a park tree evaluation is being conducted on all city- maintained trees. This year, the Davey Resource Group will re-inventory
14
the privately cared for trees. Approximately 1,730 park trees were pruned in 2001, a year selected for this study because it represents normal maintenance trends. After an initial training prune within 2.5 years of planting, trees are generally in one of 3 different trim cycles. Generally, large park trees (>40 ft) are pruned every 7 years. Medium park (20-40 ft) trees are pruned every 6 years and small trees (3 6
30 -36
24 -30
18 -24
12 -18
6-1 2
0-6
Park Trees
DBH Class (in)
Figure 1. Ideal relative age distribution shown with Cheyenne’s different street tree populations.
In parks, only mature tree numbers were less than ideal, but this scarcity of older trees was explained by the history of park development in the city. Park acreage has increased over the past 50 years as Cheyenne has grown. Newly annexed parkland is typically open grassland that is predominantly treeless. Continued consistent UFD planning and planting efforts for these new annexations are demonstrated by the number of younger trees present in the parks. These trees (with 3 6
24 -30
Ideal Citywide total Willow Juniper species Boxelder maple Crabapple Honeylocust Green ash Ponderosa pine Siberian elm Blue spruce Cottonwood/poplar 12 -18
06
% of Population
Citywide
DBH Class (in)
Street Trees
% of Population
100%
Ideal Citywide total Ponderosa/Austrian pine Quaking aspen Crabapple Blue spruce Boxelder maple American elm Honeylocust Green ash Siberian elm Cottonwood/poplar
80% 60% 40% 20%
>3 6
24 -30
12 -18
06
0%
DBH Class (in)
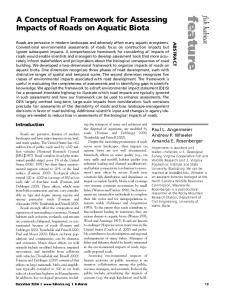
not provide the level of benefits larger species afford. Figure 2. Relative age distribution for Cheyenne’s 10 most abundant trees citywide and for street trees.
23
Due predominantly to park tree plantings by the UFD, young populations of large- growing trees, including Blue spruce, Siberian elm, Ponderosa pine, Green ash, and Honeylocust, will contribute to a stream of future benefits as they mature. However, species selection and planting along Cheyenne’s streets are of concern. As Figure 2 shows, Quaking aspen (Populus tremuloides) were being planted in increasing numbers by homeowners. Typically, aspen are weak-wooded, short- lived and require more water than many other species. They may grow rapidly to a medium size, but produce significantly less leaf area and fewer benefits than similarsized species.
With the exception of Cottonwood, Siberian and American elms (Ulmus americana), there were few large species being planted along residential streets. Like aspen, Cottonwood and Siberian elm grow rapidly and tend to be weak-wooded. They produce an excellent stream of benefits for the city, but are better planted in parks rather than the space-restricted planting strips along Cheyenne streets.
TREE CONDITION Tree condition indicates both how well trees are managed and their relative performance given site-specific conditions. Because of neglect and inconsistent management, street trees that are privately cared for are typically in poorer condition relative to those publicly managed (Bartenstein 1981). This held true in Cheyenne where the public park trees tended to be in better condition than the citizen- managed street trees (Figure 3 and Table 6). About 42% of citymaintained trees were in good condition compared to less than 10% maintained privately along streets. Similarly, there were over three times more poor and dead trees on streets than in parks.
24
Three-quarters of all trees on streets were in fair condition compared to slightly over half of the park trees. Table 6. Condition of park and street tree population (%). Species Name Blue spruce Common chokecherry Cottonwood/poplar Crabapple Green ash Hackberry Honeylocust Juniper species Pine Pinyon pine Ponderosa/Austrian pine Siberian elm Park/Street Total Citywide Total
Excellent 0.9%
Dead 0.00 0.00 0.00 0.00 0.00 0.00 0.00 0.00 0.00 0.00 0.00 0.00 0.02 0.22
Poor 3.18 2.99 5.52 3.99 9.28 8.54 7.29 4.20 4.76 5.41 1.76 12.67 5.73 11.38
Park Fair 46.28 19.40 65.10 44.20 39.18 53.66 34.38 62.24 29.52 51.35 37.62 82.36 52.12 63.26
Good 48.03 76.12 28.74 51.09 50.77 37.80 58.33 33.57 58.10 43.24 60.35 4.97 41.21 24.66
Dead 0.0% Poor 5.7%
Excellent 2.52 1.49 0.63 0.72 0.77 0.00 0.00 0.00 7.62 0.00 0.27 0.00 0.93 0.48
Dead 0.56 1.65 0.29 0.37 0.21 0.00 0.43 0.00 0.00 0.00 0.86 0.27 0.39 0.22
Poor 6.78 12.09 19.47 4.83 17.94 8.70 9.71 5.23 4.62 5.00 9.48 24.80 16.53 11.38
Excellent 0.1%
Good 9.6%
Street Fair 70.34 77.47 73.84 79.55 73.92 72.17 75.65 68.63 80.51 84.17 68.53 73.23 73.40 63.26
Dead 0.4%
Good 22.32 8.79 6.34 15.24 7.94 19.13 13.77 26.14 14.87 10.83 21.12 1.70 9.60 24.66
Excellent 0.00 0.00 0.05 0.00 0.00 0.00 0.43 0.00 0.00 0.00 0.00 0.00 0.08 0.48
Poor 16.5%
Good 41.2%
Fair 52.1% Fair 73.4%
Figure 3. Citywide distribution of city-maintained park trees and privately maintained street trees.
The relative performance index (RPI) of each species provides an indication of their suitability to local growing conditions, as well as their performance. It is calculated for each species by dividing its proportion of all trees rated as good or excellent by the percentage of all trees rated as good or excellent. For example, Hackberry’s relative performance is 1.07 because 26.9% were good or excellent compared to 25.15% of all trees citywide rated good or excellent (0.269/0.2515 = 1.07). Species with RPIs greater than 1.0 have proportionately more individuals classified as good or excellent (Table 7). Species with larger percentages of trees in good condition are likely to be better adapted to Cheyenne’s climate, requiring fewer inputs of money and management.
25
Abundant species rated as having the best performance, overall, were Ponderosa/Austrian pine, Blue spruce, Chokecherry (Prunus virginiana), Crabapple species, Juniper species, Pine species, Hackberry, and Pinyon pine. These species were widely adapted to growing conditions throughout the city. Predominant species with the lowest performance included Green ash, Honeylocust, Cottonwood, and Siberian elm. Citywide, the majority of these species appeared to perform well, but closer examination of their relative performance by location showed that the higher performance of species depended on the generally better condition exemplified by the UFD managed park trees (Table 7). With the exception of Siberian elm, all species performed above the 1.0 level. The reverse was true for the street species where only Juniper exceeded 1.0. This discrepancy between performance levels of the same species suggests that tree management and maintenance – consistency of care, pruning and irrigation to maintain tree health – differs significantly between the city- managed park trees and the privately maintained street tree population. Table 7. Relative performance index (RPI) for predominant Cheyenne trees in Parks, Streets, and Citywide.
Species Name Ponderosa/Austrian pine Blue spruce Common chokecherry Crabapple Juniper species Pine Hackberry Pinyon pine Green ash Honeylocust Cottonwood/poplar Siberian elm
Park RPI 2.45 1.95 3.09 2.07 1.36 2.36 1.53 1.75 2.06 2.37 1.17 0.20
ROW RPI 0.86 0.90 0.36 0.62 1.06 0.60 0.78 0.44 0.32 0.56 0.26 0.07
Citywide RPI 2.23 1.78 1.51 1.35 1.26 1.22 1.09 1.07 0.82 0.78 0.63 0.11
Appendix C lists the RPI for all species included in the 1992 inventory. Although less abundant, other high performing species include Littleleaf linden (Tilia cordata), Red oak (Quercus rubra),
26
Eastern red cedar (Juniperus virginiana), and Cherry (Prunus sp.). The Linden and Oak are particularly important because they represent larger growing trees that could contribute to increasing future benefits. Few of these trees are fully mature, yet the potential they show for contributing to canopy cover and leaf area is noteworthy. For example, In the 12-18 inch DBH classes Linden and Oak in the 12-18 inch dbh size class produce 50 and 57% more leaf area, respectively, than same-sized Cottonwoods. There are additional large- growing species wellsuited to Cheyenne’s climate that can be planted to replace the aging Cottonwood and Siberian elm population. These include American linden (Tilia americana), Hackberry, Bur Oak (Quercus macrocarpa), and perhaps new Dutch elm disease resistant cultivars of American elm, all species the Cheyenne UFD currently encourages homeowners to plant.
TREE CANOPY The combined street and park tree canopy was estimated at over 9 million ft2 (86.6 ha). Given a city area of 22.87 mi2 (59.23 km2 ), canopy specific to street trees alone covered over 6 million acres (~57.0 ha) and shaded 1.82% of Cheyenne’s paved streets. Park trees shaded an additional 0.7 % of streets. These calculations assumed that 24% of all tree canopy cover was shading street surfaces, there were 339.7 miles of street, and the average curb-to-curb distance was 45 ft (Maco and McPherson 2002). Research in Davis CA showed that by shading asphalt surfaces and parked vehicles the trees reduce hydrocarbon emissions from gasoline that evaporates out of leaky fuel tanks and worn hoses (Scott et al. 1999). These evaporative emissions are a principal component of smog, and parked vehicles are a primary source.
The additional benefits of shade provided by canopy cover include offsetting pavement management costs by protecting paving from weathering. The asphalt paving on streets contains
27
stone aggregate in an oil binder. Tree shade lowers the street surface temperature and reduces the heating and volatilization of the oil. As a result, the aggregate remains protected for a longer period by the oil binder. When unprotected, vehicles loosen the aggregate and much like sandpaper, the loose aggregate grinds down the pavement (Brusca 1998).
LOCATION & OTHER FEATURES The majority of the 8,901 street trees in Cheyenne were located in planting strips. Our sample estimated that 74% of these trees were adjacent to single family residential land uses and others were on commercial/industrial (16%), multi- home residential (5%), and other land uses (4%, institutional, vacant, or agricultural use). The 8,103 publicly managed park trees included an estimated 20.7% on golf courses, 13.5% in cemeteries, 5.4% on street islands, medians and triangles, and 60.5% in parks.
The correct placement of trees – choosing the right tree for the right location – can decrease the costs associated with the care and maintenance. Properly placed trees have adequate space to grow with reduced potential for infrastructure (e.g., sidewalks), utility line or visibility conflicts. Table 8 shows the number of trees in each of six placement categories based on a tree’s suitability and appropriateness for its location. Proximity to utilities, sidewalks and structures plus the tree’s purpose and visual impact were used for rating. With nearly 85% of the trees located in fair or better locations, the majority of trees were well placed in Cheyenne. Tree placement tended to be poorer along streets, where trees were confined to planting strips, compared to park tree placement. About 24% of street trees were in locations rated poor or worse. Over half (53%) of these 2,112 trees were Cottonwood and Siberian elm.
28
Table 8. Placement ratings for street and park trees (no. of trees). Management Street ROW Parks Citywide % of tot
Liability 1 1 0.01
Very Poor 224 44 1.58
Poor 1,887 462 13.81
Fair 4,519 2,124 39.05
Good 2,275 4,614 40.50
Excellent 1 858 5.05
MAINTENANCE NEEDS Understanding species distribution, age structure, and tree condition may aid in determining proper pruning cycle length, but it is important to understand the actual pruning and maintenance needs of the city trees. Not only will this provide clues to whether or not the pruning is adequate, but what level of risk and liability is associated with the city’s street tree population.
Citywide, 5,564 trees, or about 33% of the tree population, required maintenance in the form of removal, general or safety pruning (Fig. 4). Street trees accounted for nearly 80% of all trees requiring maintenance and park trees accounted for the remaining 20%. Nearly half of all street trees (4,410 or 49.5%) required maintenance, compared to only 14% of all park trees (1,154). Maintenance Needs 25%
% of trees
20% 15% 10% 5% 0% Removal
General
Street ROW
Safety
Parks
Figure 4. Percent of the total street and park tree population with maintenance needs.
29
General Pruning A general pruning implies trees that are maintained to promote continued good health and performance. This type of pruning includes crown cleaning and thinning, removal of epicormic sprouts, and pruning for clearance or to maintain the structural integrity of the tree. Overall, 3,693 (22%) of the trees needed general pruning. Privately maintained street trees alone accounted for 79% of the trees needing pruning (2,930 trees) with the remaining 21% (763 trees) being park trees. The park tree population was markedly better maintained than street trees.
Safety and Removals A safety prune implies remedy for hazardous tree conditions. Trees requiring removal indicate severe problems, although these are not necessarily related to safety hazards. Numbers may simply reflect dead or dying newly planted trees, or they may reflect unmanageable tree defects and hazards. Regardless, trees classified as needing removal and replacement detract from aesthetic appearance at best, and represent substantial costs or public safety hazards at worst. Over three-quarters of the 1,480 trees along Cheyenne streets requiring removal or safety pruning consisted of these five species: Siberian elm (29.4%), Cottonwood (24%), Boxelder maple (11.4%), Green ash (8.3%), and Blue spruce (3.5%).
Park trees determined to need removal (373) or safety pruning (18) were nearly four- fold fewer than street trees, with the top five species accounting for 67% of all trees in this category: Siberian elm (23%), Cottonwood (19%), Blue spruce (12%), Green ash (Fraxinus pennsylvanica) (7%), and Ponderosa pine (6%). Since the 1992 inventory, the UFD has established a programmed park tree maintenance program, systematically pruning and maintaining park trees. Program accomplishments are shown in Table 9.
30
Table 9. Park tree maintenance accomplishments since the 1992 inventory. Year 1992 1993 1994 1995 1996 1997 1998 1999 2000 2001 2002 Totals
Maintenance Accomplishments, 1992-2002 Pruned Removed Purchased & Planted Spaded & Replanted n/a n/a 350 * 300 1100 n/a 75 200 1000 n/a 75 200 1500 25 140 n/a 1200 20 300 200 1500 12 190 100 1500 70 660 160 1361 125 275 99 1217 48 281 46 1454 135 163 156 1041 235 538 160 12873 670 3047 1621 *110 cost-shared w/business
31
C HAPTER T H R E E —C OSTS OF M ANAGING C HEYENNE ’ S M UNICIPAL T REES
FISCAL YEAR 2001-2002 PROGRAM EXPENDITURES
Costs of Managing Public Trees Costs were based on a review of expenditures during fiscal year 2001 and adjusted to reflect per tree expenditures for the 1992 municipal tree inventory. The 2001 operating budget for the Cheyenne Urban Forest Division Tree Program was $469,207, with no abnormal expenditures recorded during the year (Olson and Overstreet 2002). This amount represented 0.67% of the city’s total 2001 operating budget ($69,889,724). An additional $5,000 was spent on tree-related matters by other city departments for storm cleanup. Overall, $474,207, or $8.95 per capita, was spent on management of Cheyenne’s municipal urban forest. The 2002 estimated municipal tree total was 24,600 (Olson and Overstreet 2002) with expenditures per tree of $19.28 (Table 10). The per tree expenditure was similar to the 1997 mean value of $19 per tree reported for 256 California cities (Thompson and Ahern 2000) and a third less than the $29.91 per tree spent in nearby Fort Collins, Colorado (McPherson et al. 2004). Assuming the same per tree expenditure for the 17,010 trees listed in the 1992 municipal tree inventory, we estimated total municipal tree expenditures at $327,897 (17,010 x $19.28) or $6.19 per capita for the 1992 inventory. Forestry Division expenditures fell into three categories: tree planting and establishment, mature tree care, and administration.
32
Table 10. Cheyenne annual expenditures in 2001. Program Expenditures City Pruning $122,460 Planting $66,400 Removals $33,750 Inspection $11,000 Pest & Disease $7,300 Administration/Other $91,800 Irrigation $136,497 Total Program Expenditures $469,207 Non-Program Expenditures Storm/Litter Clean-Up $5,000 Grant Total Expenditures $474,207
Tree Planting and Establishment The production of quality nursery stock, its subsequent planting, and follow-up care are critical to perpetuation of a healthy urban forest for Cheyenne. Trees not produced in the city nursery are obtained from reputable growers. Typically, homeowners obtain trees from local nurseries. Over the past five years, the UFD planted and established an average of about 500 park trees each year, 90% at new sites and 10% as replacements for removed trees. Costs are typically about $475 per tree, including $200 for a purchased tree, $83 for planting, and $192 for establishment watering. These activities consume 14% of the 2001 tree program budget, or $66,400. Future planting costs should be significantly reduced because the UFD is switching from planting balland-burlap (B & B) trees to bareroot (BR), reducing tree cost by 75% to $50.
Approximately 1,100 small trees are pruned annually for structure and form. The majority of these are recently planted trees receiving a training prune ($8/tree); the remainder are small tree prunings at a cost of $28/tree (Overstreet 2004).
About 1,000 street trees and 1,800 park trees are watered an average of 16 times annually. About 85% of the water is drafted from Absarraca Lake. At a cost of $2.40 per thousand gallons, the
33
use of this treated wastewater rather than the potable city system water represents a significant savings to the city, particularly during drought years. The wastewater costs the city about $0.05 per tree per week, and the water truck costs $3 per tree per watering. Total annual watering costs constitute a budget expenditure of $136,497 (29.8%) or $48.75 per tree. This amount varies significantly depending upon annual precipitation. Irrigation costs over the past 5 years have been higher than normal due to drought. With increased precipitation this year, irrigation costs could be significantly lower.
Mature Tree Care Cheyenne’s urban forest contains many mature and old trees so it is not surprising that about 36% ($167,200) of the 2001 tree program’s budget was spent keeping these trees healthy and safe. Pruning, tree removal, and inspection accounted for most of this amount. Approximately $122,460 was spent for programmed pruning in the parks. The Division removes about 140 trees each year (based on the past 5 years) at a cost of $33,750 (includes stump removal).
Mature tree care for street trees is dependent upon adjacent property owners. Inspection time for answering service requests, public education, and plan review adds up to $11,000 annually. If the Division determines that a street tree needs pruning or removal, the property owner is notified. After 30 days, the tree is re- inspected and if work has not been completed the property owner is served a second notice. Subsequent non-compliance results in the Division putting the work out to bid, selecting the low bid, and then billing the property owner. For low- and moderate- income homeowners, Community Development Block Grant (HUD) funds are available to provide financial assistance for removing trees that are hazardous along street rights-of-way and planting new trees.
34
Pest infestations can pose a serious threat to the health and survival of susceptible tree species, and drip from insects is a nuisance to residents. The 2001 pest and disease control expenditures totaled $7,300 for treatments to control spider mites, ash borers, elm scale, and other pests.
Cleanup after storms occurs on a periodic basis. Approximately $5,000 was spent in 2001 and no more than that sum is typically spent annually.
Administration Approximately 19% of all program expenditures were for administration, totaling $91,800. This item accounted for salaries and benefits of supervisory staff that performed planning and management functions, as well as contract development and supervision.
35
C HAPTER F O U R —B ENEFITS OF C HEYENNE M UNICIPAL T REES
INTRODUCTION Estimates of benefits and costs are initial approximations—as some benefits and costs are intangible or difficult to quantify (e.g., impacts on psychological health, crime, and violence). Also, limited knowledge about the physical processes at work and their interactions make estimates imprecise (e.g., fate of air pollutants trapped by trees and then washed to the ground by rainfall). Tree growth and mortality rates are highly variable and benefits and costs depend on the specific conditions at the site (e.g., tree species, growing conditions, maintenance practices). Therefore, this method of quantification was not intended to account for every benefit or penny. Rather, this approach was meant to be a general accounting of the benefits produced by municipal trees in Cheyenne; an accounting with an accepted degree of uncertainty that can nonetheless, provide a platform on which decisions can be made (Maco 2003). Methods used to quantify and price these benefits are described in Appendix B.
ENERGY SAVINGS Trees modify climate and conserve building-energy use in three principal ways: 1. Shading—reduces the amount of radiant energy absorbed and stored by built surfaces. 2. Transpiration—converts moisture to water vapor and thus cools by using solar energy that would otherwise result in heating of the air. 3. Wind speed reduction—reduces the infiltration of outside air into interior spaces and conductive heat loss where thermal conductivity is relatively high (e.g., glass windows) (Simpson 1998).
36
Trees and other greenspace within individual building sites may lower air temperatures 5°F (3°C) compared to outside the greenspace (Chandler 1965). At the larger scale of urban climate (6 miles or 10 km square), temperature differences of more than 9°F (5°C) have been observed between city centers and more vegetated suburban areas (Akbari et al. 1992). The relative importance of these effects depends on the size and configuration of trees and other landscape elements (McPherson 1993). Tree spacing, crown spread, and vertical distribution of leaf area influence the transport of cool air and pollutants along streets and out of urban canyons. Appendix B provides additional information on specific areas of contribution trees make toward energy savings.
ELECTRICITY AND NATURAL GAS RESULTS Electricity and natural gas saved annually in Cheyenne from both shading and climate effects totaled 1,175 MWh and 21,370 Mbtu, respectively, for a total retail savings of $186,986 (Table 1) or a citywide average of $10.99/tree. Savings per tree for park trees were smaller than for street trees, averaging $7.51/tree compared to $14.15/tree for street trees, reflecting the fact that park trees provide only climate benefits, while street trees provide both shade and climate benefits.
37
Table 11. Net annual energy savings produced by Cheyenne municipal trees. Tree Electricity Natural Species (MWh) Gas (Mbtu) Cottonwood/poplar 481 8,254 American elm 35 590 Silver maple 23 387 Hackberry 18 320 Siberian elm 183 3,125 Willow 29 616 Honeylocust 67 1,217 Boxelder maple 39 665 Green ash 99 1,834 Birch 4 69 Crabapple 13 287 Blue spruce 68 1,493 Ponderosa/Austrian pine 52 1,197 Fir 1 20 Russian olive 2 48 Common chokecherry 2 55 Quaking aspen 2 41 Pinyon pine 1 19 Pine 2 47 Juniper species 2 44 Other Street Trees 35 631 Other Park Trees 19 411 Street Tree Total 827 13,718 Park Tree Total 348 7,652 Grand Total 1,175 21,370
Total ($) 74,459 5,387 3,566 2,815 28,270 4,940 10,670 6,019 15,867 595 2,257 11,919 9,282 151 375 422 326 152 364 337 5,542 3,271 126,116 60,870 186,986
% of Total $ 39.8 2.9 1.9 1.5 15.1 2.6 5.7 3.2 8.5 0.3 1.2 6.4 5.0 0.1 0.2 0.2 0.2 0.1 0.2 0.2 3.0 1.7 67.4 32.6 100.0
Avg. $/tree 21.47 23.84 19.59 14.29 13.75 14.93 13.56 14.50 11.68 6.39 4.14 5.47 5.43 1.73 2.47 1.33 1.40 0.66 1.21 0.77 5.73 4.44 14.16 7.51 10.99
In general, larger trees produced larger benefits. Differences in benefits between life forms (evergreen, deciduous, conifer) were dramatic, with large deciduous street trees producing nearly six times the benefit of large coniferous street trees (Table 12). Large park conifers produced roughly half the energy benefits of the large park deciduous trees. Energy benefits associated with conifers adjacent to homes were lower because the detrimental effect of their winter shade on heating costs outweighed their wind reduction benefit. Conversely, the higher park benefit illustrates the benefit of wind speed reduction by non-deciduous species not associated with residential homes. Table 12. Average per tree energy benefit ($) by tree type. Tree Type Lg. Deciduous Med. Deciduous Sm. Deciduous Lg. Conifer Sm. Conifer Citywide Total
Street 18.10 2.91 3.90 3.12 0.56 14.16
38
Park 11.84 2.29 2.44 5.41 0.86 7.51
ATMOSPHERIC CARBON DIOXIDE REDUCTIONS Urban forests can reduce atmospheric CO2 in two ways: 1. Trees directly sequester CO2 as woody and foliar biomass while they grow. 2. Trees near buildings can reduce the demand for heating and air conditioning, thereby reducing emissions associated with electric power production. On the other hand, CO2 is released by vehicles, chain saws, chippers, and other equipment during the process of planting and maintaining trees. Eventually, all trees die and most of the CO2 that has accumulated in their woody biomass is released into the atmosphere through decomposition unless recycled.
As Table 13 shows, the amount of CO2 benefits produced is dependent on species present and their age. Citywide, park tree reduction of energy plant CO2 emissions and net sequestration rates were equivalent at 332 tons each or 664 total tons at a value of $9,960. Cottonwood (31.6%) and Table 13. Net CO2 reductions of Cheyenne street and park trees. Tree Species Cottonwood/poplar American elm Silver maple Hackberry Siberian elm Willow Honeylocust Boxelder maple Green ash Birch Crabapple Blue spruce Ponderosa/Austrian pine Fir Russian olive Common chokecherry Quaking aspen Pinyon pine Pine Juniper species Other Street Trees Other Park Trees Street Tree Total Park Tree Total Grand Total
Total lb 1,423,723 91,526 77,019 43,206 689,515 84,624 175,748 107,560 318,873 12,268 39,034 471,056 136,930 5,050 6,829 7,096 6,623 2,135 5,843 4,878 108,193 65,489 2,556,671 1,327,957 3,884,628
Total $ 10,678 686 578 324 5,171 635 1,318 807 2,392 92 293 3,533 1,027 38 51 53 50 16 44 37 811 491 19,175 9,960 29,135
39
% of Total $ 36.7 2.4 2.0 1.1 17.7 2.2 4.5 2.8 8.2 0.3 1.0 12.1 3.5 0.1 0.2 0.2 0.2 0.1 0.2 0.1 2.8 1.7 65.8 34.2 100.0
Avg. $/tree 3.08 3.04 3.17 1.64 2.52 1.92 1.67 1.94 1.76 0.99 0.54 1.62 0.60 0.44 0.34 0.17 0.21 0.07 0.15 0.08 0.84 0.67 2.15 1.23 1.71
Blue spruce (30.1%) accounted for over 61% of the CO2 benefits produced by park trees. Park tree species with the highest per tree savings were Cottonwood ($2.20), Willow ($1.92), Siberian elm ($1.76), Blue spruce ($1.64), and Hackberry ($0.80). Street trees had an annual net sequestration rate of approximately 491 tons and reduced emissions by another 788 tons for a total savings of $19,175. The combination of these park and street tree savings was valued at $29,135 annually. On average, CO2 benefits for street trees were 75% higher than park trees on a per tree basis.
Citywide, the total reduced CO2 emissions (1120 t) were 36% greater than total sequestered CO2 (823 t). Avoided emissions are extremely important in Cheyenne because fossil fuels are the primary energy source. These fuels have a relatively high CO2 emission factor. Further, Cheyenne’s climate is extreme in winter due to low temperatures and high winds, resulting in higher heating loads compared to Fort Collins, Colorado, 45 miles south of Cheyenne and sheltered by the Rocky Mountains.
AIR QUALITY IMPROVEM ENT Urban trees provide air quality benefits in five main ways: 1. Absorbing gaseous pollutants (ozone, nitrogen oxides) through leaf surfaces. 2. Intercepting particulate matter (e.g., dust, ash, dirt, pollen, smoke) 3. Reducing emissions from power generation by limiting building energy consumption 4. Releasing oxygen through photosynthesis 5. Transpiring water and shading surfaces, which lowers local air temperatures, thereby reducing ozone levels.
40
In the absence of the cooling effects of trees, higher air temperatures contribute to ozone formation. Most trees emit various biogenic volatile organic compounds (BVOCs) such as isoprenes and monoterpenes that can contribute to ozone formation. The ozone forming potential of different tree species varies considerably (Benjamin and Winer 1998). A computer simulation study for the Los Angeles basin found that increased tree planting of low BVOC emitting tree species would reduce ozone concentrations and exposure to ozone, while planting of medium- and high-emitters would increase overall ozone concentrations (Taha 1996). High emitters of BVOCs (> 10 ug/g/hr) in Cheyenne are Cottonwood, Blue spruce, and Ponderosa/Austrian pine.
Deposition and Interception Result Pollutant uptake by tree foliage (pollution deposition and particulate interception) in Cheyenne was 2.3 tons of combined uptake at a total value of $8,429 or $0.50/tree. Cottonwood alone accounted for 51% of this amount and street tree uptake was over two times the amount of park tree uptake. Ozone and small particulate matter (PM10 ) represented 54% and 24% the largest savings associated with deposition and interception. The filtering of airborne dirt and dust particles is a noteworthy benefit to Cheyenne residents and one of the reasons trees and windbreaks were originally established on the prairie.
Avoided Pollutants and BVOC Emissions Result Park trees emitted BVOC at a slightly higher rate than street trees, averaging 0.50 lbs/tree and 0.42 lbs/tree, respectively. This difference can be attributed to the larger size and number of high emitting conifers in the park population (4,019 conifers) compared to the street tree population (1,264 conifers). Cheyenne’s highest emitters included Cottonwood (1.27 lbs/tree), Blue spruce (0.86 lbs/tree), Willow (0.86 lbs/tree) and Ponderosa/Austrian pine (0.36 lbs/tree). Essentially,
41
all of Cheyenne’s predominant tree species were higher emitting, but their effect was counteracted by the fact that trees near buildings reduce the demand for heating and airconditioning. This reduction in demand results in less energy consumption, thereby avoiding the hydrocarbon emissions associated with the use of fossil fuels as a primary energy source. As a result, annual avoided pollutant emissions at power plants minus BVOC emissions totaled 3.1 tons for a benefit of $3,480 or over $0.20/tree.
Net Air Quality Improvement Cheyenne’s municipal forest produced annual air quality benefits valued at $11,909 ($0.70/tree) by removing 5.4 tons of pollutants from the atmosphere (Table 14). Net air quality savings were primarily due to pollutant uptake, particularly for street trees. Higher BVOC emissions for park trees cancelled out much of the pollutant uptake benefit, resulting in an average savings of only $0.02/tree compared to $1.32/tree for street trees. Low deposition rates coupled with higher BVOC emissions resulted in a net cost for three conifers – Blue spruce ($1.00/tree), Fir (Abies species, $0.25/tree) and Pine ($0.03/tree). Trees producing the greatest benefit included American elm ($3.31), Silver maple ($2.47), Siberian elm ($1.94), and Hackberry ($1.75).
42
Table 14. Net air quality benefits for all street and park trees. Tree Species Cottonwood/poplar American elm Silver maple Hackberry Siberian elm Willow Honeylocust Boxelder maple Green ash Birch Crabapple Blue spruce Ponderosa/Austrian pine Fir Russian olive Common chokecherry Quaking aspen Pinyon pine Pine Juniper species Other Street Trees Other Park Trees Street Tree Total Park Tree Total Grand Total
Total lb 3618 525 326 246 2775 140 942 492 1380 46 176 -844 276 -8 31 34 19 6 3 12 -98 -36 9363 1375 10737
Total $ 3347 747 450 344 3982 73 1316 656 1940 62 251 -2171 156 -22 47 49 24 6 -9 10 380 229 11730 179 11909
% of Total $ 28.1 6.3 3.8 2.9 33.4 0.6 11.1 5.5 16.3 0.5 2.1 -18.2 1.3 -0.2 0.4 0.4 0.2 0.0 -0.1 0.1 3.2 1.9 98.5 1.5 100.0
Avg. $/tree 0.97 3.31 2.47 1.75 1.94 0.22 1.67 1.58 1.43 0.66 0.46 -1.00 0.09 -0.25 0.31 0.16 0.10 0.02 -0.03 0.02 0.39 0.31 1.32 0.02 0.70
STORM-WATER RUNOFF REDUCTIONS Urban storm-water runoff is an increasing concern as a significant pathway for contaminants entering local streams, lakes and reservoirs. In effort to protect threatened fish and wildlife, storm-water management requirements are becoming increasingly broad, stringent, and costly; cost-effective means of mitigation are needed. Healthy urban trees can reduce the amount of runoff and pollutant loading in receiving waters in three primary ways: 1. Leaves and branch surfaces intercept and store rainfall, thereby reducing runoff volumes and delaying the onset of peak flows. 2. Root growth and decomposition increase the capacity and rate of soil infiltration by rainfall and reduce overland flow. 3. Tree canopies reduce soil erosion and surface transport by diminishing the impact of raindrops on barren surfaces.
43
The ability of Cheyenne’s municipal trees to intercept rain was estimated at 5,686,650 gallons (760,191 ft 3 ) annually (Table 15). The total value of this benefit to the city was $55,301 when all trees were considered. Street tree interception (498,143 ft3 ) was 90% greater than park tree interception (262,048 ft3 ). This difference is attributable to the larger amount of leaf surface area associated with the street tree population; where species accounting for more than 1% of the population had over 26.5 M ft2 of leaf area compared to less than 17 M ft2 in parks. Average per tree values for street trees ranged from $0.13 to $6.59, averaging $3.25, based on 334 gallons per tree intercepted. This average per tree value was low compared to Fort Collins, Colorado where an average annual benefit of $13.04/tree was returned. Cheyenne’s trees, on average, had only 15% less leaf area and 12% more crown projection area than Fort Collins’ trees; the more than three- fold difference between Cheyenne and Fort Collins in dollars saved does not reflect the rainfall interception capacity of Cheyenne’s trees but is a function of the lower estimated price of rainfall intercepted and has a substantial influence on interception benefits. Prices are highly variable among cities and reflect local willingness to pay for storm- water management. Thus, if a community chooses to provide little funding for storm-water collection and treatment programs, the interception benefit is less.
44
Table 15. Annual storm-water reduction benefits of Cheyenne street and park trees by species. Tree Species Cottonwood/poplar American elm Silver maple Hackberry Siberian elm Willow Honeylocust Boxelder maple Green ash Birch Crabapple Blue spruce Ponderosa/Austrian pine Fir Russian olive Common chokecherry Quaking aspen Pinyon pine Pine Juniper species Other Street Trees Other Park Trees Street Tree Total Park Tree Total Grand Total
Rainfall Intercept. (gal) 2,347,750 143,957 123,252 69,614 945,476 151,565 228,798 157,849 460,063 9,763 35,316 475,620 238,220 5,402 9,398 14,262 7,166 3,184 11,327 7,488 144,587 96,594 3,726,383 1,960,267 5,686,650
Total $ 22,831 1,400 1,199 677 9,194 1,474 2,225 1,535 4,474 95 343 4,625 2,317 53 91 139 70 31 110 73 1,406 939 36,238 19,063 55,301
% of Total $ 41.3 2.5 2.2 1.2 16.6 2.7 4.0 2.8 8.1 0.2 0.6 8.4 4.2 0.1 0.2 0.3 0.1 0.1 0.2 0.1 2.5 1.7 65.5 34.5 100.0
Avg. $/tree 6.58 6.19 6.59 3.44 4.47 4.45 2.83 3.70 3.29 1.02 0.63 2.12 1.35 0.60 0.60 0.44 0.30 0.13 0.37 0.17 1.45 1.27 4.07 2.35 3.25
When averaged throughout the entire street tree population, certain species were much better at reducing storm-water runoff than others. Leaf type and area, branching pattern and bark, as well as tree size and shape all affected the amount of precipitation trees can intercept and hold to avoid direct runoff. Trees in Cheyenne such as Cottonwood, Silver maple, American and Siberian elm performed this function very well, while Pinyon and Juniper species were among the worst performers.
PROPERTY VALUES AND OTHER BENEFITS The estimated total annual benefit associated with property value increase was approximately $403,000, or $24/tree on average (Table 16). This value was about half that for trees in Fort Collins, not surprising because median home prices greatly influence the average annual dollar savings and Fort Collins had nearly twice the median home price of Cheyenne. Street trees in Cheyenne were responsible for 56% of the $403,000 benefit. Generally, street trees are assumed to have a greater impact on property values than park trees; however, the proximity of multi- use
45
parks and greenbelts may also contribute to an increase in property values of entire neighborhoods. Table 16. Total annual increases in property value from Cheyenne street trees by species. Tree Species Cottonwood/poplar American elm Silver maple Hackberry Siberian elm Willow Honeylocust Boxelder maple Green ash Birch Crabapple Blue spruce Ponderosa/Austrian pine Fir Russian olive Common chokecherry Quaking aspen Pinyon pine Pine Juniper species Other Street Trees Other Park Trees Street Tree Total Park Tree Total Grand Total
Total $ 106,086 9,852 5,972 7,652 61,938 8,764 16,291 11,163 29,727 779 8,092 53,854 31,982 1,037 2,625 6,286 2,597 762 4,110 1,748 19,435 11,971 224,577 178,146 402,723
% of Total Tree 20.4 1.3 1.1 1.2 12.1 1.9 4.6 2.4 8.0 0.5 3.2 12.8 10.1 0.5 0.9 1.9 1.4 1.4 1.8 2.6 5.7 4.3 52.4 47.6 100.0
% of Total $ 26.3 2.4 1.5 1.9 15.4 2.2 4.0 2.8 7.4 0.2 2.0 13.4 7.9 0.3 0.7 1.6 0.6 0.2 1.0 0.4 4.8 3.0 55.8 44.2 100.0
Avg. $/tree 30.59 43.59 32.81 38.84 30.13 26.48 20.70 26.90 21.89 8.37 14.85 24.70 18.70 11.92 17.27 19.89 11.15 3.30 13.70 3.98 20.10 16.24 25.21 21.99 23.68
Tree species adding the largest amount of leaf area over the course of a year tend to produce the highest average annual benefit. American elm ($44/tree), and Hackberry ($39/tree) were on the high end, while Pinyon pine ($3/tree), Juniper species ($4/tree), Birch ($8/tree) and Quaking aspen ($11/tree) averaged the least benefits (Table 16). Large, fast-growing species tend to be associated with increased higher annual returns. Although species such as Quaking aspen may be considered fast growing, the higher mortality rate (shorter life span) coupled with lower leaf area and poorer condition negates their overall impact.
TOTAL ANNUAL NET BENEFITS AND BENEFIT-COST RATIO (BCR) Total annual benefits produced by Cheyenne’s street and park trees were estimated to have a value of $686,000, about$40/tree and $13/resident. Street trees produced benefits valued at
46
nearly $418,000 ($47/tree, $8/capita), while park tree benefits were valued at about $268,000 ($34/tree, $5/capita [Table 17]. The Cheyenne municipal forest returned $2.09 to the community for every $1 spent on their management. Street trees contributed $1.27 of this amount, with park trees contributing the remaining $0.82. Table 17. Benefit-Cost summary with high and low estimates based on population standard error. Street Park All Benefit Total ($) $/capita $/tree Total ($) $/capita $/tree Total ($) $/capita $/tree Energy 126,116 2.38 14.16 60,870 1.15 7.51 186,986 3.53 10.99 CO2 19,175 0.36 2.15 9,960 0.19 1.23 29,135 0.55 1.71 Air Quality 11,730 0.22 1.32 179 0.00 0.02 11,909 0.22 0.70 Stormwater 36,238 0.68 4.07 19,063 0.36 2.35 55,301 1.04 3.25 Environmental Subtotal 193,259 3.65 21.70 90,072 1.70 11.12 283,331 5.34 16.66 Property Increase 224,372 4.23 25.19 178,351 3.36 22.41 402,723 7.60 23.68 Total benefits 417,631 7.88 46.89 268,423 5.06 33.52 686,054 12.94 40.33 Total costs 327,897 6.19 19.28 Net benefits 358,157 6.76 21.06 Benefit-cost ratio 2.09 2.09 2.09
Cheyenne municipal trees have beneficial effects on the environment. Approximately 41% of the annual benefits were attributed to environmental values. Energy savings were 68% of this value, a substantial sum of about $11 per tree. Benefits associated with storm- water runoff reduction represented 21% ($3.25/tree) of the total benefits, with carbon dioxide reductions ($1.71/tree) and air quality benefits ($0.70/tree) accounting for the remaining 11% of estimated total annual benefits. As in most cities, annual increases in property value were the largest benefit produced by trees in Cheyenne.
While species vary in their ability to produce benefits, common characteristics of trees within tree-type classes aid in identifying the most beneficial street trees in Cheyenne (Figure 5). As is typical in most cities, Cheyenne’s larger trees – deciduous and conifer -- generally produced the most benefits. The anomaly was small-stature deciduous trees; for total benefits, these trees provided a higher average return for the investment dollar than medium deciduous trees. This was primarily due to increased property value benefits associated with leaf area and total tree
47
numbers. Medium-size trees were few and predominantly young; over 300 of the 402 were less than 6” dbh. Over half were Quaking aspen with less leaf area than the many mature small trees. There were 1,543 small trees, 1,262 at than 6” dbh.
Where environmental benefits are the primary concern, large deciduous trees provided the highest level of average benefits in Cheyenne. Large conifers in parks provided more environmental benefits than those on streets, with higher savings associated with heating, rainfall interception and CO2 . Small conifers produced the fewest benefits of all tree types, with park trees again providing more environmental benefits than street trees ($1.16 vs. $0.76/tree). Park Trees
60.00
60.00
50.00
50.00
Avg. annual benefit ($)
40.00 30.00 20.00 10.00
Stormwater 30.00 Air Quality 20.00 CO2 10.00 Energy
Energy
CO2
Air Quality
Sm .C on ife r
Lg .C on ifer
Sm .D ec idu ou s
Sm .C on ife r
Lg .C on ife r
0.00 Sm .D ec idu ou s
Lg .D ec idu ou s M ed .D ec idu ou s
0.00
40.00 Property
Lg .D ec idu ou s Me d. De cid uo us
Avg. annual benefit ($)
Street Trees
Stormwater
Property
Figure 5. Average annual street and park benefits per tree by tree types.
Average annual benefits increased from $20/tree for small trees to $89/tree for large trees (Fig. 6). Property values and aesthetic benefits were most important for young trees because the result is influenced by growth rate, particularly the annual increase in leaf area. Conversely, stormwater runoff reduction benefits were greatest for older trees because leaf area and crown diameter influence rainfall interception. Energy benefits also increased, with larger crowns and leaf area providing more heating and cooling savings to residences.
48
Average annual benefit per tree ($)
Citywide Trees
100 90 80 70 60 50 40 30 20 10 0 0-3
Property
3-6
6-12 12-18 18-24 24-30 30-36 36-42
Stormwater
Tree dbh (inches) Air Quality CO2
42+
Energy
Figure 6. Average annual benefits per tree by dbh size classes.
Table 18 shows the distribution of total annual benefits in dollars for the predominant street and park species in Cheyenne. Cottonwood and Siberian elm, accounting for 33% of the tree population, produced nearly 48% of all benefits. Two additional species -- Blue spruce and Green ash -- provided another 18% of the benefits. Together, these four species represent 53% of the total population but produce 66% of the benefits (Fig. 7). Ponderosa pine (6%) and Honeylocust (5%) are also important produces of benefits.
49
Table 18. Total annual benefits ($) for predominant street and park trees in Cheyenne. Species Cottonwood American elm Silver maple Hackberry Siberian elm Willow Honeylocust Boxelder maple Green ash Birch Crabapple Blue spruce Ponderosa pine Fir Russian olive Chokecherry Quaking aspen Pinyon pine Pine Juniper species Other Street Trees Other Park Trees Street Tree Total Park Tree Total Total
Energy 74,459 5,387 3,566 2,815 28,270 4,940 10,670 6,019 15,867 595 2,257 11,919 9,282 151 375 422 326 152 364 337 5,542 3,271 126,116 60,870 186,986
CO2 10,678 686 578 324 5,171 635 1,318 807 2,392 92 293 3,533 1,027 38 51 53 50 16 44 37 811 491 19,175 9,960 29,135
Air Quality 3,347 747 450 344 3,982 73 1,316 656 1,940 62 251 (2,171) 156 (22) 47 49 24 6 (9) 10 380 229 11,730 179 11,909
Stormwater 22,831 1,400 1,199 677 9,194 1,474 2,225 1,535 4,474 95 343 4,625 2,317 53 91 139 70 31 110 73 1,406 939 36,238 19,063 55,301
Property 106,086 9,852 5,972 7,652 61,938 8,764 16,291 11,163 29,727 779 8,092 53,854 31,982 1,037 2,625 6,286 2,597 762 4,110 1,748 19,435 11,971 224,372 178,351 402,723
Total 217,402 18,073 11,764 11,813 108,555 15,885 31,821 20,181 54,400 1,622 11,235 71,760 44,763 1,256 3,190 6,949 3,066 966 4,619 2,205 45,341 24,414 417,632 268,423 686,055
% Total 31.7 2.6 1.7 1.7 15.8 2.3 4.6 2.9 7.9 0.2 1.6 10.5 6.5 0.2 0.5 1.0 0.4 0.1 0.7 0.3 6.6 3.6 60.87 39.13 100.00
The 6300 small, young trees (3 6
30 -36
24 -30
18 -24
12 -18
6-1 2
0-6
Park Trees
DBH Class (in)
(
). This distribution
suggests that the strong program the UFD has in place for young tree care as well as the targeted maintenance for functionally maturing park trees is right on target. These priorities will insure that young trees will transition through their lifecycle in good health, minimizing the resources needed to maintain them, while functionally mature trees will perform at their peak to compensate for their lack in number. Park trees are providing the significant benefits they are to the community because they are well managed. The concern and challenge for Cheyenne rests with the street trees – where an equally strong maintenance program is needed but does not currently exist.
57
RESOURCE EXTENT Canopy cover, or more precisely the amount and distribution of leaf surface area, is the driving force behind the urban forest’s ability to produce benefits for the community. As canopy cover increases, so do the benefits afforded by leaf area. It is important to remember that street trees throughout the US—and those of Cheyenne—likely represent less than 10% of the entire urban forest (Moll and Kollin 1993). In other words, the benefits Cheyenne residents realize from all urban vegetation is far greater than the values found through this analysis. But due to their location and conflicts, street trees are typically the most expensive component to manage. The City of Cheyenne invests only $11,000 per year for street tree inspection and irrigation ($1.23/tree; $0.21/capita). It is unknown what amount residents expend on tree maintenance, but maximizing the return on the total investment is contingent upon maximizing and maintaining the canopy cover of these trees.
Increasing the street tree canopy cover requires a multifaceted approach in Cheyenne. Plantable spaces must be filled and use of large stature trees must be encouraged wherever feasible. In 1992 there were nearly 6,300 available street tree planting spaces in the city. The current estimate is that there are 5,600 empty planting basins available (Olson and Overstreet 2003). To encourage increasing the flow of tree-provided benefits over time, sites for large street trees should be planted first wherever possible, followed by those for medium and then small trees. As large, brittle trees like Siberian elm and Cottonwood are phased out, they should be replaced with the myriad of large-stature trees the UFD has experimented with and found suitable. These include varieties of Oak, Maple, Linden and Hackberry.
58
PRUNING & MAINTENANCE Unfortunately, budget constraints of municipal tree programs often dictate the length of pruning cycles and maintenance regimes rather than the needs of the urban forest and its constituent components. In fact, pruning is programmed only for park trees in Cheyenne, not for street trees – that portion of the population capable of providing the most benefits to the community. Programmed pruning, under a reasonable timeline, can improve public safety by eliminating conflicts and increase benefits by improving tree health and condition. The non-existence of programmed street tree pruning is reflected in the generally poorer condition of Cheyenne’s street trees when compared to regularly maintained park trees. There are three times as many street trees in poor condition compared to park trees. Over 42% of park trees are in good or better condition compared to less than 10% of the street trees. Any dollar savings realized by the city deferring street tree planting and maintenance to residents is done at a loss in tree value and the cumulative value of the street tree population (Miller and Sylvester 1981). Street trees in Cheyenne produce 42% more benefits than park trees. In nearby Fort Collins, CO, 75% of the street trees are in good to excellent condition, providing 72% more benefits than park trees. This suggests that when trees are maintained at a better condition level, they provide more benefits to the community.
Managed, programmed pruning is recommended on a 3-6 yr cycle in residential areas; annual maintenance is suggested for commercial districts (Miller 1997). In their study of Milwaukee, WI, Miller and Sylvester (1981) found that extending pruning cycles beyond 4 or 5 years resulted in a loss of tree value that exceeded any savings accrued by deferring maintenance. In order to maintain consistency and maximize urban forest benefits while reducing city liabilities and public safety conflicts, the city of Modesto, CA had also found 4 years to be the ideal
59
pruning cycle for their municipal forest (Gilstrap 1983). Furthermore, Anderson and Eaton (1986) suggested that an adequate and systematic pruning and inspection program was the first step to avoiding liability stemming from trees. Nearly one-third (2,930) of all Cheyenne street trees needed general pruning compared to less than 10% of the park trees in 1992. Since 1992, the UFD has used a “species pruning” approach for park trees to target specific species to reduce the total number of trees needing pruning over the short-term. Street trees would benefit from a similar programmed approach. For example, in residential areas, focusing on the pruning of mature and senescent Cottonwood and Siberian elm would rectify over 50% of the trees along streets categorized as needing general pruning.
60
C HAPTER S IX—C ONCLUSION The approach used in this analysis not only provided sufficient data to describe structural characteristics of the street tree population, but, by using tree growth data modeled for the city, assessed the environmental benefits trees provide the city and its residents. In addition, the BCR was calculated and management needs were identified. This approach was based on established statistical methods and was intended to provide a general accounting of the benefits produced by street trees in Cheyenne that can be utilized to make informed management and planning decisions.
Cheyenne’s trees are a valuable asset, providing approximately $686,000 in annual benefits. These benefits to the community were most pronounced in increased local property values, but environmental benefits were also significant with energy savings notably high. Thus, street and park trees were found to provide a particularly important function in maintaining air quality, reducing the amount of particulate matter by filtering the air, and reducing heating consumption by acting as windbreaks.
Cheyenne’s street trees are a fantastically dynamic resource. Managers of this resource and the community alike can delight in knowing that street trees do improve the quality of life in Cheyenne, but they are also faced with a fragile resource that needs constant care to maximize and sustain these benefits through the foreseeable future. In a city where the climate poses a constant challenge to tree growth and health, this is no easy task. The challenge will be to maximize net benefits from available growth space over the long-term, providing an urban forest resource that is both functional and sustainable. The effects of the current extended drought are
61
potentially devastating to the Cheyenne tree population. Extensive public education on appropriate pruning and irrigation frequencies that demonstrate the resultant beneficial effects on tree health is necessary and could improve the functionality, longevity, and the overall benefits produced by street trees. Continued replacement of senescent Cottonwood and Siberian elm with a variety of medium and large-stature broadleaf deciduous tree species is recommended. A thorough inventory of street trees is currently being conducted which will allow the city to further evaluate the change and growth of the street tree populatio n since the 1992 inventory. In addition, all park trees are currently undergoing evaluation.
This analysis has provided the information necessary for resource managers to weigh the citywide needs with the more specific needs of park and residential areas. Utilizing the structural indices outlined above—diversity index, relative performance values, importance values, condition values, and age distribution tables, conflicts, etc.—along with benefit data, provide the requisite understanding for short- and long-term resource management.
Recommendations to management include the following: •
Achieving resource sustainability requires increasing diversity by balancing new plantings of proven, long- lived species with newer successful introductions, maximizing available growth space to provide the largest amount of leaf area and canopy coverage as the trees mature. Continued replacement of senescent Cottonwood and Siberian elm with a variety of long- lived medium and large-stature broadleaf deciduous tree species is recommended.
•
Focusing planting efforts along streets where stocking levels are lowest will improve the distribution of benefits provided to all neighborhoods. To this end a current inventory of all Cheyenne street trees will aid in overseeing and tracking management.
•
Tree health and pruning management needs for street trees were substantial compared to well- maintained park trees. Extensive public education on appropriate pruning and irrigation frequencies to demonstrate the resultant beneficial effects on tree health is necessary; this could assist in improving the functionality, longevity, and the overall
62
benefits produced by street trees. Functionality and longevity would be further bolstered by the establishment of a consistent pruning program for street trees.
63
C HAPTER S EVEN —R EFERENCES
REFERENCES Akbari, H.; Davis, S.; Dorsano, S.; Huang, J.; Winnett, S., eds. 1992. Cooling Our Communities: A Guidebook on Tree Planting and Light-Colored Surfacing. Washington, DC: U.S. Environmental Protection Agency.; 26 p. Alden, H.A. 1995. Hardwoods of North America. USDA Forest Service, FPL General Technical Report No. 83. Madison, WI. 136 p. Alden, H.A. 1997. Softwoods of North America. USDA Forest Service, FPL General Technical Report No. 102. Madison, WI. 151 p. Anderson, L.M. and T.A. Eaton. 1986. Liability for damage caused by hazardous trees. J. Arboric. 12(8):189-195. Anderson, L.M. and H.K. Cordell. 1988. Residential property values improve by landscaping with trees. Southern Journal of Applied Forestry 9:162-166. Bartenstein, F. 1981. The future of urban forestry. J. Arboric. 7(10):261-267. Bernhardt, E. and T.J. Swiecki. 1993. The State of Urban Forestry in California: Results of the 1992 California Urban Forest Survey. Sacramento, California Department of Forestry and Fire Protection. 51 p. Benjamin, M.T. and A.M. Winer. 1998. Estimating the ozone- forming potential of urban trees and shrubs. Atmos. Environ., 32: 53-68. Brusca, J. 1998. Personal communication on November 17. Street Superintendent, City of Modesto, CA. Chandler, T.J. 1965. The Climate of London. London, Hutchinson. Cheyenne Botanic Gardens. 2004. History of the High Plains Arboretum. Accessed via the World Wide Web at http://www.botanic.org/History_of_Arboretum.asp. Cheyenne Light, Fue l, and Power Company. Utility rate pricing data obtained. 2003. CNN Money. 2003. Wyoming home sales pricing. Accessed via the World Wide Web at http://money.cnn.com/best/bpretire/details/5613900.html
64
Colorado Agricultural Meteorological Network 2003. Accessed via the World Wide Web at http://ccc.atmos.colostate.edu/~coagmet/ . Dwyer, J.F., E.G. McPherson, H.W. Schroeder and R.A. Rowntree. 1992. Assessing the benefits and costs of the urban forest. Journal of Arboriculture 18(5):227-234. Gilstrap, C. 1983. Memorandum, RE: Programmed pruning; dated 11/29/83. City arborist, Modesto, CA. Hammond, J. J Zanetto and C. Adams. 1980. Planning Solar Neighborhoods. California Energy Commission. Hague, William. 2003. Colorado Department of Public Health, Air Pollution Control Division, personal communication 6/6/2003 Heisler, G.M. 1986. Energy savings with trees. Journal of Arboriculture. 12(5):113-125. Hull, R.B. 1992. How the public values urban forests. J. Arboric. 18(2):98-101. Jenkins, J. F. undated. My Life Story. Copy of personal memoirs obtained from City of Cheyenne Urban Forestry Division. 55 pp. Kaplan, R. 1992. Urban Forestry and the Workplace. In P.H. Gobster (Ed). Managing Urban and High-Use Recreation Settings. USDA Forest Service, General Technical Report NC-163. Chicago, IL: North Central Forest Experimentation Center. Kaplan, R. and S. Kaplan. 1989. The Experience of Nature: A Psychological Perspective. Cambridge University Press, Cambridge, UK. Lewis, C.A. 1996. Green Nature/Human Nature: The Meaning of Plants in Our Lives. University of Illinois Press, Chicago, IL. Marion, W. and K. Urban, User's manual for TMY2s - typical meteorological years. National Renewable Energy Laboratory, 1617 Cole Blvd, Golden, Colorado, 80401, 1995. Maco, S.E. and E.G. McPherson. 2002. Assessing canopy cover over streets and sidewalks in street tree populations. J. Arboric. 28(6):270-276. Maco, S.E. 2003. A practical approach to assessing structure, function, and value of street tree populations in small communities. J. Arboric. 29(2):84-97. McPherson, E. G. 1984. Planting design for solar control, chapter 8. In Energy Conserving Site Design, Am. Soc. Landscape Archit., Washington, D.C. p.141-164. McPherson, E.G. and R.A. Rowntree. 1989. Using structural measures to compare twenty-two U.S. street tree populations. Landscape Journal 8:13-23.
65
McPherson, E.G. 1993. Evaluating the cost effectiveness of shade trees for demand-side management. The Electricity Journal 6(9): 57-65. McPherson, E.G., K.I. Scott and J.R. Simpson. 1998. Estimating cost effectiveness of residential yard trees for improving air quality in Sacramento, California, using existing models. Atmospheric Environment 32(2):75-84. McPherson, E.G. and J.R. Simpson. 1999. Guidelines for Calculating Carbon Dioxide Reductions Trough Urban Forestry Programs. USDA Forest Service, PSW General Technical Report No. 171, Albany, CA. McPherson, E.G. and S. Mathis (Eds.) 1999. Proceedings of the Best of the West Summit. Western Chapter, International Society of Arboriculture: Sacramento, CA: 93 p. McPherson, E.G., J.R. Simpson, P.J. Peper and Q. Xiao. 1999. Benefit-cost analysis of Modesto’s municipal urban fo rest. Journal of Arboriculture. 25(5):235-248. McPherson, E.G., Maco, S.E., Simpson, J.R., Peper, P.J., Xiao, Q., Van Der Zanden, A.M. and N. Bell. 1999b. Western Washington and Oregon Community Tree Guide: Benefits, Costs and Strategic Planting. International Society of Arboriculture, Northwest Chapter. Silverton, OR. 76 pp. McPherson, E.G. 2000. Expenditures associated with conflicts between street tree root growth and hardscape in California, United States. J. Arboric. 26(6):289-297. McPherson, E.G., J.R. Simpson, P.J. Peper, Q. Xiao, D.R. Pettinger and D.R. Hodel. 2001.Tree Guidelines for Inland Empire Communities. Local Government Commission, Sacramento, CA. pp. 115. McPherson, E.G. and J.R. Simpson. 2002. A comparison of municipal forest benefits and costs in Modesto and Santa Monica, California, USA. Urban For. Urban Green. 1(2002):61-74. McPherson, E.G., Simpson, J.R., Peper, P.J., Maco, S.E., and Q. Xaio. 2004. Benefit-Cost Analysis of Fort Collins’ Municipal Forest. Internal Report, CUFR-2., Davis, CA: Center for Urban Forest Research; 39 p. Miller, R.W. 1997. Urban forestry: planning and managing urban greenspaces. 2nd. ed. Upper Saddle River: Prentice-Hall; 502 p. Miller, R.W. and W.A. Sylvester. 1981. An economic evaluation of the pruning cycle. J. Arboric. 7(4):109-112. Moll, G., and C. Kollin. 1993. A new way to see our city forests. American Forests, 99(9-10):2931. Neely, D., ed. 1988. Valuation of Landscape Trees, Shrubs, and Other Plants. Seventh ed. Urbana, IL: International Society of Arboriculture. 50 p.
66
Olson, L. 2003. Personal communication with Lisa Olson, City Forester, City of Cheyenne, on September 10, 2003. Olson, L. and R. Overstreet. 2002. Municipal forestry annual expenditures survey. Center for Urban Forest Research, PSW, US Forest Service, Davis CA. Overstreet, R. 2004. Personal communication with Randy Overstreet, Assistant City Forester, City of Cheyenne, on February 3, 2003. Overstreet, R. 2004. Personal communication with Randy Overstreet, Assistant City Forester, City of Cheyenne, on June 1, 2004. Parsons, R., L.G. Tassinary, R.S. Ulrich, M.R. Hebl and M. Grossman-Alexander. 1998. The view from the road: implications for stress recovery and immunization. Journal of Environmental Psychology 18(2):113-140. Payton, Richard. 2003. Environmental Protection Agency Region 8 Air Quality Monitoring, personal communication 6/17/2003 Peper, P.J.; McPherson, E.G. 1998. Comparison of five methods for estimating leaf area index of open-grown deciduous trees. Journal of Arboriculture 24(2): 98-111. Peper, P.J., McPherson, E.G. and S. Mori. 2001. Predicitive equations for dimensions and leaf area of Coastal Southern California municipal trees. J. Arboric 27(4): 169-180. Peper, P.J. and E.G. McPherson. 2003. Evaluation of four methods for estimating leaf area of isolated trees. Urban Forestry and Urban Greening 2:19-30. Pillsbury, N.H.; Reimer, J.L.; Thompson R.P. 1998. Tree Volume Equations for Fifteen Urban Species in California. Tech. Rpt. 7. Urban Forest Ecosystems Institute, California Polytechnic State University; San Luis Obispo, CA. 56 p. Platt, R.H., R.A Rowntree and P.C. Muick, eds. 1994. The Ecological City. Boston, MA, University of Massachusetts. 292 p. Richards, N.A. 1982/83. Diversity and stability in a street tree population. Urban Ecology 7: 159-171. Ritschard, R.L., J.W. Hanford and A.O. Sezgen. 1992. Single family heating and cooling requirements: assumptions, methods, and summary results. Publication GRI-91/0236. Chicago: Gas Research Institute; 97 p. Schroeder, H.W. and W.N. Cannon. 1983. The esthetic contribution of trees to residential streets in Ohio towns. Journal of Arboriculture. 9: 237-243. Scott, K.I., E.G. McPherson, and J.R. Simpson. 1998. Air pollutant uptake by Sacramento's urban forest. Jour nal of Arboriculture 24(4):224-234.
67
Scott, K.I., Simpson, J.R., and E.G. McPherson. 1999. Effects of tree cover on parking lot microclimate and vehicle emissions. Journal of Arboriculture. 25(3): 129-142. Simpson, E.H. 1949. Measurement of diversity. Nature. 163:688. Simpson, J.R. 1998. Urban forest impacts on regional space conditioning energy use: Sacramento County case study. Journal of Arboriculture 24(4): 201-214. Simpson, J.R. 2002. Improved estimates of tree shade effects on residential energy use. Energy and Buildings 34(10): 173-182. Taha, H. 1996. Modeling impacts of increased urban vegetation on odistrict air quality in the South Coast Air Basin. Atmospheric Environment 30: 3423-3430. Ter-Mikaelian, M.T. and M.D. Korzukhin. 1997. Biomass equations for sixty- five North American tree species. For. Ecol and Management 97: 1-24. Thompson, R.P. and J.J. Ahern. 2000. The State of Urban and Community Forestry in California: Status in 1997 and Trends since 1988, California Dept. of Forestry and Fire Protection, Technical Report No. 9. Urban Forest Ecosystems Institute, Cal Poly State University, San Luis Obispo, CA. pp. 48. Tretheway, R. and A. Manthe. 1999. Skin cancer prevention: another good reason to plant trees. In McPherson, E.G. and Mathis, S. Proceedings of the Best of the West Summit. University of California, Davis, CA. Tritton, L.M. and J.W. Hornbeck. 1982. Biomass Equations for Major Tree Species of the Northeast. USDA Forest Service, NE General Technical Report No. 69. Broomall, PA. 46 p. U.S. Census Bureau. 2002. State and Country Quick Facts. Accessed via the World Wide Web at http://quickfacts.census.gov/qfd/states/08/08001.html> on July 9, 2003. U.S. Department of Commerce. 2003. Unedited Local Climatological Data. National Climatic Data Center, National Oceanic & Atmospheric Administration. U.S. Department of Agriculture, Soil Conservation Service. 1986. Urban Hydrology for Small Watersheds. Technical Release No. 55. Second Edition. Washington, D.C. U.S. Environmental Protection Agency. 2003. E-GRID (E-GRID2002 Edition). Ulrich, R. S. 1985. Human responses to vegetation and landscapes. Landscape and Urban Planning 13: 29-44. Wang, M.Q. and D.J. Santini. 1995. Monetary values of air pollutant emissions in various U.S. regions. Transportation Research Record 1475.
68
Wilkinson, D. 1991. Can photographic methods be used for measuring the light attenuation characteristics of trees in leaf? Landscape and Urban Planning 20:347-349. Wolf, K.L. 1999. Nature and commerce: human ecology in business districts. In C. Kollin (Ed), Building Cities of Green: Proceedings of the 1999 National Urban Forest Conference. Washington, D.C. American Forests; 56-59. Xiao, Q., E.G. McPherson, J.R. Simpson and S.L Ustin. 1998. Rainfall interception by Sacramento's urban forest. Journal of Arboriculture 24(4):235-244.
69
A PPENDIX A: T REE D ISTRIBUTION
Table A-1. Tree numbers by size class (diameter at breast height [dbh] in inches) for all street and park trees. Tree types are BDL, BDM, and BDS for broadleaf deciduous large, medium, and small, CEL, CES for coniferous evergreen large, medium, and small. Tree Species Cottonwood/poplar Siberian elm Green ash Honeylocust Boxelder maple American elm Silver maple Willow Hackberry Quaking aspen Russian olive Birch Crabapple Common chokecherry Blue spruce Ponderosa/Austrian pine Pine Fir Juniper species Pinyon pine BDL OTHER BDM OTHER BDS OTHER CEL OTHER CES OTHER Street Tree Total Park Tree Total Grand Total
0-3 280 295 348 76 127 28 16 5 34 137 115 13 230 254 377 334 229 68 174 64 316 50 277 125 36 1,939 2,069 4,008
3-6 195 228 181 192 49 8 17 7 23 86 17 15 167 59 215 199 37 5 119 123 144 7 143 33 23 1,340 952 2,292
6-12 197 343 223 143 56 18 25 63 33 10 7 41 129 2 529 446 13 2 126 41 87 7 79 47 20 997 1,690 2,687
12-18 308 409 463 302 122 65 56 117 77 10 21 18 1 611 575 15 9 20 3 116 10 23 32 3 1,604 1,782 3,386
18-24 533 432 130 67 54 76 36 88 30 3 3 1 317 138 5 3 42 2 7 15 1,089 893 1,982
70
24-30 983 241 12 7 6 26 23 37 118 17 1 30 1 2 1,055 449 1,504
30-36 702 81 1 1 3 7 11 13 1 19 645 194 839
36-42 222 21 2 2 3 6 201 55 256
42+ 48 6 2 37 19 56
Total % Total 3,468 20.4 2,056 12.1 1,358 8.0 787 4.6 415 2.4 226 1.3 182 1.1 331 1.9 197 1.2 233 1.4 152 0.9 93 0.5 545 3.2 316 1.9 2,180 12.8 1,710 10.1 300 1.8 87 0.5 439 2.6 231 1.4 762 4.5 76 0.4 530 3.1 254 1.5 82 0.5 8,907 52.4 8,103 47.6 17,010 100.0
A PPENDIX B: M ETHODOLOGY AND P ROCEDURES
This analysis combines results of a citywide inventory with benefit-cost modeling data to produce four types of information (Maco 2003): 1. Resource structure (species composition, diversity, age distribution, condition, etc.) 2. Resource function (magnitude of environmental and aesthetic benefits) 3. Resource value (dollar value of benefits realized) 4. Resource management needs (sustainability, pruning, planting, and conflict mitigation)
This section describes the inputs and calculations used to derive the aforementioned outputs: growth modeling, identifying and calculating benefits, estimating magnitude of benefits provided, assessing resource unit values, calculating net benefits and benefit-cost ratio, and assessing structure.
GROWTH MODELING Cheyenne’s tree database contained information on 17,010 street and park trees, including species and size. There were a total of 58 broadleaf and conifer species. A combination of regional tree growth models from Fort Collins, CO and local models developed from Cheyenne data were used as the basis for modeling Cheye nne tree growth. Applying Fort Collins’s models to cities within the same climate region assumes
71
that Fort Collins’s trees grow at the same rate and to the same dimensions throughout the region. Using the Cheyenne Urban Forestry Division’s 1992 municipal tree database, a stratified random sample of six street and park tree species were measured to establish relations between tree age, size, leaf area and biomass for comparison with the regional growth curves. This comparison formed the basis for adjusting the regional curves to model Cheyenne tree growth and estimate the magnitude of annual benefits derived from the Cheyenne street and park tree resources. The six Cheyenne species measured were Silver maple (Acer saccharinum), Green ash (Fraxinus pennsylvanica), Honeylocust (Gleditsia triacanthos), Littleleaf linden (Tilia cordata), Blue spruce (Picea pungens), and Siberian elm (Ulmus pumila). Because the Blue spruce models could be used to model growth of other conifers in the city, only the five broadleaf deciduous tree species were used to compare and adjust the Fort Collins’ broadleaf deciduous tree models for use in Cheyenne.
For both the regional and local growth models information spanning the life cycle of predominant tree species was collected. City inventories were stratified into 9 diameterat-breast height (DBH) classes: 0-7.62 in (0-7.62 cm), 3-6 in (7.62-15.24 cm), 6-12 in (15.24-30.48 cm), 12-18 in (30.48-45.72 cm), 18-24 in (45.72-60.96 cm), 24-30 in (60.96-76.2 cm), 30-36 in (76.2-91.44), 36-42 in (91.44-106.68 cm), and >42 in (106.68 cm). Thirty- five to 70 randomly selected trees of each species were selected to survey, along with an equal number of alternative trees. Tree measurements included DBH (to nearest 0.1 cm by tape), tree crown and bole height (to nearest 0.5m by altimeter), crown diameter in two directions (parallel and perpendicular to nearest street to nearest 0.5m by
72
tape), tree condition and location, and crown pruning level (percentage of crown removed by pruning). Replacement trees were sampled when trees from the original sample population could not be located. Tree age was determined from interviews with residents, the Director and Assistant Director of the Urban Forestry Division, and historical planting records. Fieldwork was conducted in August and September 2002.
Crown volume and leaf area were estimated from computer processing of tree crown images obtained using a digital camera. The method has shown greater accuracy than other techniques (±20 percent of actual leaf area) in estimating crown volume and leaf area of open-grown trees (Peper and McPherson 2003).
Linear regression was used to fit predictive models—DBH as a function of age—for each of the 22 sampled species in Fort Collins. Predictions of leaf surface area (LSA), crown diameter, and height metrics were modeled as a function of DBH using best- fit models (Peper et al. 2001). The same methods were applied to develop the models for the six species that Cheyenne and Fort Collins shared in common. Midpoint DBH size class predictions for each growth parameter were calculated for each city’s trees. The proportional difference in tree size by dbh class was calculated and averaged across the species to develop factors to adjust the Fort Collins’ tree models to represent Cheyenne tree size. Table B-1 shows that across species and age classes, Cheyenne’s deciduous broadleaf trees are about 18% shorter than Fort Collins’ trees, not surprising, considering the pruning effect of freezing, high winds in winter and higher eleva tion. There is a
73
similarly proportional difference for every other tree dimension except crown diameter, which on average, is about 9% smaller than Fort Collins’ average crown diameter. Table B-1. Cheyenne tree dimensions as a proportion of Fort Collins’ tree dimensions for each DBH class midpoint. For example, 15” DBH trees in Cheyenne average 80.3% of height of a Fort Collins’ tree.
DBH Class 1 2 3 4 5 6 7 8 9 mean std error
Midpoint DBH (in) 1.5 4.5 9 15 21 27 33 39 45 21.7 5.1
% of Height 97.0 81.4 79.6 80.3 81.5 80.5 79.6 78.9 78.4 81.9 1.9
% of Crown Height 88.7 74.6 75.6 78.4 80.9 80.6 80.4 80.3 80.3 80.0 1.3
% of % of Crown Crown % of Diameter Projection Leaf Area 87.9 78.1 89.4 87.9 78.1 89.4 85.5 74.0 85.9 88.7 79.1 80.9 92.5 85.7 81.4 92.9 86.8 79.4 93.4 88.1 79.0 93.9 89.8 80.8 94.5 91.6 85.1 90.8 83.5 83.5 1.1 2.1 1.4
IDENTIFYING & CALCULATING BENEFITS Annual benefits for Cheyenne’s street trees were estimated for the year 2001. Growth rate modeling information was used to perform computer-simulated growth of the existing tree population for one year and account for the associated annual benefits. This “snapshot” analysis assumed that no trees were added to, or removed from, the existing population during the year. The approach directly connects benefits with tree size variables such DBH and LSA. Many functional benefits of trees are related to leafatmosphere processes (e.g., interception, transpiration, photosynthesis), and, therefore, benefits increase as tree canopy cover and leaf surface area increase.
Prices were assigned to each benefit (e.g., heating/cooling energy savings, air pollution absorption, storm-water runoff reduction) through direct estimation and implied valuation
74
as environmental externalities. Implied valuation is used to price society’s willingness to pay for the environmental benefits trees provide. Estimates of benefits are initial approximations—as some benefits are difficult to quantify (e.g., impacts on psychological health, crime, and violence). In addition, limited knowledge about the physical processes at work and their interactions makes estimates imprecise (e.g., fate of air pollutants trapped by trees and then washed to the ground by rainfall). Therefore, this method of quantification was not intended to account for each penny. Rather, this approach was meant to be a general accounting of the benefits produced by urban trees; an accounting with an accepted degree of uncertainty that can, nonetheless, provide a platform on which decisions can be made (Maco 2003).
Energy Savings Buildings and paving, along with low canopy and soil cover, increase the ambient temperatures within a city. Research shows that even in temperate climate zones—such as those of the Pacific Northwest—temperatures in urban centers are steadily increasing by approximately 0.5°F (0.3°C) per decade. Winter benefits of this warming do not compensate for the detrimental effects of magnifying summertime temperatures. Because electric demand of cities increases about 1-2% per 1°F (3-4% per °C) increase in temperature, approximately 3-8% of current electric demand for cooling is used to compensate for this urban heat island effect of the last four decades (Akbari et al. 1992).
Warmer temperatures in cities, compared to surrounding rural areas, have other implications. Increases in CO2 emissions from fossil fuel power plants, municipal water demand, unhealthy ozone levels, and human discomfort and disease are all symptoms
75
associated with urban heat islands. In Cheyenne, there are many opportunities to ameliorate the problems associated with hardscape through strategic tree planting and stewardship of existing trees allowing for streetscapes that reduce storm-water runoff, conserve energy and water, sequester CO2 , attract wildlife, and provide other aesthetic, social, and economic benefits through urban renewal developments and new development.
For individual buildings, street trees can increase energy efficiency in the summer and increase or decrease energy efficiency in winter, depending on placement. Solar angles are important when the summer sun is low in the east and west for several hours each day. Tree shade to protect east—and especially west—walls help keep buildings cool. In the winter, sola r access on the southern side of buildings can warm interior spaces.
Trees reduce air infiltration and conductive heat loss from buildings. Rates at which outside air infiltrates into a building can increase substantially with wind speed. In cold, windy weather, the entire volume of air in a poorly sealed home may change two to three times per hour. Even in newer or tightly sealed homes, the entire volume of air may change every two to three hours. Trees can reduce wind speed and resulting air infiltratio n by up to 50%, translating into potential annual heating savings of 25% (Heisler 1986). Reductions in wind speed reduce heat transfer through conductive materials as well. Cool winter winds, blowing against single-pane windows, can contribute significantly to the heating load of homes and buildings by increasing the temperature gradient between inside and outside temperatures.
76
Electricity and Natural Gas Methodology Calculating annual building energy use per residential unit (Unit Energy Consumption [UEC]) is based on computer simulations that incorporate building, climate and shading effects, following methods outlined by McPherson and Simpson (1999). Changes in UECs from trees (?∆UECs) were calculated on a per tree basis by comparing results before and after adding trees. Building characteristics (e.g., cooling and heating equipment saturations, floor area, number of stories, insulation, window area, etc.) are differentiated by a building’s vintage, or age of construction: pre-1950, 1950-1980 and post-1980. Typical meteorological year (TMY2) weather data for Cheyenne Airport were used (Marion and Urban 1995). Shading effects for each tree species measured were simulated at three tree-building distances, eight orientations and nine tree sizes.
Shading coefficients for tree crowns in leaf were based on a photographic method that estimates visual density. These techniques have been shown to give good estimates of light attenuation for trees in leaf (Wilkinson 1991). Visual density was calculated as the ratio of crown area computed with and without included gaps. Crown areas were obtained from digital images isolated from background features using the method of Peper and McPherson (2003). Values for trees not measured, and for all trees not in leaf, were based on published values where available (McPherson 1984, Hammond et al. 1980). Values for remaining species were assigned based on taxonomic considerations (trees of the same genus assigned the same value) or observed similarity in the field to known species. Foliation periods for deciduous trees were obtained from the literature (McPherson 1984, Hammond et al. 1980) and adjusted for Cheyenne’s climate based on consultation with
77
the assistant city forester (Randy Overstreet, Assistant Urban Forester, City of Cheyenne, pers comm. 3/3/2003).
Tree distribution by location (e.g. frequency of occurrence at each location determined from distance between trees and buildings (setbacks), and tree orientation with respect to buildings) specific to Cheyenne was used to calculate average energy savings per tree as a function of distance and direction. Setbacks were assigned to four distance classes: 0-20 ft, 20-40 ft, 40-60 ft and >60 ft. It was assumed that street trees within 60 ft of buildings provided direct shade on walls and windows. Savings per tree at each location were multiplied by tree distribution to determine location-weighted savings per tree for each species and DBH class that was independent of location. Location-weighted savings per tree were multiplied by number of trees in each species/DBH class and then summed to find total savings for the city. Tree location measurements were based on samples of 275 right-of-way trees and 79 park trees taken in the summer of 2003.
Land use (single family residential, multifamily residential, commercial/industrial, other) for right-of-way trees was based on the same tree sample. Park trees were distributed according to the predominant land use surrounding each park. The same tree distribution was used for all land uses.
Three prototype buildings were used in the simulations to represent pre-1950, 1950 and post-1980 construction practices for Cheyenne (West Mountain census region, Denver) (Ritschard et al. 1992). Building footprints were modeled as square, which was found to
78
be reflective of average impacts for large building populations (Simpson 2002). Buildings were simulated with 1.5-ft overhangs. Blinds had a visual density of 37%, and were assumed closed when the air conditioner is operating. Summer and winter thermostat settings were 78° F and 68° F during the day, respectively, and 60° F at night. Unit energy consumptions were adjusted to account for saturation of central air conditioners, room air conditioners, and evaporative coolers (Table B-2).
79
Table B-2. Saturation adjustments for cooling. Commercial/ Single family detached
Mobile Homes
Single family attached
MF 2-4 units
MF 5+ units Institutional/
Industrial pre-
1950-
post-
pre-
1950-
post-
pre-
1950-
post-
pre-
1950-
post-
pre-
1950-
post-
1950
1980
1980
1950
1980
1980
1950
1980
1980
1950
1980
1980
1950
1980
1980
Transportation Small
Large
Cooling equipment factors Central air/heat pump 100%
100% 100% 100%
100% 100% 100%
100% 100% 100%
100% 100% 100%
100% 100%
100%
100%
0%
Evaporative cooler
33%
33%
33%
33%
33%
33%
33%
33%
33%
33%
33%
33%
33%
33%
33%
33%
33%
0%
Wall/window unit
25%
25%
25%
25%
25%
25%
25%
25%
25%
25%
25%
25%
25%
25%
25%
25%
25%
0%
None
0%
0%
0%
0%
0%
0%
0%
0%
0%
0%
0%
0%
0%
0%
0%
0%
0%
0%
63%
63%
0%
2%
0%
Cooling saturations Central air/heat pump
47%
55%
78%
47%
55%
78%
47%
55%
78%
47%
55%
78%
47%
55%
78%
Evaporative cooler
0%
0%
0%
0%
0%
0%
0%
0%
0%
0%
0%
0%
0%
0%
0% 2%
Wall/window unit
23%
25%
11%
23%
25%
11%
23%
25%
11%
23%
25%
11%
23%
25%
11%
13%
13%
0%
None
60%
39%
22%
60%
39%
22%
60%
39%
22%
60%
39%
22%
60%
39%
22%
22%
22%
0%
53%
62%
81%
53%
62%
81%
53%
62%
81%
53%
62%
81%
53%
62%
81%
67%
67%
0%
Adjusted cooling saturation
80
Single-Family Residential Adjustments Unit energy consumptions for simulated single- family residential buildings were adjusted for type and saturation of heating and cooling equipment, and for various factors that modified the effects of shade and climate modifications on heating and cooling loads, using the expression, ?UEC x =??UECsh SFD × Fsh +??UEC clSFD × Fcl where Fsh = Fequipment × APSF × Fadjacent shade × Fmultiple tree
Equation 1
Fcl = Fequipment × PCF and
Fequipment = SatCAC + Satwindow × 0.25 + Satevap × (0.33 for cooling and 1.0 for
heating).
Total change in energy use for a particular land use was found by multiplying change in UEC per tree by the number of trees (N): Total change = N ×? ?UECx .
Equation 2
Subscript x refers to residential structures with 1, 2-4 or 5 or more units, SFD to single family detached structures which were simulated, sh to shade, and cl to climate effects.
Estimated shade savings for all residential structures were adjusted by factors that accounted for shading of ne ighboring buildings, and reductions in shading from overlapping trees. Homes adjacent to those with shade trees may benefit from their shade. For example, 23% of the trees planted for the Sacramento Shade program shaded neighboring homes, resulting in an estimated energy savings equal to 15% of that found for program participants; this value was used here (Fadjacent shade = 1.15). In addition, shade
81
from multiple trees may overlap, resulting in less building shade from an added tree than would result if there were no existing trees. Simpson (2002) estimated that the fractional reduction in average cooling and heating energy use per tree were approximately 6% and 5% percent per tree, respectively, for each tree added after the first. Simpson (1998) also found an average of 2.5 to 3.4 existing trees per residence in Sacramento. A multiple tree reduction factor of 85% was used here, equivalent to approximately three existing trees per residence.
In addition to localized shade effects, which were assumed to accrue only to street trees within 18-60 ft (5-18 m) of buildings; lowered air temperatures and wind speeds from neighborhood tree cover (referred to as climate effects) produce a net decrease in demand for summer cooling and winter heating. Reduced wind speeds by themselves may increase or decrease cooling demand, depending on the circumstances. To estimate climate effects on energy use, air temperature and wind speed reductions as a function of neighborhood canopy cover were estimated from published values following McPherson and Simpson (1999), then used as input for building energy use simulations described earlier. Peak summer air temperatures were assumed reduced by 0.4 °F for each percentage increase in canopy cover. Wind speed reductions were based on the canopy cover resulting from the addition of the particular tree being simulated to that of the building plus other trees. A lot size of 10,000 ft2 (929 m2 ) was assumed.
Dollar value of electrical and natural gas (Cheyenne Light, Fuel, and Power Company 2003) energy savings were based on electricity and natural gas prices of $0.084 per kWh
82
and $0.80 per therm, respectively. Cooling and heating effects were reduced based on the type and saturation of air conditioning (Table B-2) or heating (Table B-3) equipment by vintage. Equipment factors of 33% and 25% were assigned to homes with evaporative coolers and room air conditioners, respectively. These factors were combined with equipment saturations to account for reduced energy use and savings compared to those simulated for homes with central air conditioning (Fequipment ). Building vintage distribution was combined with adjusted saturations to compute combined vintage/saturation factors for air conditioning (Table B-2). Heating loads were converted to fuel use based on efficiencies in Table B-3. The “other” and “fuel oil” heating equipment types were assumed natural gas for the purpose of this analysis. Building vintage distributions were combined with adjusted saturations to compute combined vintage/saturation factors for natural gas and electric heating (Table B-4).
83
Table B-3. Saturation adjustments for heating Electric heating
Single family detached
Mobile Homes
Single family attached
MF 2-4 units
Commercial/
Institutional/
Industrial
Transportation
MF 5+ units
Equipment
pre-
1950-
post-
pre-
1950-
post-
pre-
1950-
post-
pre-
1950-
post-
pre-
1950-
post-
efficiencies
1950
1980
1980
1950
1980
1980
1950
1980
1980
1950
1980
1980
1950
1980
1980
Small
Large
AFUE
0.75
0.78
0.78
0.75
0.78
0.78
0.75
0.78
0.78
0.75
0.78
0.78
0.75
0.78
0.78
0.78
0.78
0.78
HSPF
6.8
6.8
8
6.8
6.8
8
6.8
6.8
8
6.8
6.8
8
6.8
6.8
8
8
8
8
HSPF
3.412
3.412
3.412
3.412
3.412
3.412
3.412
3.412
3.412
3.412
3.412
3.412
3.412
3.412
3.412
3.412
3.412
3.412
Electric heat saturations Electric 3.0%
6.0%
19.0%
3.0%
6.0%
19.0%
3.0%
6.0% 19.0%
3.0%
6.0% 19.0%
3.0%
6.0%
19.0%
19.0%
19.0%
19.0%
0.5%
1.0%
3.2%
0.5%
1.0%
3.2%
0.5%
1.0%
3.2%
0.5%
1.0%
3.2%
0.5%
1.0%
3.2%
3.2%
3.2%
3.2%
0.7%
1.5%
4.7%
0.7%
1.5%
4.7%
0.7%
1.5%
4.7%
0.7%
1.5%
4.7%
0.7%
1.5%
4.7%
4.7%
4.7%
4.7%
resistance Heat pump Adjusted saturations Natural Gas and other heating Natural gas
47%
50%
44%
47%
50%
44%
47%
50%
44%
47%
50%
44%
47%
50%
44%
44%
44%
44%
Oil
20%
25%
11%
20%
25%
11%
20%
25%
11%
20%
25%
11%
20%
25%
11%
11%
11%
11%
Other
30%
18%
22%
30%
18%
22%
30%
18%
22%
30%
18%
22%
30%
18%
22%
22%
22%
22%
97%
93%
78%
97%
93%
78%
97%
93%
78%
97%
93%
78%
97%
93%
78%
78%
78%
78%
NG saturations
84
Table B-4. Building vintage distribution and combined vintage/saturation factors for heating and air conditioning. Siingle family detached
Mobile Homes
Single family attached
MF 2-4 units
MF 5+ units
Commercial/Industrial
Institutional/
pre-
1950-
post-
pre-
1950-
post-
pre-
1950-
post-
pre-
1950-
post-
pre-
1950-
post-
1950
1980
1980
1950
1980
1980
1950
1980
1980
1950
1980
1980
1950
1980
1980
36.0%
33%
31%
36%
33%
31%
36%
33%
31%
36%
33%
31%
36%
33%
31%
100%
100%
100%
22.8% 21.3%
19.7%
1.5%
01.4%
1.3%
2.2%
2.1%
1.9%
0.4%
0.4%
0.4%
1.4%
1.3%
1.2%
8.3%
8.0%
4.4%
Small
Large
Transportation
Vintage distribution by building type Tree distribution by vintage and building type Combined vintage, equipment saturation factors for cooling Cooling factor: 11.72% 12.83% 15.54% 2.09%
0.83% 1.00% 1.00% 1.09% 1.32% 0.16% 0.17% 0.21% 0.29%
0.32% 0.39%
1.94%
0.93%
0.51%
11.99% 13.13% 15.9% 2.14%
0.85% 1.03% 1.16% 1.27% 1.54% 0.18% 0.19% 0.23% 0.59%
0.64% 0.78%
2.22%
1.6%
0.58%
0.49% 0.38%
2.26%
1.09%
0.59%
shade Cooling factor: climate Combined vintage, equipment saturation factors for heating Heating factor, nat. gas: shade
21.57% 19.34% 15.00% 1.39% 12.25% 0.97% 1.84% 1.65% 1.28% 0.29% 0.26% 0.20% 0.54%
Heating factor, electric: shade
0.15% 0.32% 0.90% 0.02%
0.06% 0.01% 0.01% 0.03% 0.08% 0.00% 0.00% 0.01% 0.00%
0.01% 0.02%
0.14%
0.07%
0.04%
22.07% 19.79% 15.35% 3.95%
1.28% 0.99% 2.14% 1.91% 1.49% 0.32% 0.29% 0.23% 1.08%
0.97% 0.75%
2.60%
1.87%
0.68%
0.16% 0.32% 0.92% 0.03%
0.02% 0.06% 0.02% 0.03% 0.09% 0.00% 0.00% 0.01% 0.01%
0.02% 0.05%
0.16%
0.11%
0.04%
Heating factor, nat. gas: climate Heating factor, electric: climate
85
Multi-Family Residential Analysis Unit energy consumptions (UECs) from shade for multi- family residences (MFRs) were calculated from single- family residential UECs adjusted by adjusted potential shade factors (APSFs) to account for reduced shade resulting from common walls and multi- story construction. Average potential shade factors were estimated from potential shade factors (PSFs), defined as ratios of exposed wall or roof (ceiling) surface area to total surface area, where total surface area includes common walls and ceilings between attached units in addition to exposed surfaces (Simpson 1998). A PSF=1 indicates that all exterior walls and roof are exposed and could be shaded by a tree, while PSF=0 indicates that no shading is possible (i.e., the common wall between duplex units). Potential shade factors were estimated separately for walls and roofs for both single and multi- story structures. Average potential shade factors were 0.74 for land use MFR 2-4 units and 0.41 for MFR 5+ units.
Unit energy consumptions were also adjusted for climate effects to account for the reduced sensitivity of multi- family buildings with common walls to outdoor temperature changes with respect to single- family detached residences. Since estimates for these PCFs were unavailable for multi- family structures, a multi- family PCF value of 0.80 was selected (less than single- family detached PCF of 1.0 and greater than small commercial PCF of 0.40; see next section).
Commercial and Other Buildings Unit energy consumptions for commercial/industrial (C/I) and industrial/transportational (I/T) land uses due to presence of trees were determined in a manner similar to that used for multifamily land uses. Potential shade factors of 0.40 were assumed for small C/I, and 0.0 for large C/I. No energy impacts were ascribed to large C/I structures since they are expected to have
86
surface to volume ratios an order of magnitude larger than smaller buildings and less extensive window area. Average potential shade factors for I/T structures were estimated to lie between these extremes; a value of 0.15 was used here. However, data relating I/T land use to building space conditioning were not readily available, so no energy impacts were ascribed to I/T structures. A multiple tree reduction factor of 0.85 was used and no benefit was assigned for shading of buildings on adjacent lots.
Potential climate factors of 0.40, 0.25 and 0.20 were used for small C/I, large C/I and I/T, respectively. These values are based on estimates by Akbari and others (1992) who observed that commercial buildings are less sensitive to outdoor temperatures than houses.
Change in UECs due to shade tend to increase with conditioned floor area (CFA) for typical residential structures. As building surface area increases so does the area shaded. This occurs up to a certain point because the projected crown area of a mature tree (approximately 700 to 3,500 ft2 [65-325 m2 ]) is often larger than the building surface areas being shaded. Consequently, more area is shaded with increased surface area. However, for larger buildings, a point is reached at which no additional area is shaded as surface area increases. Therefore, ??UECs will tend to diminish as CFA increases. Since information on the precise relationships between change in UEC, CFA, and tree size are not known, it was conservatively assumed that ??UECs don’t change in Equation 1 for C/I and I/T land uses.
Atmospheric Carbon Dioxide Reduction Sequestration (the net rate of CO2 storage in above- and below-ground biomass over the course of one growing season) is calculated for each species using tree growth equations for DBH and height described earlier in this appendix (see Tree Growth Modeling) to calculate either tree
87
volume or biomass. Equations from Pillsbury et. al (1998) are used when calculating volume. Fresh weight (kg/m3 ) and specific gravity ratios from Alden (1995, 1997) are then applied to convert volume to biomass. When volumetric equations for urban trees are unavailable, biomass equations derived from data collected in rural forests are applied (Tritton and Hornbeck 1982; Ter-Mikaelian and Korzukhin 1997).
Carbon dioxide released through decomposition of dead woody biomass varies with characteristics of the wood itself, fate of the wood (e.g., amount left standing, chipped, or burned), and local soil and climatic conditions. Recycling of urban waste is now prevalent, and we assume here that most material is chipped and applied as landscape mulch. Calculations were conservative because they assume that dead trees are removed and mulched in the year that death occurs, and that 80% of their stored carbon is released to the atmosphere as CO2 in the same year. Total annual decomposition is based on the number of trees in each species and age class that die in a given year and their biomass. Tree survival rate is the principal factor influencing decomposition. Tree mortality for Cheyenne was 2.0% for the first five years after out-planting and 0.8% every year thereafter, based on an average of the mortality rates, provided by the Urban Forester, unique to streets and parks (Olson, 2003). Finally, CO2 released from tree maintenance was estimated to be 0.08 kg CO2 /cm DBH based on tree maintenance activities which release 2.59 kg CO2 /tree based on carbon dioxide equivalent annual release of 43,994 kg (4,792 gallons of gasoline and diesel fuel use) and average tree diameter of 31.8 cm (Olson 2003)
Avoided CO2 Emissions Methodology Reductions in building energy use result in reduced emissions of CO2 . Emissions were calculated as the product of energy use and CO2 emission factors for electricity and heating. Heating fuel is
88
largely natural gas and fuel oil in Cheyenne. The overall fuel mix for electrical generation provided from Xcel Energy was primarily coal (69%), natural gas (14%), and nuclear (11%) (U.S. EPA 2003).
Emissions factors for electricity lb/MWh) and natural gas (lb/MBtu) weighted by the appropriate fuel mixes are given in Table B-5. Implied value of avoided CO2 was CA$0.0075/lb based on average high and low estimates for emerging carbon trading markets (CO2e.com 2002) (Table B-5). Values for criteria air pollutants were based on control-cost-based emissions for VOCs and damage-based emissions estimates for remaining pollutants using the methods of Wang and Santini (1995) (Table B-5). Emissions concentrations are from U.S. EPA (1998) and population estimates from the U.S. Census Bureau (2003)
Emission Factor Electricitya Natural gas b (lb/MWh) (lb/MBtu) CO2 NO 2 SO2 PM10 VOCs
1,905 3.440 6.890
118 0.0922 0.0006
0.776 0.0075 0.735 0.0054 a U.S. Environmental Protection Agency (2003) b U. S. Environmental Protection Agency 1998 c $15/ton for CO2 (CO2e.com 2002)
Implied value ($/lb) c 0.0075 2.53 0.54 0.10 1.96
d
Wang and Santini (1995)
Table B-5. Emissions factors and implied values for CO2 and criteria air pollutants.
Improving Air Quality
Avoided Emissions Methodology Reductions in building energy use also result in reduced emissions of criteria air pollutants from power plants and space heating equipment. This analysis considered volatile organic hydrocarbons (VOCs) and nitrogen dioxide (NO2 )—both precursors of ozone (O 3 ) formation—as
89
well as sulfur dioxide (SO2 ) and particulate matter of