PANOECONOMICUS, 2014, 4, pp. 441-469 Received: 23 January 2013; Accepted: 02 July 2013.
Mario Arturo Ruiz Estrada Faculty of Economics and Administration, University of Malaya, Malaysia
[email protected]
Donghyun Park Asian Development Bank, Philippines
[email protected]
UDC 330.131 (510:529) DOI: 10.2298/PAN1404441E Original scientific paper
China’s Unification: Myth or Reality? Summary: This paper evaluates the prospect of a possible unification between People’s Republic of China (Mainland China) and Republic of China (Taiwan) from a multi-dimensional perspective which encompasses the political, social, economic, and technological dimensions. The underlying idea is to evaluate the possibility of a partial or total reunification between the two countries in a more comprehensive way than just assessing the economic costs and benefits. Our evaluation is based on the application of the GDRI-Model, which looks at unification and regional integration simultaneously from the political, economic, social and technological perspectives. Key words: Economic unification, Economic modeling, Mainland China, Taiwan. JEL: F15.
China has been divided into two ideological, political, and economic systems - one based on communism and the other based on capitalism - since the Civil War ended in 1949 with the establishment of People’s Republic of China - PRC (Mainland China) on mainland China (Ya-Chen Su 2007). Both Chinas share a common tradition(s), people, language, history, and culture. Therefore, the political division of the two entities is an artificial relic of the Cold War. Nevertheless, the division is very real, and the Taiwan Straits which separate the two remains one of the most heavily militarized in the world. Since the early 1950s, Taiwan grew rapidly to become a newly industrialized economy (NIE) and one of the most successful economies in the world (Veselin Vukotić 2008; Siok Kun Sek and Wai Mun Har 2012). More recently, since the market reforms of 1978, the People’s Republic of China (Ge He 2013) has transformed itself from a typical developing region into the world’s second biggest economy (Shu Keng and Gunter Schubert 2010). Such fundamental differences in political systems complicate the prospects for unification. There are many parallels between the German unification - West Germany (capitalist) and East Germany (communist) - (Gwyn Adams, Lewis Alexander, and Joseph Gagnon 1993; Valeria De Bonis 1996; Erich Gundlach 2003; Wassily Kafouros 2009) which took place in 1990. This is perfectly understandable in light of the gaping difference in income levels (Guobo Huang and Clement Yuk-Pang Wong 1996) between the two Chinas. Notwithstanding, the rapid growth of the PRC, it is still far poorer and less developed than Taiwan, where industrialization began earlier. Therefore, German unification highlighted the potentially adverse effects of a possible unification for Taiwan (Young-Han Kim 2005). We apply the Global Di-
442
Mario Arturo Ruiz Estrada and Donghyun Park
mension of Regional Integration Model (GDRI-Model) to a comparative analysis of the development levels of the two Chinas in the 1980s, 1990s and 2000/2012.
1. Literature Review about Unification and Regional Integration In the past fifty decades different authors from different fields of research (economic, political and social view points) have explained the evolution and effects of unification or regional integration. Different theories and analytical tools have been developed and applied in these studies. All these theories and analytical tools permit visualize unification or regional integration from a single dimension of analysis (economic, political, social or technological). In our research, the single dimension of analysis is not enough to explain this complex and multi-dimensional phenomenon. For this reason, this paper suggests the creation and implementation of new monitoring model in the study of unification and regional integration. Unification and regional integration can be studied and researched based on different focuses and approaches. This paper applies four traditional fields of research in the study of unification and regional integration: economic, political, social and technological fields of research. In the first part of the research pertaining to this study, an effort was made to identify the inclination of the fields of research in the study of unification and regional integration. There are 150 papers (100%) on regional integration from different academic journals between the 1980s and the 2012 that were selected for this purpose. Next, the percentage of participation by fields of research (economic, political, social and technological) in the study of unification or regional integration was calculated. The following trend in terms of fields of research in the study of unification or regional integration was observed: 25% from the economic field of research, 65% from the political field of research, 9% from the social field of research and 1% from the technological field of research. It was also observed that, compared to the 1980s and 1990s, the topic of unification was more frequently researched and discussed in journals in the 1980s (35%) and 1990s (65%). Finally, this research shows that the concentration of studies (books and journal papers) about bilateral and multilateral unification is following by Germany (55%), Korea’s (25%), and China’s (10%). 1.1 Economics Field of Research in the Study of Unification and Regional Integration In the economic field of research (i.e. the largest field of research) in the study of unification and regional integration, attention was placed on three specific areas: economic theory, political economy and applied economics. Economic theory is divided into two parts, namely microeconomics and macroeconomics, each of which has a different focus. Some of these focuses are: partial or general (type of equilibrium), ex-post or ex-ante (method analysis), static or dynamic (behavior), short term or long term (time frame). Method analysis is either quantitative (econometrics, statistics and mathematics) or qualitative (in the form of comparative studies based on theories or historical data). It is observed that the study of unification and regional integration from the PANOECONOMICUS, 2014, 4, pp. 441-469
China’s Unification: Myth or Reality?
economic perspective mainly centers on macroeconomics applications (70%), quantitative methods (45%), partial equilibrium (70%), ex-ante approach (75%), static models (55%). Besides, these applications are used in the short term in most research. The common theories, models and theorems used by researchers in the economic field of research in the study of unification and regional integration are as follows. First, the study of international trade policy theoretical framework includes the basic tariff analysis, cost and benefits of trade, tariff and non-tariff trade barriers analysis, and the new protectionism according to Paul R. Krugman and Maurice Obstfeld (1988). Second, the study of optimal current area theory was introduced by Paul Kenny (2003) and Pierpaolo Benigno (2004). According to Walter Mattli (1999) the optimal current area is a balance between domestic factors (maintenance of full employment and stable internal average price level) and external factors (maintenance of balanced international payments equilibrium). The main idea to study the optimal currency area was developed because of a dilemma between introducing fixed versus flexible exchange rate. Therefore, Robert A. Mundell (1961) arguments that before applying the optimum currency area, it is necessary to ask what economic characteristics determine the optimum size of the domain of a single currency. Third, the study of fiscal federalism theory is an offshoot of public finance theory that analyzes the special fiscal problems which arise in federal countries, drawing on the literature on public goods, taxation, income distribution and public debt incidence, and various parts of location theory (Mattli 1999). The general objective of this theoretical approach is the improvement of market efficiency focused on the interaction of market and public goods. Fourth, the Heckscher-Ohlin (H-O) model (Paul Brenton, Henry G. Scott, and Peter J. N. Sinclair 1997) which is the whole theoretical construction concerning trade and production based upon a difference between countries in their factor endowments, and four hypotheses or propositions which arise from this model. The H-O model hypothesis that each country will export products that are intensive in the use of that country’s abundant factor of production (labor or capital), and will import products that are intensive factor of production (labor and capital) in the use of the country’s scarce factor of production. Fifth, the Kemp and Wan theorem present this proposition related to the formation of custom unions. “It considers any competitive world trading equilibrium, with any number of countries and commodities, and with no restrictions whatever on the tariffs and other commodity taxes of individual countries, and with costs of transportation fully recognized. Now let any subset of the countries form a customs union. Then there exists a common tariff vector and a system of lump-sum compensatory payments, involving only members of the union, such that there is an associated tariff-ridden competitive equilibrium in which each individual, whether a member of the union or not, is not worse off than before the formation of the union” (Arvind Panagariya and Krishna Pravin 2002). Sixth, the study of customs union theory can help to understand about the origins and evolution of regional integration or unification. “It is based on the free-trade point of view, whether a particular custom union is a move in the right or in the PANOECONOMICUS, 2014, 4, pp. 441-469
443
444
Mario Arturo Ruiz Estrada and Donghyun Park
wrong directions depends, therefore, so far as the argument has as yet been carried, on which of two types of consequences ensue from that custom union. Where the free trade-creating force is predominant, one of the members at least must benefit, both may benefit, the two combined must have a net benefit, and the world at large benefits; but the outside world loses, in the short-run at least, and can gain in the long-run only as the result of the general diffusion of the increased prosperity of the custom union. Where the Trade-diverting effect is predominant, one at least of the member countries is bound to be injured, both maybe injured, the two combined will suffer a net injury, and there will be injury to the outside world and to the world at large” (Claus Schnabel and Joachim Wagner 2005). Seventh, the second best theory was presented by Richard G. Lipsey and Kelvin Lancaster (1997). These two authors present a deeper study about the custom union theory of Viner based on the application of a positive dynamic method (general equilibrium) to explain the custom union effect on the world trade. The contribution of Lipsey and Lancaster in the custom union theory follows the Paretian optimum which requires the simultaneous fulfillment of all the optimum conditions based on the general economic problem of maximization. A function is maximized subject to at least one constraint, in this case production function and utility function. The customs union theory is still used today by many economists to choose between trade-creation and trade-diversion for evaluating unification. Therefore, Trade-creation effect occurs when some domestic production in a nation that is a member of the custom union is replaced by lower-cost imports from another member nation. Assuming that all economic resources are fully employed before and after the formation of the custom union, this production is based on comparative advantage. The Trade-diversion effect occurs when lower-cost imports from outside the custom union are replaced by higher-cost import from a union member, this result because of the preferential trade treatments given to member nation. Trade-diversion effect, by itself, reduces welfare because it shifts production from more efficient producers outside the custom union to less efficient inside in the union. Thus, trade-diversion worsens the international allocation of resources and shifts production away from comparative advantage (Dominick Salvatore 2007). However, the static analysis used in the customs union theory poses a problem: it frequently uses a partial competitive equilibrium framework to arrive at a general conclusion about a process that is a general equilibrium phenomenon (Robert Devlin and Ricardo Ffrench-Davis 1998). According to Alan L. Winters (1987), many economists are of the stand that trade-creation versus trade-diversion is not the core of the problem. The problem lies with the deficiency of the models of dynamics and empirical foundations used for testing them. In effect, Mordechai E. Kreinin and Michael G. Plummer (2003) point out that, economists whose research into regional integration is based on ex-post models include a gravity model, an import-growth simulation and other regression approaches. This is because computational general equilibrium (CGE) model (multicountry and multi-commodity dimension) has become very popular among economists. In fact, the CGE models are standard tools for analyzing trade policy. The case of general equilibrium models are: first, liking trade and productivity growth; second, foreign investment and productivity growth; third, endogenous PANOECONOMICUS, 2014, 4, pp. 441-469
China’s Unification: Myth or Reality?
growth and CGE modeling (Kreinin and Plummer 2003). Furthermore, the economic field of research merely applies the positive theories of welfare gains and losses associated with unification and regional integration; it provides no explanations of the political choices that allow for integrated fields of research. As such, the economic field of research negates the global context of the evolution and trend of unification and regional integration process as a whole. In a nutshell, this paper maintains that the economic field of research poses many limitations in the study of the effects of unification or regional integration, and that it is merely in one part of the complicated puzzle of unification and regional integration research. On this account, this study further maintains that the study of unification and regional integration requires a multi-dimensional analysis (economic, social, political and technological dimensions simultaneously). 1.2 Political, Social and Technological Fields of Research in the Study of Unification The study of unification and regional integration from the political dimension is also pervasive. It is observed that many studies on unification and regional integration involves extensive elaboration of the following politically oriented topics: institutional framework (functionalism or neo-functionalism), policy dimensions and agreements (negotiation) and international law issues. As observed, more qualitative rather than quantitative methods of evaluation are used in the political dimension of research. Just as in the economic dimension of research, the political dimension of research in the study of unification and regional integration has many limitations. However, as pointed out by Mattli (1999), the political context in which unification and regional integration occurs has been specified in the political dimension of research and this has provided insightful accounts of the process of unification. The third field of research, that is the social field of research, focuses on issues such as history, culture, education, social welfare programs and social policies applied by governments. Usually such research is in the form of comparative studies based on basic statistical comparison, feedbacks, interview results, history and social theoretical frameworks. Many of these studies are confined to highly important issues that are worthy of consideration in the study of the effects of unification and regional integration. The fourth field of research, that is the technological field of research, has a relatively smaller presence. It focuses mainly on four specific topics: regional electrical inter-connection, telecommunications, technology transfer, and research and development (R&D). Some of these research documents involve advanced technical terminologies and the application of quantitative methods (statistics and mathematics). 1.3 Previous Applications of GDRI-Model on Unification and Regional Integrations Cases According to our research about unification or regional integration between two countries or a single region is not a purely economic phenomenon but a multidimensional phenomenon. We evaluate the prospects of unification between RepubPANOECONOMICUS, 2014, 4, pp. 441-469
445
446
Mario Arturo Ruiz Estrada and Donghyun Park
lic of China (Taiwan) and People’s Republic of China (Mainland China) from a multi-dimensional perspective encompassing the political, social, economic and technological dimensions. To do so, we use the Global Dimension of Regional Integration Model developed by Mario Arturo Ruiz Estrada (2004, 2013). Our main finding is a wide and growing gap between the two Chinas’ in terms of political, social, economic and technological development as well as overall development. This suggests that inter-Chinas’ unification is likely to be a costly and disruptive process. According to our research the GDRI-Model was applied on different regional integration and unifications research papers such as the system of indicators for monitoring regional integration processes by Philippe De Lombaerde, Giulia Pietrangeli, and Chatrini Weeratunge (2008), the Korean unification by Ruiz Estrada and Donghyun Park (2008), oscilation theory of international economic integration by Ravshanbek T. Dalimov (2009), the MERCOSUR regional integration by Mirian B. S. Braun, Rubiane D. Cardoso, and André R. Bechlin (2011), the European Union integration by Emil Erjavec and Guna Salputra (2012), practical tools to monitoring convergence, integration, and development: compare and apply by Yvonne Sperlich and Stefan Sperlich (2012), unification: why Germany, not Korea by Yikai Zhou (2012), modeling Korean unification by Marcus Noland, Sherman Robinson, and Tao Wang (2000) and others. After, we did an exhaustive revision paper by paper that was mentioned before, we can observe that the GDRI-Model show high effectiveness and an easy applicability to analyze any case of unification or regional integration case. Hence, we can proceed to apply the GDRI-Model to simulate certain scenarios of a possible unification between Republic of China and People’s Republic of China. The original paper of GDRI-Model by Ruiz Estrada (2004, 2013) provides evidences that there is causation between convergence of its four independent variables, such as, political development (X1) will show the level of political environmental that this specific region shows, social development (X2) is interested to show trend of the social agenda under regional level, economic development (X3) will present the economic trend that the region shows, and technological development (X4) is trying to present the level of technology development that this specific region shows. Each regional development indices (Xi) by area together will try to present the different stages that any country can chart its own evolution. It is possible to observe in the application of GDRI-Model on the original working paper that is based on the study of different regional integration process and unification cases: between developed countries and developing countries, North-South Integration, e.g. within Europe Union - EU (Nicole Attia and Valérie Bérenger 2009), between developed and developing countries (e.g. within North America Free Trade Area - NAFTA), between developing countries or South-South Integration (e.g. within MERCOSUR and ASEAN), and between developing and less developed countries (e.g. within Central America Common Market - CACM), and Korean unification. Hence, the idea is to demonstrate that the regional development (RD) can affect the evolution of unification or regional integration process considerably. Hence, RD originates from the different levels of political, social, economic and technological development that each member in the same region shows. If the
PANOECONOMICUS, 2014, 4, pp. 441-469
China’s Unification: Myth or Reality?
gap of all areas of development (political, social, economic and technological) among all members is considerable large then the regional integration process can experiment serious difficulties. It is based on the application of a group of indexes and graphs. The group of indexes and graphs show the evolution and stages of the unification or regional integration process of different countries from a multidimensional analysis. It is assumed in the GDRI-Model that the basic pre-condition to start a stronger unification or regional integration process in any type of unification or regional integration is a stronger domestic development experienced by each country or domestic development system (DDS) in the same region. Another pre-condition for a stronger unification or regional integration process is a combination of historical timing and political and social willingness. For the latter, the countries involved must be interested in creating a formal or informal agreement with all its members so as to consolidate themselves into a single country or region. The difference between the GDRI-Model and the traditional models of analysis is that GDRI-Model will analyze unification or regional integration from a new perspective of analysis under a multi-dimensional analysis based on the study of all areas that domestic development evolve such as political development, social development, economic development and technological development. It allows for the detection of the pros and cons in the evolution of unification or regional integration between two countries or a single region from a different perspective. The main idea is to show that successful unification depends on majority of the members being interested in building a single country or region and there cannot be large margin of difference in the domestic development (political development, social development, economic development and technological development) among its members. The objective of the GDRI-Model is to offer to policy-makers and researchers a new alternative analytical tool for studying the results achieved with unification or regional integration. This will benefit the parties concerned in their policy-making and program development.
2. An Introduction to the Global Dimension of the Regional Integration Model According to this paper the economic, political, social and technological dimensions of research into regional integration clearly do not provide a global perspective in the understanding of regional integration. For this reason, the GDRI-Model is proposed in this paper to address the issue. The GDRI-Model is a measuring tool for studying regional integration from a global perspective. The proposed GDRI-Model is a simple and flexible model. It applies dynamic and general equilibrium analysis to show the past and present situations in the regional integration process of any region based on a set of indexes and graphs. Its field application is not constrained by region or the development stage of each member interested in integrating into a single regional bloc. The application of the GDRIModel is based on the characteristics, conditions and historical moments of a region’s regional integration development.
PANOECONOMICUS, 2014, 4, pp. 441-469
447
448
Mario Arturo Ruiz Estrada and Donghyun Park
2.1 The Domestic Development System Concept This part of the research presents a new concept entitled the domestic development system. The DDS incorporates all economic, political and social characteristics that any country may show in its different phases of development. The GDRI-Model assumes that each country has its own domestic development system. At the same time, it defines regional integration as the joining of a certain number of different countries (or domestic development systems) that are interested in creating a strong regional development system (RDS). The DDS concept is based on five assumptions: Change within the DDS in any country cannot be forced, it can only be induced by material incentives and motivation; The DDS of any country is spurred onwards by the limited nature of resources; Each DDS has its unique set of characteristics, therefore it might be difficult to try to implement a successful DDS in another, less successful DDS; The RDS concept attempts to integrate different DDS into a regional integration agreement (RIA) depending on the different DDS that are available for integration into a single regional system; The creation of a regional development system depends on the flexibility of each DDS. The domestic development system concept offers a new perspective of analysis and research in the field of regional integration and development economics. The traditional research is based on economic, political, social and technological points of view; but the DDS concept makes it possible to visualize different countries’ developments from a global perspective. 2.2 Phases in the Global Dimension of the Regional Integration Model 2.2.1 Phase I: Design of the Multi-Input Database Table The multi-input database table is an alternative style of database analysis framework that permits the storage of large amounts of data to measure a single variable. This single variable can show the evolution of any phenomenon from a general perspective. The multi-input database table is designed to evaluate either by country or region. The multi-input database table is focused on measuring four main independent variables (e.g. X1, X2, X3 and X4). Each main independent variable is formed by n number of sub-variables. The number of sub-variables in each main independent variable is nonlimited; for this reason, the multi-input database table concept does not have any specific ranking. Instead, there exists a basic classification of sub-variables. Only two main independent variables have a classification. First, political (X1) is divided into two large sections, external and internal factors (see Table 1). Second, economic (X3) is divided into production, consumption, trade, labor, investment, infrastructure, government and international cooperation (see Table 3). However, each sub-variable has a code number respectively. The code number depends on the area of development (X1 = political; X2 = social; X3 = economic; X4 = technological). The reason that all PANOECONOMICUS, 2014, 4, pp. 441-469
China’s Unification: Myth or Reality?
sub-variables have the same importance (weight) is because we are interested in measuring a single value; in this case, each main independent variable (X1, X2, X3 and X4). To give the same weight to all sub-variables, it is necessary to use a binary system. The binary system helps to maintain a balance among all variables in each multi-input database table. Another reason is that the binary system helps to create an alternative model of analysis when it comes to countries with limited information, especially in the case of developing countries and less developed countries (LDC’s). The idea of applying a multi-input database is to find the domestic development system (country) and finally the regional development (regional bloc). The idea of finding the DDS and the RD is to demonstrate that successful regional integration process depends on the major part of the DDS being strong enough; there can only be a small gap between its members. In this case, the RD is result of the sum of the component DDS. The four main independent variables will show the RD in different areas of development; political (X1), social (X2), economic (X3) and technological (X4). The number of variables used in the GDRI-Model varies, depending on the objectives of the researchers or policy-makers and the orientation of the cases of research. In the case of this thesis, 98 variables with their respective tables and parameters were selected: 19 variables for regional political development index - X1 (see Table 1); 15 variables for regional social development index - X2 (see Table 2); 54 variables for regional economic development index - X3 (see Table 3) and 10 variables for regional technological development index - X4 (see Table 4). Once the number of sub-variables is determined, the next step is to collect the statistical and historical data that constitute sub-variables (n number) in each main independent variable (X1, X2, X3 and X4). All sub-variables within each main independent variable (X1, X2, X3 and X4) may not have a direct relationship between them - they may be independent variables or endogenous variables. However, all the subvariables in each multi-input database table are meant to measure a single variable or main independent variable, that is, each of the regional development indexes (Xi). Each of the four Xi indexes (X1, X2, X3 and X4) to be measured is viewed as a main independent variable (i.e. endogenous variable). However, there is no connection or interdependency among these four Xi indexes when they are joined in the graph. These four Xi indexes are used to draw a graph that represents the evolution and stages of the regional integration process of the region from a general perspective. 2.2.1.1 Types of Multi-Input Database Tables The first type of multi-input database table pertains to “country or domestic system development”. It uses N number of variables. The number N is decided by researchers or policy-makers. The number of cases in the study is represented by M. In the case of the GDRI-Model, M represents only one country (i.e. a domestic system development). The time factor T depends on the time parameters that the researchers or policy-makers are interested in using. Therefore, T can be in terms of years or decades. The second type of multiinput database table pertains to “region or regional system development”. All the conditions and functions of N, M and T factors are the same as that in the first type of PANOECONOMICUS, 2014, 4, pp. 441-469
449
450
Mario Arturo Ruiz Estrada and Donghyun Park
multi-input database table, except that M here represents a “region or regional system development” rather than a “country or domestic system development”. For this chapter, the second type of multi-input database (by region) is adopted. 2.2.2 Phase II: Measurement of Regional Development Indexes (Xi) The second phase of the implementation of the GDRI-Model involves the measurement of regional development indexes (Xi) using the variables in four basic multiinput database tables (see Figure 1). The regional development indexes are regional political development index (X1) originates from the calculus obtained from the politics, social, economics, and technological multi-input database table (see Tables 1, 2, 3 and 4). After we obtain the result of Xi (i =1, 2, 3, 4), we can proceed to classify the results into three different parameters. These parameters are: under-developed stage or level 1 (0 ≤ Xi (i =1, 2, 3, 4) ≤ 0.33), Xi (i =1, 2, 3, 4) index is developing stage or level 2 (0.34 ≤ Xi (i =1, 2, 3, 4) ≤ 0.66) and Xi (i =1, 2, 3, 4) index is developed stage or level 3 (0.67 ≤ Xi (i =1, 2, 3, 4) ≤ 1). These variables are analyzed with their codes, descriptions, parameters and sources respectively (see Tables 1, 2, 3 and 4). The parameters are divided into two categories. The categories are: (i) Quantitative variables: (i.a) The measurement of the regional variation rate (RVR) consists of two phases. The first phase is to measure the variation rate by country (VRC). The VRC is calculated based on two periods: present period data minus last period data. The data of each period can be in percentage or absolute values. In the second phase, the sum of all VRC is divided by the total number of countries in the trade bloc. The end result is the number RVR. RVR = ΣVRC / Total number of countries. RVR = Σ(Present period data – Last period data) / Total number of countries.
(1)
The RVR can then be compared against each VRC. The final result obtained presents two possible scenarios: first, if RVR ≤ VRC then this specific country in the trade bloc obtains a value of 1; second, if RVR ≥ VRC then this specific country in the regional bloc obtains a value of 0; (i.b) The regional average rate (RAR) is obtained by dividing the sum of the local input data of each country in the trade bloc by the total number of countries in the trade bloc. RAR = ΣLocal input data / Total number of countries.
(2)
The RAR is a fixed parameter that can be compared against each local input data by country. The final result of the RAR presents two possible scenarios: first, if the RAR ≥ country value, then the final data has the average rate of 0; second, if the RAR ≤ country value, then the final data has the average rate of 1.
PANOECONOMICUS, 2014, 4, pp. 441-469
China’s Unification: Myth or Reality?
(ii) Qualitative variables: (ii.a) The historical data focalization (HDF) can be classified by existence (i.e. an attempt is made to prove if 1 = existing data or 0 = non-existing data). This type of qualitative variable provides an alternative way to measure non-quantitative variables that affect ranking regional integration process; (ii.b) The ranking list (RL) originates from the best results of certain areas (social, economic, political and technological) in some countries. The RL can be found in international organizations such as United Nations, World Bank, International Monetary Fund, etc. The size of the RL is determined by the researcher or policy maker interested in applying the RL. Once the RL is established, countries in the trade bloc can be compared. The RL can present two possible results: first, if the country in the trade bloc is found in the RL, then this country receives a value of 1; second, if the country in the trade bloc cannot be found in the RL, then this country receives a value of 0. Table 1 Regional Political Development Index (X1) Political factors list Code
Variables
P.1.
External factors
Country C1
C2
C3
…Cn
AS
TPR
P.1.1.
Colonization (country)
1 or 0
1 or 0
1 or 0
1 or 0
∑1
T1
P.1.2.
Group negotiation power
1 or 0
1 or 0
1 or 0
1 or 0
∑2
T2
P.1.3.
Foreign policy influences
P.1.3.1.
Regional
1 or 0
1 or 0
1 or 0
1 or 0
∑3
T3
P.1.3.2.
Global
1 or 0
1 or 0
1 or 0
1 or 0
∑4
T4
1 or 0
1 or 0
1 or 0
1 or 0
∑5
T5
P.1.4. P.2.
Negotiation style Internal factors
P.2.1.
International organizations support
1 or 0
1 or 0
1 or 0
1 or 0
∑6
T6
P.2.2.
Regional institutions role
1 or 0
1 or 0
1 or 0
1 or 0
∑7
T7
P.2.3.
Political regime
1 or 0
1 or 0
1 or 0
1 or 0
∑8
T8
P.2.4.
Legislative background
1 or 0
1 or 0
1 or 0
1 or 0
∑9
T9
P.2.5.
Internal security
1 or 0
1 or 0
1 or 0
1 or 0
∑10
T10
P.2.6.
Human rights
1 or 0
1 or 0
1 or 0
1 or 0
∑11
T11
P.2.7.
Border problems
1 or 0
1 or 0
1 or 0
1 or 0
∑12
T12
P.2.8.
Political stability
1 or 0
1 or 0
1 or 0
1 or 0
∑13
T13
P.2.9.
Political structure and public administration
1 or 0
1 or 0
1 or 0
1 or 0
∑14
T14
P.2.10.
Army size
1 or 0
1 or 0
1 or 0
1 or 0
∑16
T15
P.2.11.
Bureaucracy level
1 or 0
1 or 0
1 or 0
1 or 0
Total Total (%)
∑17
T16
∑AS
∑TPR
AS
100%
Note: Ci = country from the same trade bloc; AS = actual situation; TPR = total of possible results; Xi = total global development (∑AS / ∑TPR). Source: Ruiz Estrada (2013).
PANOECONOMICUS, 2014, 4, pp. 441-469
451
452
Mario Arturo Ruiz Estrada and Donghyun Park
Table 2 Regional Social Development Index (X2) Social factors list Code
Variables
S.1.
Literacy
Country C1
C2
C3
…Cn
AS
TPR
1 or 0
1 or 0
1 or 0
1 or 0
∑1
T1
S.2.
Social problems (crime and drugs)
1 or 0
1 or 0
1 or 0
1 or 0
∑2
T2
S.3.
Health and medical programs
1 or 0
1 or 0
1 or 0
1 or 0
∑3
T3
S.4.
External culture influence
1 or 0
1 or 0
1 or 0
1 or 0
∑4
T4
S.5.
Food security
1 or 0
1 or 0
1 or 0
1 or 0
∑5
T5
S.6.
Public education
1 or 0
1 or 0
1 or 0
1 or 0
∑6
T6
S.7.
Low cost housing projects
1 or 0
1 or 0
1 or 0
1 or 0
Total Total (%)
∑7
T7
∑AS
∑TPR
AS
100%
Note: Ci = country from the same trade bloc; AS = actual situation; TPR = total of possible results; Xi = total global development (∑AS / ∑TPR). Source: Ruiz Estrada (2013).
Table 3 Regional Economic Development Index (X3) Economics factors list Code
Variables
E.1.
Production
E.1.1.
Country C1
C2
C3
…Cn
AS
TPR
1 or 0
1 or 0
1 or 0
1 or 0
∑1
T1
GDP structure
E.1.1.1.
Agriculture
E.1.1.2.
Industry
1 or 0
1 or 0
1 or 0
1 or 0
∑2
T2
E.1.1.3.
Services
1 or 0
1 or 0
1 or 0
1 or 0
∑3
T3
1 or 0
1 or 0
1 or 0
1 or 0
∑4
T4
E.1.2.
GDP (%)
E.1.3.
Natural resources
1 or 0
1 or 0
1 or 0
1 or 0
∑5
T5
E.1.4.
Market location
1 or 0
1 or 0
1 or 0
1 or 0
∑6
T6
E.1.5.
Economic development stage
1 or 0
1 or 0
1 or 0
1 or 0
∑7
T7
E.1.6.
Subsidies level
1 or 0
1 or 0
1 or 0
1 or 0
∑8
T8
E.1.7.
Environmental protection
1 or 0
1 or 0
1 or 0
1 or 0
∑9
T9
E.1.8.
Industrial concentration in large cities
1 or 0
1 or 0
1 or 0
1 or 0
∑10
T10
E.1.9.
Production and export structure
1 or 0
1 or 0
1 or 0
1 or 0
∑11
T11
E.1.10.
Oil production and energy resources
1 or 0
1 or 0
1 or 0
1 or 0
∑12
T12
Copyright regulations
1 or 0
1 or 0
1 or 0
1 or 0
∑13
T13
1 or 0
1 or 0
1 or 0
1 or 0
∑14
T14
E.1.11. E.2. E.2.1.
Consumption Income per capita
E.2.2.
Buyer purchase
1 or 0
1 or 0
1 or 0
1 or 0
∑15
T15
E.2.3.
Market size
1 or 0
1 or 0
1 or 0
1 or 0
∑16
T16
E.2.4.
Poverty level
1 or 0
1 or 0
1 or 0
1 or 0
∑17
T17
E.2.5.
Inflation rate
1 or 0
1 or 0
1 or 0
1 or 0
∑18
T18
E.2.6.
Wealth distribution
1 or 0
1 or 0
1 or 0
1 or 0
∑19
T19
PANOECONOMICUS, 2014, 4, pp. 441-469
China’s Unification: Myth or Reality?
E.2.7. E.3.
Saving rate
1 or 0
1 or 0
1 or 0
1 or 0
∑20
T20
Trade
E.3.1.
Intra-regional trade volume
1 or 0
1 or 0
1 or 0
1 or 0
∑21
T21
E.3.2.
Extra-regional trade volume
1 or 0
1 or 0
1 or 0
1 or 0
∑22
T22
E.3.3.
Intra-regional tariff structure application
E.3.3.1.
Tariff barriers level
1 or 0
1 or 0
1 or 0
1 or 0
∑23
T23
E.3.3.2.
Non-tariff barriers level
1 or 0
1 or 0
1 or 0
1 or 0
∑24
T24
E.3.4.
Opening economy to the world
1 or 0
1 or 0
1 or 0
1 or 0
∑25
T25
E.3.5.
Monopoly controls
1 or 0
1 or 0
1 or 0
1 or 0
∑26
T26
1 or 0
1 or 0
1 or 0
1 or 0
∑27
T27
Urban
1 or 0
1 or 0
1 or 0
1 or 0
∑28
T28
Rural
E.4.
Labor
E.4.1.
International social division
E.4.2.
Labor concentration
E.4.2.1.
1 or 0
1 or 0
1 or 0
1 or 0
∑29
T29
E.4.3.
E.4.2.2.
Immigration level
1 or 0
1 or 0
1 or 0
1 or 0
∑30
T30
E.4.4.
Emigration level
1 or 0
1 or 0
1 or 0
1 or 0
∑31
T31
E.4.5.
Population growth
1 or 0
1 or 0
1 or 0
1 or 0
∑32
T32
E.4.6.
Labor productivity
1 or 0
1 or 0
1 or 0
1 or 0
∑33
T33
E.5.
Investment
E.5.1.
Domestic direct investment (DDI)
1 or 0
1 or 0
1 or 0
1 or 0
∑34
T34
E.5.2.
Intra-regional direct investment (IDI)
1 or 0
1 or 0
1 or 0
1 or 0
∑35
T35
E.5.3.
Foreign direct investment (FDI)
1 or 0
1 or 0
1 or 0
1 or 0
∑36
T36
E.5.4.
Privatization process
1 or 0
1 or 0
1 or 0
1 or 0
∑37
T37
E.5.5.
Interest rate
1 or 0
1 or 0
1 or 0
1 or 0
∑38
T38
E.5.6.
Exchange rate stability
1 or 0
1 or 0
1 or 0
1 or 0
∑39
T39
E.5.7.
Stock market activity
1 or 0
1 or 0
1 or 0
1 or 0
∑40
T40
E.6.
Infrastructure
E.6.1.
Domestic physical infrastructure
1 or 0
1 or 0
1 or 0
1 or 0
∑41
T41
E.6.2.
Transportation system
1 or 0
1 or 0
1 or 0
1 or 0
∑42
T42
E.6.3.
Intra-regional physical projects
1 or 0
1 or 0
1 or 0
1 or 0
∑43
T43
E.6.4.
Tourism facilities
1 or 0
1 or 0
1 or 0
1 or 0
∑44
T44
E.6.5.
Telecommunications
1 or 0
1 or 0
1 or 0
1 or 0
∑45
T45
E.6.6.
Electricity production
1 or 0
1 or 0
1 or 0
1 or 0
∑46
T46
E.7. E.7.1.
Government Taxation
E.7.1.1.
Indirect
1 or 0
1 or 0
1 or 0
1 or 0
∑47
T47
E.7.1.2.
Direct
1 or 0
1 or 0
1 or 0
1 or 0
∑48
T48
E.7.2.
Domestic debt
1 or 0
1 or 0
1 or 0
1 or 0
∑49
T49
E.7.3.
Foreign debt
1 or 0
1 or 0
1 or 0
1 or 0
∑50
T50
E.7.4.
Government expenditures 1 or 0
1 or 0
1 or 0
1 or 0
∑51
T51
E.7.4.1.
Operational and administrative
PANOECONOMICUS, 2014, 4, pp. 441-469
453
454
Mario Arturo Ruiz Estrada and Donghyun Park
E.7.4.2. E.7.5.
Investment Trade promotion expenditures
1 or 0
1 or 0
1 or 0
1 or 0
∑52
T52
1 or 0
1 or 0
1 or 0
1 or 0
∑53
T53
E.7.6.
Corruption
1 or 0
1 or 0
1 or 0
1 or 0
∑54
T54
E.7.7.
Planning economy (medium-run)
1 or 0
1 or 0
1 or 0
1 or 0
∑55
T55
E.8.
International cooperation
E.8.1.
Financial
1 or 0
1 or 0
1 or 0
1 or 0
∑56
T56
E.8.2.
Technical
1 or 0
1 or 0
1 or 0
1 or 0
∑57
T57
∑AS
∑TPR
AS
100%
Total Total (%)
Note: Ci = country from the same trade bloc; AS = actual situation; TPR = total of possible results; Xi = total global development (∑AS / ∑TPR). Source: Ruiz Estrada (2013).
Table 4 Regional Technological Development Index (X4) Technology factors list Code
Variables
Country C1
C2
C3
…Cn
AS
TPR
T.1.
Technology (R&D) level
1 or 0
1 or 0
1 or 0
1 or 0
∑1
T1
T.2.
Internet hosts
1 or 0
1 or 0
1 or 0
1 or 0
∑2
T2
T.3.
Software production
1 or 0
1 or 0
1 or 0
1 or 0
∑3
T3
T.4.
Internet access
1 or 0
1 or 0
1 or 0
1 or 0
∑4
T4
T.5.
Telecommunications (mobil phones)
1 or 0
1 or 0
1 or 0
1 or 0
∑5
T5
T.6.
Research institutes
1 or 0
1 or 0
1 or 0
1 or 0
∑6
T6
T.7.
Biotechnology advances
1 or 0
1 or 0
1 or 0
1 or 0
∑7
T7
T.8.
Import of new technologies
1 or 0
1 or 0
1 or 0
1 or 0
∑8
T8
T.9.
R&D public investment
1 or 0
1 or 0
1 or 0
1 or 0
∑9
T9
T.10.
Technology information development
1 or 0
1 or 0
1 or 0
1 or 0
∑10
T10
∑AS
∑TPR
AS
100%
Total Total (%)
Note: Ci = country from the same trade bloc; AS = actual situation; TPR = total of possible results; Xi = total global development (∑AS / ∑TPR). Source: Ruiz Estrada (2013).
2.2.2.1 Steps to Obtain Regional Development Indexes (Xi) There are four regional development indexes (Xi) to be obtained. These four Xi indexes are: regional political development index (X1), regional social development index (X2), regional economic development index (X3) and regional technological development index (X4). The first step is to define all variables and parameters. Once all the variables and parameters are defined, all the data based on the variables and parameters is listed in each multi-input database table. The next step is to add the values of all variables in the column of the actual situation (AS) in each multi-input database table. The total possible results (TPR) obtained are then located in the TPR column next to AS column. With the TPR in place, the next step is to compute each regional PANOECONOMICUS, 2014, 4, pp. 441-469
China’s Unification: Myth or Reality?
development index (Xi). The computation is done by applying the Equation (3) to the values in the multi-input database tables. 4
X i X i ASi 100 / TPRi .
(3)
i 1
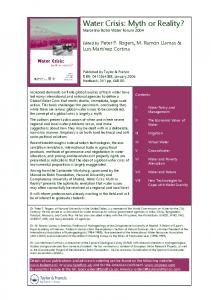
Following the above four steps, the fifth step is the plotting of two graphs: (a) the regional development indexes (Xi) and (b) the regional political, social, economic and technological diagnostic (see Figure 1). The latter graph serves as a means to study the balance between achievements and difficulties that any region may experience in its regional integration process. 2.2.2.2 Introduction to Analysis of the RD Index and the RIS Index Each of the regional global index (Xi) plays an important role in the measurement of the regional development index and the regional integration stage (RIS) index. These two indexes can be affected by any change in the Xi indexes in the short and long term. The Xi indexes may reflect one of two different scenarios. First, if some or all regional development indexes which are political (X1), social (X2), economic (X3) and technological (X4) increase, then the RD index and the RIS index may increase. The second scenario is that if some or all regional development indexes (Xi) by area of development (political, social, economic and technological) decrease, then the RD index and the RIS index may decrease. 2.2.3 Phase III: Measurement of the Regional Development Index The third phase of the implementation of the GDRI-Model presents a general definition of the regional development indexes (Xi). The RD index is an indicator to compare different historical periods of the regional integration process in any region. It is based on the regional development indexes (Xi) of a region. Therefore, the RD index is a mean for analyzing the evolution of any regional integration process from a global perspective. 2.2.3.1 Steps to Obtain the RD Index The first step is to plot each (Xi) index: regional political development index (X1), regional social development index (X2), regional economic development index (X3) and regional technological development index (X4) on the Cartesian plane (see Figure 1). It should be noted that the RD index value (single percentage) is an approximation of the past and present situations that any trade bloc may encounter in its evolution. The RD index is the summation of all the four regional development indexes (Xi). The second step is to plot the regional development graph based on the total value of the four regional development indexes (Xi). This is followed by the calculation of the regional technological index (X4) based on Equation (4). It should be noted that the values of the Xi indexes are independent of one another. The regional development graph consists of four different areas, where each area has a limit equivalent to 0.25. The total value of these four areas is equal to 1 as observed in Equation (4.6). PANOECONOMICUS, 2014, 4, pp. 441-469
455
456
Mario Arturo Ruiz Estrada and Donghyun Park
Each axis of Figure 1 is either the base or the height of the graph (represented by B and H respectively in the graph). The RD1 uses the result of the global development index in the axis X1 which is equal to B1, and the global development index in the axis X2 which is equal to H1, followed by the application of Equation (4.1). The same steps and expression are used for RD1, RD2, RD3 and RD4. The total RD index for this period is the sum of all the RDs. This is depicted in Equation (4.5). The total area is divided into four dissimilar triangles each with an area equal to {Base(=Bi) x Height(=Hi)}/2. Therefore, the triangle areas have to be summed up to derive the total surface area, see Equation (4.5). 4
4
RD Base( X ) xHeight ( H )/ 2. i 1
i
i 1
i
i
(4)
[B1 = H4]: RD1 = {X1(=B1) x X2(=H1)}/2.
(4.1)
[B2 = H1]: RD2 = {X2(=B2) x X3(=H2)}/2.
(4.2)
[B3 = H2]: RD3 = {X3(=B3) x X4(=H3)}/2.
(4.3)
[B4 = H3]: RD4 = {X4(=B4) x X1(=H4)}/2.
(4.4)
RD = RD1 + RD2 + RD3 + RD4.
(4.5)
B = Base; H = Height. The main reason to apply this formula is based on the measurement of the area of the four sided figure on the horizontal plane. Therefore, the value of each area will be used to measure the final result on the origin (Y) or fifth axis. Y is based on the result of the four triangle areas under the horizontal plane. 2.2.3.2 Analysis of the RD Index The analysis of the RD index is based on the comparison of two periods or regions. In the case of this thesis, two periods (i.e. first period and second period) are compared. The total RD index may present three possible scenarios, namely: (1) expansion (RD’ first period < RD’’ second period); (2) stagnation (RD’ first period = RD’’ second period); (3) contraction (RD’ first period > RD’’ second period). In terms of time-span, the RD index can be measured and compared on a yearly basis, five-yearly basis, and by decades. For this research, the time-span is divided into three specific decades (the 1980s, 1990s to the 2000/2012), which can later be compared. In terms of space, the RD index can be measured and compared in relation to countries or regional blocs. At any historical moment, the regional integration process in any region is based on the comparison of the size of the regional development index (Xi). 2.2.4 Phase IV: Measurement of the Regional Integration Stage Index The last phase in the implementation of the GDRI-Model is the measurement of the regional integration stage index. The RIS index measures the degree or stage of the regional integration development that any region achieves in its different stages of evolution. The RIS index is considered a dependent variable in the GDRI-Model. PANOECONOMICUS, 2014, 4, pp. 441-469
China’s Unification: Myth or Reality?
Source: Ruiz Estrada (2013).
Figure 1 Regional Development Index
In the measurement of the RIS index, four regional development indexes (Xi) are used: regional political development index (X1), regional social development index (X2), regional economic development index (X3) and regional technological development index (X4). A constant coefficient - regional integration approach inclines (RIAI) - is also used concurrently. The RIAI is represented by a, b, c and d in Equation (5) and is applied to each global development index (Xi). Each RIAI (a, b, c or d) has a limit that is equal to 1 refer to Equation (5). The weighted sum of the RIAI’s cannot be more than 1. The application of the RIAI is twofold. The first application is the RIAI homogeneous interest. In this application, each RIAI has the same level of importance in the analysis - refer to Equation (5.1). The second application is the RIAI incline. There are four possibilities in this application: political approach incline - Equation (5.2), social approach incline - Equation (5.3), economic approach incline - Equation (5.4) and technological approach incline - Equation (5.5). 2.2.4.1 Analysis of the RIS Index After the type of RIAI to be applied is determined, the regional integration stage index is measured according to Equation (5). The RIS index analysis may reveal one of three different scenarios, namely: (i) under-developed stage (0 ≤ RIS ≤ 0.33); (ii) developing stage (0.34 ≤ RIS ≤ 0.66); (iii) developed stage (0.67 ≤ RIS ≤ 1). The analysis of the RIS index can provide a general idea or approximation of the stage of regional integration achieved in any region through time and space. The following is a suggested combination of the application of the RIAI in the measurement of the RIS index: Y = RIS = aX1 + bX2 + cX3 + dX4 ≤ 1. a = 0.25, b = 0.25, c = 0.25, d = 0.25 = 1 => RIAI homogeneous interest.
(5) (5.1)
PANOECONOMICUS, 2014, 4, pp. 441-469
457
458
Mario Arturo Ruiz Estrada and Donghyun Park
a = 0.40, b = 0.20, c = 0.20, d = 0.20 = 1 => RIAI political approach incline.
(5.2)
a = 0.20, b = 0.40, c = 0.20, d = 0.20 = 1 => RIAI social approach incline.
(5.3)
a = 0.20, b = 0.20, c = 0.40, d = 0.20 = 1 => RIAI economic approach incline.
(5.4)
a = 0.20, b = 0.20, c = 0.20, d = 0.40 = 1 => RIAI technological approach incline.
(5.5)
It must be highlighted that the above combination represents only several of many possibilities or permutations. This should draw attention to the flexibility of the RIS index in adapting to any situation or chosen policy mode. The RIS index presents an approximation of the global development from the political, social, economic and technological perspectives concurrently based on a new concept of graphic representation. This new concept of graphic representation consists of five axes, each of which has a positive value (in the case of this research, the value in each axis is represented by a percentage). Once the axes of the graph are in place, the next step is to plot the four Xi indexes (political, social, economic, and technological) in four of the axes respectively. These Xi indexes are independent variables. The total value of the four axes is equal to 1 (see Figure 1). The RIS index (Y) is depicted as follows in Equation (6): Y = F(X1, X2, X3, X4) ≤ 1.
(6)
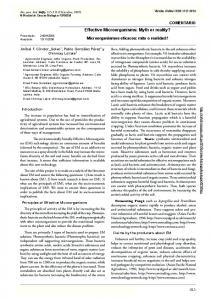
3. The Application of the GDRI-Model on the Analysis of a Possible Unification between the People’s Republic of China (Mainland China) and Republic of China (Taiwan) Initially, we can observe in Table 5 below an example of a multi-input database table with binary data inputted, and it shows the global political development of People’s Republic of China (Mainland China) and Republic of China (Taiwan) in the 1980s. The total for Taiwan is 8 or (8 x 100% / 15 = 53%) since there are 15 variables and the total for People’s Republic of China is 5 or (5 x 100% / 15 = 33%). The global political development of Taiwan and People’s Republic of China in the 1980s is thus 53% and 33%, respectively. We can similarly input binary data for all the variables in the multi-input database tables for social, economic and technological development of the two Chinas the 1980s. We find the global social development of Taiwan and People’s Republic of China in the 1980s to be 41% and 33%, the global economic development of Taiwan and People’s Republic of China in the 1980s to be 58% and 35%, and the global technological development of Taiwan and People’s Republic of China in the 1980s to be 58% and 38%. The third phase of the GDRI-Model is to use the four global development indices (Xi) we found in the model’s second phase - i.e. political, social, economic and technological - to estimate the global overall development index (Xi), which sums up the information contained in the four indices. PANOECONOMICUS, 2014, 4, pp. 441-469
China’s Unification: Myth or Reality?
Intuitively, the global overall development index (Xi) measures a region’s overall level of development from a multi-dimensional or global perspective encompassing political, social, economic and technological development. Furthermore, as we saw earlier, we measured political, social, economic and technological development themselves from a multi-dimensional or global perspective, using a wide range of variables relevant to the development of each sphere. The first step in estimating the global overall development index (Xi) is to plot the values of the four global development indices (Xi), as shown in Figure 1. This graph will help to illustrate how we compute Xi. Figure 2 consists of four different triangular areas - each bounded by the values of two of the four global development indices - for Taiwan, People’s Republic of China and the China’s. Let us define the triangular area between the political and social axes as A1, social and economic axes as A2, economic and technological axes as A3, and technological and political axes as A4. Each area has a maximum value of 0.25 and the total value of the four areas is 1. Political 60% 50% 40% 30% 20% 10% Technological
Social
Taiwan China
Economic
Source: See Table 5, i.e. Appendix.
Figure 2 The Global Overall Development of People’s Republic of China and Taiwan in the 1980s
We compute the overall global development index (X) as the sum of the four areas - A1, A2, A3 and A4. In computing A1, it is useful to think of the value of the global political development index (X1) as the base and the value of the global social development index (X2) as the height. We compute A1 by first multiplying X1 and X2, and then dividing their product by four. Similarly, we can compute A2, A3 and A4 by doing the same with the pairs (X2, X3), (X3, X4) and (X4, X1), respectively. For example, for Taiwan, A1 is 11% since X1 is 58% and X2 is 43%. Likewise, we compute A2, A3 and A4 for Republic of China to be 12%, 19% and 12%. Therefore, Taiwan’s overall global development index (Xi) is 49%. We can similarly compute X for China as 29%. Therefore, in the 1980s, Taiwan’s overall PANOECONOMICUS, 2014, 4, pp. 441-469
459
460
Mario Arturo Ruiz Estrada and Donghyun Park
development level was about three times higher than that of People’s Republic of China. The fourth and final phase of the GDRI-Model is to use the four global development indices (Xi) and coefficients to measure the global development stage (Y) of Taiwan and People’s Republic of China. The coefficient indicates the relative importance of the political, social, economic and technological dimensions, and sum up to one. For example, if we attach equal importance to the four dimensions, the coefficient for each dimension is 0.25. To obtain the global development stage (Y), we first multiply the global development index (Xi) with the corresponding coefficient - for example, the global political development index (X1) and the political coefficient and then sum up the four products. Assuming that each of the four coefficients is 0.25, so that the four dimensions are equally important, we can compute the global development stage (Y) for Taiwan and People’s Republic of China as 48% and 26%, respectively, in the 1980s. The large gap in Y between Republic of China and People’s Republic of China indicates a large gap between the two regions in terms of overall development. Figure 2 provides a graphical representation of global development stage (Y). The height corresponds to Y and the quadrangular area inside the dotted lines corresponds to the overall global development index (Xi). The global development stage (Y) is broadly similar to the global overall development index (X) since both reflect the overall development level of a region or a region. We define a value of Y between 0% and 33% as the underdeveloped stage, 34% and 66% as the developing stage, and 67% and 100% as the developed stage. Therefore, in the 1980s, Taiwan was in the developing stage whereas People’s Republic of China was in the underdeveloped stage. We should note that Y is more flexible than X in the sense that it allows us to attach any combination of relative weights to the political, social, economic and technological dimensions. For example, if we attach more importance to the political dimension than the other dimensions, the political coefficient may be 30% while the social, economic and technological coefficients may each be 25%. More generally, we can flexibly vary the relative sizes of the four coefficients to suit our needs. We now report the main results of our GDRI-Model analysis of the two Chinas during the 1980s and the 1990s. Taiwan’s global political development index (X1) increased from 53% in the 1980s to 57% in the 1990s and 60% in the 2000/2012, which indicates that Taiwan has become progressively more politically developed over time. This reflects Taiwan’s transformation from authoritarian military-based governments to a thriving pluralistic democracy. In contrast, the same index has remained a constant growth from 33% in 1980s until 41% in 2000/2012 for People’s Republic of China in the three decades, which is hardly surprising given that the region has remained a communist dictatorship with almost no freedom of expression. The large and growing gap between the two Chinas in political development does not bode well for the prospects of Chinese unification since common political values facilitate unification, as most clearly evident in the German unification. The social development of Taiwan has moved significantly forward in the 1980s and 1990s (see Figure 3), in contrast to People’s Republic of China, which has improve to make a lot progress in this area. Taiwan’s global social development in-
PANOECONOMICUS, 2014, 4, pp. 441-469
China’s Unification: Myth or Reality?
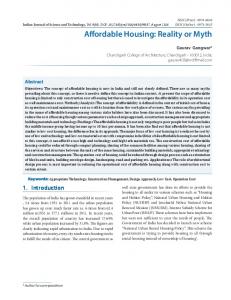
dex (X2) rose from 41% in the 1980s to 48% in the 1990s and 59% in the 2000/2012 (see Figure 4). To a large extent, this reflects Taiwan’s rapid economic development since basic social services such as healthcare and education tend to improve with a region’s living standards. In stark contrast, the same index increased from 33% in the 1980s and 2000/2012 to 40% for People’s Republic of China. The large gap in social development between the two Chinas and the consequent costliness of integrating the social systems of the two regions has negative implications for Chinas unification. The People’s Republic of China and Taiwan economy has achieved rapid growth and development in the last past 30 years. Taiwan’s global economic development index (X3) has more than doubled, from 58% in the 1980s to 73% in the 1990s and 88% in the 2000/2012. This is consistent with the region’s radical transformation from a poor developing region to a highly successful newly industrialized economy that has become a model of economic development for the Third World.
Source: See Table 5, i.e. Appendix.
Figure 3 The Global Overall Development of People’s Republic of China and Taiwan in the 1990s
On the other hand, for People’s Republic of China, the same index has expanded from 35% in the 1980s to 86% in the 2000/2012. The People’s Republic of China economy has improved to such an extent fast its economic growth. The closed growing economic between the two Chinas remains generate favorable conditions to unify both nations. It implies that the financial and economic costs of unification may be sustainably low for Taiwan. Taiwan has made substantial technological progress and has reached a high level of technological development, as evident in the evolution of its global technological development index (X4), which rose from 58% in the 1980s to 69% in the 1990s and 79% in the 2000/2012. This is hardly surprising in light of the fact that technological upgrading has been an essential ingredient of Taiwan’s successful economy. On the other hand, People’s Republic of China’s (X4) increases from 38% in the 1980s to 49% in the 1990s and 75% in the period 2000/2012. The small and dePANOECONOMICUS, 2014, 4, pp. 441-469
461
462
Mario Arturo Ruiz Estrada and Donghyun Park
creasing technological gap between the two regions decrease the technological costs of unification and thereby has positive implications for the prospects of unification. Table 5 below summarizes the global development of Taiwan and People’s Republic of China in the political, social, economic and technological spheres during the 1980s, 1990s and 2000/2012. Table 5 clearly shows an unmistakable difference between the two Chinas. In contrast to Taiwan, which has achieved substantial progress in all four spheres, but People’s Republic of China has also achieved to do so in many of the four spheres. The wide and growing inter-Chinas gap is not limited to economic development but extends to development in other areas as well. The fact that the Chinas are becoming more similar in all aspects rather than more similar does not bode well for their unification. Table 5 Political, Social, Economic and Technological Development of Taiwan and People’s Republic of China in the 1980s, 1990s and 2000/2012 Years
1980s
1990s
2000/2012
Regions
TW
PRC
TW
PRC
TW
PRC
Political
53%
33%
57%
37%
60%
41%
Social
41%
33%
48%
35%
59%
40%
Economic
58%
35%
73%
55%
88%
86%
Technological
58%
38%
69%
49%
79%
75%
Notes: TW = Taiwan; PRC = People’s Republic of China. Source: See Appendix.
Source: See Table 5, i.e. Appendix.
Figure 4 The Global Overall Development of People’s Republic of China and Taiwan in the 2000/2012
We now use the four global development indices (Xi) to estimate the global overall development index (Xi) for the two Chinas in the 1980s and 1990s. To repeat, PANOECONOMICUS, 2014, 4, pp. 441-469
China’s Unification: Myth or Reality?
the global overall development index (Xi) measures a region’s overall level of development from a multi-dimensional perspective encompassing the political, social, economic and technological aspects. The evolution of each aspect over time confirms the picture of a shorter gap between both Chinas. Taiwan has managed to reach a high overall development level through rapid progress in all four areas whereas China’s overall development level continues to expand at a very high level. We use the four global development indices (Xi) and coefficients reflecting the relative importance of each Xi to measure the global development stage (Y) of Taiwan and People’s Republic of China in the 1980s and 1990s. To repeat, the global development stage (Y) is similar to the global overall development index (Xi) in the sense that both reflect a region’s overall development level. Assuming that each coefficient is 0.25, so that the political, social, economic and technological dimensions are equally important, we compute the global development stage (Y) for Taiwan and People’s Republic of China to be 50% and 30%, respectively, in the 1980s. Our computed value of Y rises to 72% for Taiwan but falls even further to 67% for People’s Republic of China in the 2000/2012. According to our earlier definitions, Taiwan is well into the developed stage while People’s Republic of China remains at a very large stage of development. The large and growing difference in Y between the two Chinas mirrors closed growing difference in their overall development level.
4. The Union Viable and Sustainability of the Two Chinas Analysis According to the results in this paper for a viable and sustainable union between Taiwan and People’s Republic of China became impossible. The economic and technological gap development between Taiwan and People’s Republic of China is decreasing decade by decade, but in the case of the social and political gap development between Taiwan and People’s Republic of China is increasing. The gap development between Taiwan and People’s Republic of China in 1980s is equal to political development (20%), social development (8%), economic development (23%) and technological development (20%). The gap development between both Chinas in 1980s is not so large than 1990s and 2000/2012. The balance point between Taiwan and People’s Republic of China is large and difficult to catch by both regions. For Taiwan need to sacrifice from its political development -9%, social development -4%, economic development -12% and technological development -10%. In the case of People’s Republic of China to arrive to the balance point in the 1980s is equal to political development +11%, social development +4%, economic development +11% and technological development +10%. The gap development and balance point in 1980s can be hard to facilitate the union of both Chinas (see Table 6). In the 1990s the development gap continues increasing in the political development (32%) and social development (13%). However, the balance point is less distant for Taiwan compare People’s Republic of China. Taiwan needs to sacrifice more than People’s Republic of China to unify both regions. In the case of People’s Republic of China, it needs to work more hard to meet Taiwan in the balance point.
PANOECONOMICUS, 2014, 4, pp. 441-469
463
464
Mario Arturo Ruiz Estrada and Donghyun Park
Table 6 Union Viable and Sustainable Table in the 1980s Variables
TW
PRC
C
GD
BP
LC-TW
LC-PRC
Political
53%
33%
88%
20%
44%
-9%
+11%
Social
41%
33%
74%
8%
37%
-4%
+4%
Economic
58%
35%
93%
23%
46%
-12%
+11%
Technological
58%
38%
96%
20%
48%
-10%
+10%
Notes: TW = Taiwan; PRC = People’s Republic of China; CH = China; C (China) = TW + CH; GD = gap development between Taiwan and China; GD = TW – CH; BP = the balance point (the point that both regions need to arrive for a possible viable and sustainable unification, e.g. Taiwan and China); BP = C/2; (LC – TW) = level of contribution of Taiwan in the process of unification with China; LC – TW = BP – TW; Negative result (–) = how much Taiwan need to sacrifice of its development to arrive at the balance point to generate a possible unification with China; Positive result (+) = how much Taiwan need to work to arrive at the balance point to generate a possible unification with China; (LC – PRC) = level of contribution of China in the process of unification with Taiwan; LC – PRC = BP – CH; Negative result (–) = how much China need to sacrifice of its development to arrive at the balance point to generate a possible unification with Taiwan; Positive result (+) = how much China need to work to arrive at the balance point to generate a possible unification with Taiwan. Source: See Appendix.
Finally, in the 2000/2012 the gap development between Taiwan and People’s Republic of China is extremely small than 1980s and 1990s. In the 2000/2012 the gap development shows an economic development (2%) and technological development (10%). The balance point in 2000/2012 between Taiwan and People’s Republic of China is relative small and possible to arrive both regions. In the case of Taiwan need to sacrifice more than People’s Republic of China in last past two decade (1980s and 1990s) in his political development -13%, social development -6% and technological development -2%. In the case of People’s Republic of China the balance point in the 2000/2012 is equal to political development +6%, social development +6%. The large gap in the political and social development and balance point in 2000/2012 for both regions generate possibilities for a non possible union in the short term. It is based on the far margin in the political and social development among both regions. We can say that the unification of both Chinas have a low cost for Taiwan, because Taiwan need to sacrifice a lot of its political and social development to unify a single China, but in the case of People’s Republic of China need to work more hard to catch the balance point and reduce the gap development between both regions. Therefore a suitable union between Taiwan and People’s Republic of China is more hardly for a possible successful unification.
5. Policy Recommendations Unification is inherently a complex and multi-dimensional phenomenon entailing the unification of the economies, political systems, social systems, and a wide range of other societal hardware and software of two fundamentally different countries. The German unification of 1990s clearly illustrated the multi-dimensional nature of unification. Like pre-unification Germany, China is currently divided into a democratic market economy - Taiwan - and a socialist centrally planned economy - People’s Republic of China. PANOECONOMICUS, 2014, 4, pp. 441-469
China’s Unification: Myth or Reality?
More specifically, we use the GDRI-Model to examine and compare the political, social, economic and technological development of the two Chinas in the 1980s, 1990s and 2000/2012. Our main finding is a growing gap between the two Chinas in political and social terms, but a declining gap in economic and technological terms. Since our analysis clearly reveals a political and social divergence between the two Chinas rather than a convergence, unification is likely to be a painful and disruptive process entailing large political and social costs. In terms of policy implications, our analysis suggests that the large and growing political and social gap between the two Chinas is indeed a serious obstacle to Chinese unification. On the other hand, the narrowing economic development and technical development gap gives cause for optimism. Taiwan policymakers would do well to appreciate the inherently multi-dimensional nature of unification. That is, unifying the two Chinas is not simply a matter of unifying two economies but unifying the political, social, and technological systems as well. Our analysis provides support for the Taiwan government’s sustainable mutual development coordination policy of diplomatically engaging People’s Republic of China and pursuing closer trade and other economic links. Such a policy will foster faster, stronger and more robust convergence between the two territories. The international community also has a stake in facilitating eventual Chinese unification through dialogue and assistance since convergence and stronger links between the two Chinas offer the best hopes for reducing military tensions in the Taiwan Straits. Military conflict between the two Chinas would pose a serious threat to the geopolitical stability of East Asia and beyond, all the more so since the US may be drawn into such a conflict due to its strong ties with Taiwan. Of course, economic convergence could indirectly promote convergence in the political, social, and technological spheres as well. After all, materially better off societies tend to have more democratic political systems, provide stronger social protection, and use more advanced technology.
PANOECONOMICUS, 2014, 4, pp. 441-469
465
466
Mario Arturo Ruiz Estrada and Donghyun Park
References Adams, Gwyn, Lewis Alexander, and Joseph Gagnon. 1993. “German Unification and the European Monetary System: A Quantitative Analysis.” Journal of Policy Modeling, 15(4): 353-392. Attia, Nicole, and Valérie Bérenger. 2009. “European Integration and Social Convergence: A Qualitative Appraisal.” Panoeconomicus, 56(1): 3-19. Benigno, Pierpaolo. 2004. “Optimal Monetary Policy in a Currency Area.” Journal of International Economics, 63(2): 293-320. Braun, Mirian B. S., Rubiane D. Cardoso, and André R. Bechlin. 2011. “The Integration Process of the MERCOSUR in the Year of 2007 for the Global Dimension of Regional Integration Model (GDRI-Model).” http://wwwsre.wu.ac.at/ersa/ersaconfs/ersa10/ERSA2010finalpaper1042.pdf. Brenton, Paul, Henry G. Scott, and Peter J. N. Sinclair. 1997. International Trade: A European Text. Oxford: Oxford University Press. Dalimov, Ravshanbek T. 2009. “Oscillation Theory of International Economic Integration.” African Journal of Marketing Management, 1(2): 50-61. De Bonis, Valeria. 1996. “The Impact of German Unification on the European Economy: A Strategic Analysis of Fiscal Policy.” Journal of Policy Modeling, 18(3): 335-341. De Lombaerde, Philippe, Giulia Pietrangeli, and Chatrini Weeratunge. 2008. “Systems of Indicators for Monitoring Regional Integration Processes: Where Do We Stand?” Integrated Assessment Journal, 8(2): 39-67. Devlin, Robert, and Ricardo Ffrench-Davis. 1998. “Towards an Evaluation of Regional Integration in Latin America in the 1990s.” Institute for the Integration of Latin America and Caribbean Working Paper 2. Erjavec, Emil, and Guna Salputra. 2012. “European Integration and Reform Process for Agriculture of Acceding Transition Countries - The Challenge for Western Balkans.” Agriculture and Forestry, 57(1): 7-22. Gundlach, Erich. 2003. “Growth Effects of EU Membership: The Case of East Germany.” Empirica, 30(3): 237-270. He, Ge. 2013. “Equilibrium-Oriented Housing Supply: A Case Study of Chengdu City, China.” Panoeconomicus, 60(4): 557-568. Huang, Guobo, and Clement Yuk-Pang Wong. 1996. “Unification of China’s Foreign Exchange Rates.” Contemporary Economic Policy, 14(4): 42-57. Kafouros, Wassily. 2009. “Economic Planning: Time to Reconsider?” Panoeconomicus, 56(4): 527-534. Keng, Shu, and Gunter Schubert. 2010. “Agents of Taiwan-China Unification? The Political Roles of Taiwanese Business People in the Process of Cross-Strait Integration.” Asian Survey, 50(2): 287-310. Kenny, Paul. 2003. “The Theory of Optimum Currency Areas.” Student Economic Review, 17: 137-149. Kim, Young-Han. 2005. “The Optimal Path of Regional Economic Integration between Asymmetric Countries in the North East Asia.” Journal of Policy Modeling, 27(6): 673-687. Kreinin, Mordechai E., and Michael G. Plummer. 2003. Economic Integration and Development: Has Regionalism Delivered for Developing Countries? Northampton: Edward Elgar Publishing.
PANOECONOMICUS, 2014, 4, pp. 441-469
China’s Unification: Myth or Reality?
Krugman, Paul R., and Maurice Obstfeld. 1988. International Economics: Theory and Policy. Glenview: Scott Foresman. Lipsey, Richard G., and Kelvin Lancaster. 1997. “The General Theory of Second Best.” Review of Economic Studies, 24(1): 11-32. Mattli, Walter. 1999. The Logic of Regional Integration: Europe and Beyond. Cambridge: Cambridge University Press. Mundell, Robert A. 1961. “A Theory of Optimum Currency Areas.” American Economic Review, 51(4): 657-665. Noland, Marcus, Sherman Robinson, and Tao Wang. 2000. “Modeling Korean Unification.” Journal of Comparative Economics, 28(2): 400-421. Panagariya, Arvind, and Krishna Pravin. 2002. “On Necessarily Welfare-Enhancing Free Trade Areas.” Journal of International Economics, 57(2): 353-367. Ruiz Estrada, Mario Arturo. 2004. “Global Dimension of Regional Integration (GDRI) Model. Applied on EU, NAFTA, ASEAN and MERCOSUR.” Munich Personal RePEc Archive Paper 40546. Ruiz Estrada, Mario Arturo, and Donghyun Park. 2008. “Korean Unification: How Painful and How Costly?” Journal of Policy Modeling, 30(1): 87-100. Ruiz Estrada, Mario Arturo. 2013. “The Global Dimension of the Regional Integration Model (GDRI-Model).” Modern Economy, 4(5): 346-369. Salvatore, Dominick. 2007. International Economics. 9th ed. New Jersey: John Wiley & Sons, Inc. Schnabel, Claus, and Joachim Wagner. 2005. “Determinants of Trade Union Membership in West Germany: Evidence from Micro Data, 1980-2000.” Socio-Economic Review, 3(1): 1-24. Sek, Siok Kun, and Wai Mun Har. 2012. “Does Inflation Targeting Work in Emerging EastAsian Economies?” Panoeconomicus, 59(5): 599-608. Sperlich, Yvonne, and Stefan Sperlich. 2012. “Practical Tools for Monitoring Convergence, Integration and Development: Compare and Apply.” Journal of Comparative Policy Analysis: Research and Practice, 14(1): 72-103. Su, Ya-Chen. 2007. “Ideological Representations of Taiwan’s History: An Analysis of Elementary Social Studies Textbooks, 1978-1995.” Curriculum Inquiry, 37(3): 205-237. Vukotić,Veselin. 2008. “Economic Freedom and New Economic Paradigm.” Panoeconomicus, 55(1):115-128. Winters, Alan L. 1987. “Negotiating the Abolition of Non-Tariff Barriers.” Oxford Economic Papers, 39(3): 465-480. Zhou, Yikai. 2012. “Unification: Why Germany, Not Korea?” Shanghai Jiao Tong University Outstanding Academic Papers by Students 056.
PANOECONOMICUS, 2014, 4, pp. 441-469
467
468
Mario Arturo Ruiz Estrada and Donghyun Park
Appendix Sources for Tables 5 and 6 Asian Development Bank - ADB. 2012. “ADB Annual Reports.” http://www.adb.org/documents/series/adb-annual-reports (accessed March 15, 2012). Central Bank of the Republic of China (Taiwan). 2012. “Annual Reports.” http://www.cbc.gov.tw/lp.asp?CtNode=776&CtUnit=436&BaseDSD=7&mp=2 (accessed May 15, 2012). Executive Yuan of the Republic of China (Taiwan). 2012. “The Republic of China Yearbook 2013.” http://www.ey.gov.tw/en/cp.aspx?n=622463CE8C210423 (accessed March 12, 2012). Greenpeace International. 2012. “Annual Reports.” http://www.greenpeace.org/international/en/about/how-is-greenpeacestructured/reports/#a0 (accessed July 18, 2012). Human Rights Watch. 2012. “Publications - Reports.” http://www.hrw.org/publications/reports (accessed March 18, 2012). International Court of Justice. 2012. “Publications.” http://www.icjcij.org/publications/index.php?p1=8 (accessed July 27, 2012). International Federation of Reproduction Rights Organisation - IFRRO. 2012. “Annual Reports.” http://www.ifrro.org/content/annual-reports (accessed May 15, 2012). International Monetary Fund - IMF. 2012. “Annual Report of the Executive Board.” http://www.imf.org/external/pubs/ft/ar/index.htm (accessed May 1, 2012). Library of Congress. 2012. “Annual Reports.” http://www.loc.gov/search/?q=annual+report&in=original-format%3Abook (accessed December 19, 2012). Ministry of Commerce of the People’s Republic of China. 2012. “Statistics.” http://english.mofcom.gov.cn/article/statistic/ (accessed May 25, 2012). Ministry of Economic Affairs of the Republic of China (Taiwan). 2012. “Statistics of Economic.” http://www.moea.gov.tw/Mns/english/content/ContentLink2.aspx?menu_id=213 (accessed May 1, 2012). Ministry of Education of the People’s Republic of China. 2012. “Educational Statistics.” http://www.moe.edu.cn/publicfiles/business/htmlfiles/moe/s7566/index.html (accessed March 30, 2012). Ministry of Education of the Republic of China (Taiwan). 2012. “Statistical Summaries.” http://english.moe.gov.tw/lp.asp?CtNode=11429&CtUnit=1345&BaseDSD=16&mp= 1 (accessed March 26, 2012). Ministry of Finance of the People’s Republic of China. 2012. http://www.mof.gov.cn/zhengwuxinxi/caizhengshuju/ (accessed May 16, 2012). Ministry of Foreign Affairs of the People’s Republic of China. 2012. http://www.fmprc.gov.cn/mfa_eng/ziliao_665539/ (accessed March 27, 2012). Ministry of Foreign Affairs of the Republic of China (Taiwan). 2012. http://www.mofa.gov.tw/webapp/content.asp?cuItem=39706&mp=6 (accessed May 25, 2012).
PANOECONOMICUS, 2014, 4, pp. 441-469
China’s Unification: Myth or Reality?
Ministry of Justice of the People’s Republic of China. 2012. http://www.moj.gov.cn/node_7341.htm (accessed May 1, 2012). Ministry of Land and Resources of the People’s Republic of China. 2012. http://www.mlr.gov.cn/bsfw/xzfw/ (accessed July 25, 2012). Ministry of Science and Technology of the People’s Republic of China. 2012. “S&T Statistics.” http://www.most.gov.cn/eng/statistics/2007/index.htm (accessed June 24, 2012). National Audit Office of the People’s Republic of China. 2012. “Publications.” http://www.cnao.gov.cn/main/Article_ArtID_14.htm (accessed June 25, 2012). National Development and Reform Commission of the People’s Republic of China. 2012. “News Release.” http://en.ndrc.gov.cn/newsrelease/ (accessed July 23, 2012). National Health and Family Planning Commission of the People’s Republic of China. 2012. http://www.nhfpc.gov.cn/zwgkzt/index.shtml (accessed June 11, 2012). National Statistics of the Republic of China (Taiwan). 2012. “Statistics from Statistical Bureau.” http://eng.stat.gov.tw/mp.asp?mp=5 (accessed March 30, 2012). Organization of the Petroleum Exporting Countries - OPEC. 2012. “Annual Statistical Bulletin.” http://www.opec.org/opec_web/en/publications/202.htm (accessed November 15, 2012). People’s Bank of China. 2012. “Statistics.” http://www.pbc.gov.cn/publish/english/958/index.html (accessed July 15, 2012). United Nations Development Programme - UNDP. 2012. “Human Development Reports.” http://hdr.undp.org/reports/General/2004/ (accessed November 29, 2012). United Nations Security Council. 2012. “Annual Reports.” http://www.un.org/en/sc/documents/reports/ (accessed May 4, 2012). World Bank. 2012. “Annual Reports.” http://web.worldbank.org/WBSITE/EXTERNAL/EXTABOUTUS/EXTANNREP/0,, menuPK:1397243~pagePK:64168427~piPK:64168435~theSitePK:1397226,00.html (accessed July 18, 2012). World Health Organization. 2012. “Annual Reports.” http://www.who.int/violence_injury_prevention/publications/about_vip/en/ (accessed March 15, 2012).
PANOECONOMICUS, 2014, 4, pp. 441-469
469