Chip-Package-Interaction Modeling of Ultra Low-k/Copper Back End of Line X. H. Liu, T. M. Shaw., M. W. Lane, E. G. Liniger, B. W. Herbst, D. L. Questad IBM TJ Watson Research Center, 1101 Kitchawan Rd, Yorktown Heights, NY 10598 Tel: 914-945-2313 Fax: 914-945-2141 email:
[email protected] Abstract
Mechanics of Delamination
Ultra low-k (ULK, k=2.4) dielectric has weaker mechanical properties than first generation low-k films (k=3.0). The introduction of ULK into advanced back end of lines (BEOL) presents a significant challenge due to chip package interaction (CPI) where the packaged die is cycled over a temperature range and the resulting stress can cause ULK BEOL delamination. To avoid CPI failure detailed modeling from the package down to the BEOL must be coupled with quantitative material property measurement. In this paper multi-level finite element models have been used to investigate the parameters which drive CPI failure. It is found that the defect size in the BEOL and the package geometry are key drivers for delamination. Finally, this paper presents a detailed example of the utility of modeling to optimize dicing to reduce defect size, and provide targets for crackstop toughness, which has resulted in a successful reliability qualification of the porous SiCOH (k=2.4) for 45 nm BEOL technology with an organic flip-chip package.
The theory of delamination is well established in the fracture mechanics literature [3]. The driving force for delamination is the energy release rate G given by G=
1− β
2
2
(1) E where the complex stress intensity factor K = K 1 + iK 2 can be related to the crack opening δ = δ y + iδ x by *
K ,
1 4 Kr iε 2r . (2) π (1 + 2iε ) cosh(πε ) E * Here ε and β are material constants, i is the complex number. r is the distance to the crack tip, and E * is an average modulus. In our model the stress intensity factor is computed from equation (2), and the energy release rate is then obtained from equation (1). The ratio of shearing and normal loading is characterized by the phase angle ψ
δ =
K2 + ε ln h , K1 where h is a length for which the cap thickness is used.
ψ = tan −1
Introduction The growth of the microelectronics industry is driven by the insatiable and incessant demand for faster chips and lower power with no sacrifice of reliability. Current CMOS technology has crossed the point where the delay due to BEOL architecture surpasses that from the device. The device leakage has caused significant power consumption at high performance. To alleviate these problems the industry has been pursuing lower and lower dielectric constant insulator for chip wiring. PECVD SiCOH low-k (k=3.0) was introduced in production to replace SiO2 [1] and recently IBM and its partners have qualified an advanced PECVD ultra low-k (ULK) porous SiCOH (k=2.4) [2].
(3)
Table I Thermo-mechanical properties of Low-k and ULK Modulus (GPa)
Stress (MPa)
CTE (ppm/C)
SiCOH
16
19
11
Cohesive Strength (J/m2) 6.0
Porous SiCOH
4.6
43
14
3.5
Material
At the gain of lower dielectric constant, thermomechanical properties are compromised as shown in Table I. This can result in adhesive failure which often manifests in the industry standard thermal cycle testing. The worst case often occurs at package level with organic laminate because of the thermal mismatch between the package and the die. In this paper we presented our methodology to address the BEOL delamination caused by the chip package interaction (CPI).
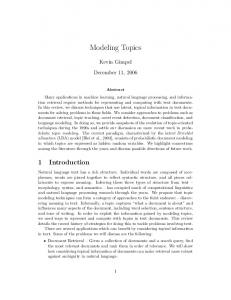
Fig. 1: Multi-level model for chip-packaging-interaction simulation.
Multi-level Modeling Figure 1 shows the multi-level model for an organic flip-chip package FCPBGA and BEOL stack. The global model includes the laminate, underfill, die, lid, thermal interface material, and glue between the stiffener and the laminate. The organic laminate consists of a core layer with buildup layers on both sides. The buildup layers are elastically anisotropic and different mechanical properties
0.00
0.04
0.08
0.12
95 90
Low-k Low-k/ULK ULK
1.5
85 o
2.0
Phase Angle ( )
80 75
1.0 70
2.5
1.5
M1 M2 M3 M4 M5 M6 M7 M8
1.0
0.5
0.0 0.02
0.04
0.06
0.08
0.10
0.12
Normalized Delamination Length Fig 3: Energy release rate for delamination at various cap/ULK interface.
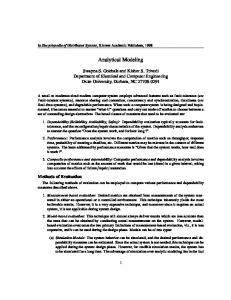
The phase angle also depends on the delamination length. At small length it is about 90o, but at larger length it decreases. By definition (3) this means the delamination, when it is small, is predominantly under shearing from the package and under combined shear and tension as its length increases. The shear stress at the crack tip drives the crack to the bottom lowest k BEOL metal level. Since the phase angle is greater than 43o, the four point bending test is an appropriate technique to measure crackstop and interfacial toughness for the worst scenario. At extremely small delamination length the phase angle is greater than 90o due to the crack closure. 4
65
0.5
2.0
0.00
A B C D E F G H I J K L M N
60 0.0 0.00
0.04
0.08
0.12
55 0.16
Normalized Delamination Length Fig 2: The driving force for delamination and phase angle as the length of delamination which lie at M3 cap and dielectric interface.
CPI Driving Force The multi-level models allow for studies of the effect on CPI failure from both package and BEOL. Figure 2 shows the energy release rate and the phase angle can be calculated from the finite element analysis by varying the delamination length. The curves are obtained for the same package and the same FBEOL (final oxide passivation) but different BEOL dielectric for the first six metal levels. It is noted that the energy release rate is sensitive to the delamination length. In particular, it increases faster at small length. Although lower modulus and larger stress increases the driving force most contribution to the energy release rate comes from the package. In the case of the low-k/ULK
Normalized Energy Release Rate
Normalized Energy Release Rate
2.5
0.16 100
combination when low-k is used for the first three metal levels, the energy release rate is close to ULK.
Normalized Energy Release Rate
are incorporated for the portion under the die than for the portion that lies outside the image of the die. The second level of model focuses on the area of die edge and underfill fillet with lead-free C4 included. So far the delamination in BEOL is not included since it is small and simulations show it makes no difference in the calculation of the energy release rate. The third level zooms into the die corner, which includes a delamination at the interface of interest and the BEOL film stack of ILD and caps. A fine mesh is used for the stack and the two tips of the interfacial crack. Since the left tip propagates into the chip which is of utmost concern for CPI failure, it is refined in the last level to calculate the energy release rate. To reveal the BEOL stack the last submodel does not show the much refined mesh. In varying the delamination length the last two submodels are re-created and calculated for the energy release rate. At the last sub-model one may include copper features in the BEOL stack. But the studies on delamination at wafer level process indicate that the copper pattern has little effect on the energy release rate, at least an order of magnitude lower than that from a package [4]. Therefore it is neglected in our simulations.
3
2
1
0 0.00
0.05
0.10
0.15
0.20
0.25
Normalized Delamination Length Fig 4: Effect of undefill material on energy release rate.
Figure 3 shows the effect on the energy release rate with a delamination located at various metal cap/dielectric interfaces. The first six levels have ULK ILD and the difference in the energy release rate is small. However, at
M7 and M8 levels which use FTEOS, the energy release is much lower. This is due to the higher modulus and lower CTE of FTEOS as compared to ULK.
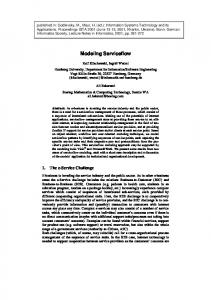
failure. Figure 6(a) shows an early chip with chopped-off crackstop (CS) at the corner where dicing introduces a larger delamination there. A simple redesign to reduce the defect size is to square off the crackstop at the corner. As shown in Figure 6(b) such a redesign and optimized dicing protects the corner from damage.
(a)
3.0
(b) Fig 5: The magnified deformation and displacement contour obtained under the identity conditions except that (a) lidless package (b) with copper alloy lid.
In addition to the BEOL our model allows us to study the package effect on CPI failure. Figure 4 shows how the energy release rate changes when different underfill is used in packaging. Due to the difference in modulus, CTE and Tg, the energy release rate can vary significantly to affect CPI reliability testing. As another example of package effect, Figure 5 shows that the package without the lid has a larger deflection during thermal cycle. With the global model in Figure 1 replaced by the lidless package, it is found that the energy release rate is lower than the lidded package. The effect of the laminate substrate can also be investigated using the model. A difference of 1.5x in energy release rate is found for different laminates. This is because the thermal mismatch between the organic package and the die provides the major driving force for CPI failure.
(a)
(b)
Fig 6: Diced chip corner before and after crackstop redesign.
Applications The multi-level modeling has quantified the driving force for CPI delamination, which primarily comes from packaging. Obviously by modeling the effect of packaging on the energy release rate, it can be used to guide ULK packaging. For example, Figure 4 can be used to select an underfill that has low enough driving force for CPI meanwhile avoiding other packaging reliability issues. Instead of imposing severe constrains on package types, we chose to solve the CPI from the chip side based on the modeling. Since the energy release rate increase with the delamination length, reducing the defect size helps CPI reliability. The worst location is at the chip corner where the stress concentration and the dicing flaw accelerate the CPI
Normalized Energy Release Rate
UF1 2.5
Measured CS toughness 2.0
1.5
UF2 1.0
Interface Toughness 0.5
0.0 0.00
0.05
0.10
0.15
0.20
0.25
Normalized Delamination Length Fig 7: Comparison of driving force and toughness
As an example of application, Figure 7 shows how the energy release rate calculated for a given package can be used together with the crackstop toughness measurement [5] to predict CPI reliability. Without a crackstop the energy release rate is larger than the interface toughness at a small defect size. It predicts catastrophic CPI failure and is confirmed by testing for only a few cycles. Putting a crackstop in BEOL increases the toughness by about 2x. Figure 7 indicates that underfill UF2 should pass CPI reliability while UF1 cannot. This agrees with the test results. A redesigned CS [5] has a further enhancement to toughness of 3x that shown in Figure 7 and enables either underfill in Figure 7 to be used for packaging [2]. References (1) D. C. Edelstein et al. “Comprehensive Reliability Evaluation of a 90 nm CMOS Technology with Cu/PECVD Low-K BEOL”, International Reliability Physics Symposium, Phoenix, AZ, 2004, pp. 316-319 (2) S. Sankaran et al. ”A 45 nm CMOS node Cu/Low-k/Ultra Low-k PECVD SiCOH (k=2.4) BEOL Technology”, IEDM Dec. 11-13, 2006 (3) J. W. Hutchinson, Z. Suo, “Mixed mode cracking in layered materials”, Advances in Applied Mechanics, Vol. 29, 1992, pp. 63-191. (4) X. H. Liu, M. W. Lane, T. M. Shaw, E. Simonyi, “Delamination in Patterned Films”, to appear in International Journal of Solids and Structures, 2007 (5) T. M. Shaw, E. Liniger, G. Bonilla, J.P. Doyle, B. Herbst, X. H. Liu and M. W. Lane, “Experimental Determination of the Toughness of Crack Stop Structures”, IITC 2007