www.nature.com/scientificreports
OPEN
received: 15 April 2015 accepted: 21 July 2015 Published: 02 September 2015
Chondrocytes-Specific Expression of Osteoprotegerin Modulates Osteoclast Formation in Metaphyseal Bone Baoli Wang1,2, Hongting Jin2,†, Bing Shu2,‡, Ranim R. Mira3 & Di Chen2,3 Bone marrow stromal cells/osteoblasts were originally thought to be the major player in regulating osteoclast differentiation through expressing RANKL/OPG cytokines. Recent studies have established that chondrocytes also express RANKL/OPG and support osteoclast formation. Till now, the in vivo function of chondrocyte-produced OPG in osteoclast formation and postnatal bone growth has not been directly investigated. In this study, chondrocyte-specific Opg transgenic mice were generated by using type II collagen promoter. The Col2-Opg transgenic mice showed delayed formation of secondary ossification center and localized increase of bone mass in proximal metaphysis of tibiae. TRAP staining showed that osteoclast numbers were reduced in both secondary ossification center and proximal metaphysis. This finding was further confirmed by in vitro chondrocyte/spleen cell coculture assay. In contrast, the mineral apposition rates were not changed in Col2-Opg transgenic mice. TUNEL staining revealed more apoptotic hypertrophic chondrocytes in the growth plate of Col2-Opg mice. Flow cytometry analysis showed fewer RANK-expressing cells in the marrow of Col2a1-Opg mice, suggesting the role of OPG in blocking the differentiation of early mesenchymal progenitors into RANK-expressing pre-osteoclasts. Our results demonstrated that OPG expression in chondrocyte increases bone mass in the proximal metaphysis of tibiae through negative regulation of osteoclast formation.
The growth plate chondrocytes are a major player in the process of endochondral ossification that contributes to the longitudinal growth of the skeleton. This process is initiated when progenitor cells in the resting zone are stimulated to proliferate and then proceed through stages of maturation and hypertrophy1. Hypertrophic chondrocytes produce a matrix that undergoes calcification, forming a calcified cartilaginous template for new bone formation. Hypertrophic chondrocytes also undergo apoptosis at the lower region of the hypertrophic zone as new blood vessels begin to invade the calcified cartilage and bring in osteoblast precursors, forming trabecular bone2,3. Although the principles and overall mechanisms of endochondral bone formation are well established, many details remain to be defined. For example, the mechanisms how chondrocytes signal to adjacent osteoclasts (or chondroclasts) to trigger bone resorption remains poorly understood. It has been established that osteoclast formation and activation require two molecules: macrophage colony-stimulating factor (M-CSF) and RANKL. Both of them are necessary to activate gene 1
Key Lab of Hormone and Development (Ministry of Health), Metabolic Diseases Hospital and Tianjin Institute of Endocrinology, Tianjin Medical University, Tianjin 300070, China. 2Department of Orthopaedics, Center for Musculoskeletal Research, University of Rochester School of Medicine, Rochester, NY 14642, USA. 3Department of Biochemistry, Rush University Medical Center, Chicago, IL 60612, USA. †Present address: Institute of Orthopaedics and Traumatology, Zhejiang Chinese Medical University, Hangzhou, China. ‡Present address: Spine Research Institute, Longhua Hospital, Shanghai University of Traditional Chinese Medicine, Shanghai, China Correspondence and requests for materials should be addressed to D.C. (email:
[email protected]) Scientific Reports | 5:13667 | DOI: 10.1038/srep13667
1
www.nature.com/scientificreports/ transcription to allow osteoclast differentiation4. As a member of TNF super family, RANKL is originally believed to be produced by osteoblast lineage cells and activated T-cells and functions differently from M-CSF. While M-CSF increases the pool of osteoclast precursors, RANKL binds to its receptor RANK expressed on osteoclast precursors and mature osteoclasts, signaling to downstream molecules leading to enhanced osteoclast differentiation and activation and reduced apoptosis4,5. RANK, the receptor of RANKL, is a member of the TNF receptor superfamily6. In vivo data showed that deletion of either Rank or Rankl in mice resulted in the same phenotypes, including the profound defects in osteoclast formation, lymph-node formation, and B-cell development4,7–10. Osteoprotegerin serves as the decoy receptor of RANKL. It is an atypical member of the TNF receptor superfamily as it is a secreted protein without transmembrane domain. It contains four homologous domains and competes with RANK for binding the same target RANKL, but does not transmit the signal to the osteoclast lineage cells, thus exerting an inhibitory effect on osteoclast differentiation and activation11–14. In support of this, Opg knockout mice displayed severe osteoporosis, whereas Opg overexpressing mice showed osteopetrosis11–14. The originally identified cells that express OPG include osteoblasts, endothelial cells, vascular smooth muscle, and lymphoid cells11–14. Recently published immunohistochemistry (IHC) and in situ hybridization data have shown that RANKL and OPG are also expressed by hypertrophic chondrocytes in murine and rat growth plates15,16. Further studies demonstrate a novel role for chondrocytes in supporting osteoclast formation by expressing RANKL, an effect regulated by 1, 25-(OH)2 vitamin D3 and BMP-215,17. However, the role of chondrocyte-produced OPG in regulation of osteoclast formation was not implicated in the previous studies. We have recently reported that inactivation of canonical Wnt/β -catenin signaling in chondrocytes decreases proximal metaphyseal bone mass through enhancing osteoclast formation, which is mediated by the down-regulation of OPG and up-regulation of RANKL18. To investigate the role of chondrocyte-produced OPG in osteoclast formation and postnatal bone growth, we generated chondrocyte-specific Opg transgenic mice using a 1.0-kb type II collagen promoter (Col2a1). Our results demonstrated that chondrocyte-produced OPG plays a significant role in regulation of osteoclast formation during bone growth and bone remodeling.
Results
Opg transgene was expressed in chondrocytes in Col2-Opg transgenic mice. In this study, we generated Col2-Opg transgenic mice in which expression of the Opg-Flag transgene was targeted to chondrocytes using the 1.0 kb type II collagen promoter (Col2a1) (Fig. 1A)19–21. Two independent lines of Col2-Opg transgenic mice were established and both of them displayed similar phenotypes. Col2-Opg transgenic mice are viable, fertile with normal body size and have no any gross, physical, or behavioral abnormalities. Expression of the OPG-Flag protein was detected by Western blotting using an anti-Flag antibody in primary sternal chondrocytes isolated from Col2-Opg transgenic mice but not in those from WT mice (Fig. 1B). To determine the specificity of the Opg-Flag transgene expression, total RNA was extracted from multiple tissues and expression of Opg-Flag mRNA was examined by RT-PCR using transgene specific primers (Opg Fw and Flag-Rev). Strong expression of Opg-Flag was detected in femur epiphysis that spans from the articular surface to the lower border of the growth plate. Weaker expression of the transgene was detected in other bone tissues involving cartilages like calvaria and rib and in the brain, but was not detected in other tissues, including heart, kidney, and muscle (Fig. 1C). Interestingly, the transgene was not detected in femur metaphysis and diaphysis that were free of cartilages. This is consistent with our previous findings in Col2CreERT2 transgenic mice18,22. We also cultured the primary sternal chondrocytes, calvarial pre-osteoblasts and bone marrow stromal cells (BMSCs) and compared the mRNA and protein expression of Opg in the Col2-Opg transgenic mice to that in the WT control littermates (Fig. 1D–G). The results showed that the Opg mRNA expression in chondrocytes was increased by 232-fold in the Col2-Opg transgenic mice (Fig. 1D). ELISA measurement of chondrocyte conditioned medium also revealed a significant increase in the OPG protein levels in Col2-Opg mice (Fig. 1G). In contrast, the mRNA expression of Opg did not increase in BMSCs and only increased by 40% in calvarial pre-osteoblasts (Fig. 1E,F) in Col2-Opg mice. No significant change of OPG protein level was observed in either primary calvarial pre-osteoblasts or BMSCs (Fig. 1G). Moreover, the serum OPG was increased by 73% in the 5-week old transgenic mice18. Expression of Opg transgene in chondrocytes increased trabecular bone mass. We then
examined changes in bone mass of the transgenic mice by X-ray radiographic, histological and μ CT analyses. X-ray radiographic results showed that the radiodensity in the proximal metaphyseal regions of tibiae was higher in the 5-week-old Col2-Opg mice than in their WT littermates. In contrast, the radiodensity in the mid-shaft of the bones was not changed (Fig. 2A). We then examined if there are defects in bone or cartilage development in the embryonic stage. Alcian blue/Alizarin red staining of E18.5 skeleton revealed no significant differences between WT and Col2a1-Opg embryos (Fig. 2B). Histological sections were stained with Alcian blue/Hematoxylin & Orange G. The Col2-Opg mice did not show significant changes in bone mass at E18.5 embryos (Fig. 2C) and P7 mice (Fig. 2D). The Col2-Opg mice had normal columnar arrangement of the growth plate chondrocytes. However, the Col2-Opg mice showed delay in the formation of the secondary ossification center. At P14 in WT mice,
Scientific Reports | 5:13667 | DOI: 10.1038/srep13667
2
www.nature.com/scientificreports/
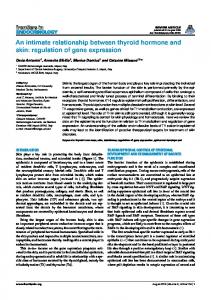
Figure 1. Opg-Flag transgene was expressed in chondrocytes in Col2-Opg mice. (A) The diagram shows the Col2-Opg transgene construct. (B) Expression of OPG-Flag protein was detected in chondrocytes derived from Col2-Opg transgenic mice by Western blot analysis using the anti-Flag antibody. (C) Expression of Opg-Flag mRNA was examined in multiple tissues by RT-PCR using the transgene specific primers. (D–G) Expression levels of Opg mRNA and protein in primary sternal chondrocytes, calvarial pre-osteoblasts and bone marrow stromal cells were examined. Data are presented as means ± SD (n = 3–4 per group).
mineralized cartilage in secondary ossification centers has been removed and replaced by trabecular bone; in contrast, mineralized regions have only partly been replaced by trabecular bone in Col2-Opg mice. The trabecular bone volume in the metaphyseal region was not significantly altered (Fig. 2E). At P28 and P35, the trabecular bone volumes in the proximal metaphyseal region were significantly increased in Col2-Opg mice (Fig. 2F,G). The transgenic mice maintained the typical columnar structure of growth plate chondrocytes, but the thickness of the growth plate, especially the hypertrophic zone, was 60% greater in the transgenic mice than in WT controls (Fig. 2H). Consistent with this, μ CT imaging revealed the bone mass increase in the proximal metaphysis beneath the growth plate in 4-week-old Col2-Opg mice (Fig. 3A). The trabecular bone volume (% BV/ TV) was 41% greater (Fig. 3B) and the bone mineral density was 29% greater (Fig. 3C) in Col2-Opg mice. The trabecular number (Tb. N., 1/mm) was 20% higher (Fig. 3D), and the connectivity density (Conn. D.) was 60% higher (Fig. 3E), while the trabecular separation (Tb.Sp.) was 24% lower (Fig. 3F) in Col2-Opg mice. The structural model index (SMI, a measure of the shape of trabeculae; 0 for plates and 3 for cylindrical rods) was significantly decreased by 21% in Col2-Opg mice (Fig. 3G).
Osteoclast formation was altered in Col2-Opg mice. We performed the TRAP staining in tibiae
from E18.5 embryos and P14 and P28 postnatal mice. The numbers of TRAP-positive osteoclasts and osteoclast surfaces were significantly decreased in Col2-Opg mice at all these time points (Fig. 4A–F). Of note, in 14-day-old Col2-Opg mice, the osteoclast numbers and osteoclast surfaces were lower not only in the primary metaphyseal region (Fig. 4B,E,F), but also in the secondary ossification center region, where the osteoclast numbers and osteoclast surfaces were reduced by 79% and 75%, respectively, compared
Scientific Reports | 5:13667 | DOI: 10.1038/srep13667
3
www.nature.com/scientificreports/
Figure 2. X-ray radiographic and histological analyses of Col2-Opg mice. (A) The radiodensity of long bones of 5-week-old Col2-Opg mice was examined by X-ray (red arrows: primary spongiosa area). (B) E18.5 embryos were stained with Alcian blue/Alizarin red. (C–G) Histological staining of tibial sections was performed in E18.5, P7, P14, P28 and P35 WT and Col2-Opg mice. The formation of secondary ossification center was delayed (E) and the hypertrophic zone was enlarged (F and G) in Col2-Opg mice. (H) The thickness of the growth plate was measured in P35 mice (red bars: length of hypertrophic zone).
to WT controls (Fig. 4C,E,F). This may explain why the formation of the secondary ossification center was delayed in Col2-Opg transgenic mice. We also examined changes in mineral apposition rate (MAR), the indicator of osteoblast activity, and found that the MAR was not significantly changed in Col2-Opg mice (Fig. 4G,H).
In vitro osteoclast formation was reduced in Col2-Opg mice. To determine the role of chondrocyte-produced OPG in osteoclast formation, we performed chondrocyte-spleen cell co-culture experiments in the presence of 10–8 M 1,25-(OH)2 vitamin D3, TRAP-positive osteoclast formation was completely abolished when spleen cells were cultured with chondrocytes derived from Col2-Opg mice (Fig. 5A). To further identify if the overexpression of the Opg transgene alters the osteoclast formation from bone marrow cells, we cultured bone marrow cells in the presence of M-CSF and RANKL. Osteoclast formation was significantly reduced when bone marrow cells derived from Col2-Opg transgenic mice were cultured for osteoclast formation assay (Fig. 5B,C), suggesting that bone marrow cells were affected in chondrocyte-specific Col2-Opg mice. The Opg overexpression might have changed bone marrow cell populations. To examine this, we performed flow cytometric analysis using monoclonal antibodies against RANK and CD11b. The results showed that the RANK positive cells were reduced in Col2-Opg mice compared to WT mice; while the CD11b positive cells did not change significantly in Col2-Opg mice (Fig. 5D). These results suggest that RANK-expressing pre-osteocalsts may also be involved in OPG-mediated osteoclast inhibition. Changes in growth plate chondrocyte function in Col2-Opg mice. To evaluate chondrocyte apoptosis, we performed TUNEL staining in 4-week-old WT and Col2-Opg mice and counted percentage of green fluorescent cells by normalizing to DAPI-positive cells. We found that the number of apoptotic hypertrophic chondrocytes was significantly increased in Col2-Opg mice (Fig. 6A). This result suggests that the expanded width of the hypertrophic zone could be owing to fewer chondrocytes being resorbed by osteoclasts after entering the apoptosis phase. To further clarify if OPG affects chondrocyte development, mRNA expression of several chondrocyte marker genes were examined by real-time PCR assay. Expression levels of collagen type II (Col2a1), collagen type X (Col10a1), matrix metalloproteinase 13 (Mmp13), osteocalcin (OC), and alkaline phosphatase Scientific Reports | 5:13667 | DOI: 10.1038/srep13667
4
www.nature.com/scientificreports/
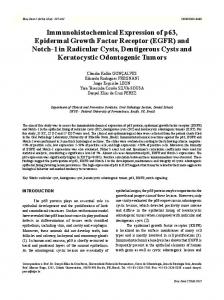
Figure 3. μCT analysis of the bone mass of Col2-Opg mice. (A) μ CT analysis of bone mass of the proximal metaphysis of tibiae was examined in 4-week-old Col2-Opg mice and WT littermates. (B–G) Histomorphometric parameters, including bone volume (BV/TV, %), bone mineral density (BMD), trabecular number (Tb.N.), connectivity density (Conn. D.), trabecular separation (Tb.Sp.), and structure model index (SMI), were analyzed in Col2-Opg mice and WT littermates. Data are represented as means ± SD (n = 6 per group).
(Alp) were not significantly altered in Col2-Opg chondrocytes (Fig. 6B). These findings demonstrated that the OPG does not play a significant role in regulation of chondrocyte maturation.
Slight changes in osteoblast and adipocyte formation in Col2-Opg mice. We then examined
osteoblast differentiation in BMSCs of Col2-Opg mice. ALP and Alizarin red staining showed similar osteoblast differentiation tendency in Col2-Opg mice compared to WT controls (Fig. 7A,B). Interestingly, results of real-time PCR assay revealed that the mRNA expression of Runx2 was not changed, while expression levels of Col1a1, Alp, OC and Bsp were slightly reduced (p