molecules Article
Chromatographic and Spectroscopic Identification and Recognition of Natural Dyes, Uncommon Dyestuff Components, and Mordants: Case Study of a 16th Century Carpet with Chintamani Motifs 2 , Agata Kot-Wasik 1 , Jakub Karczewski 3 and ´ Olga Otłowska 1 , Marek Slebioda 1, * ´ Magdalena Sliwka-Kaszy nska ´ 1 2 3
*
Faculty of Chemistry, Gdansk University of Technology, 80-233 Gdansk, Poland;
[email protected] (O.O.);
[email protected] (A.K.-W.) Perlan Technologies, Sp. z.o.o., 02-785 Warszawa, Poland;
[email protected] Faculty of Applied Physics and Mathematics, Gdansk University of Technology, 80-233 Gdansk, Poland;
[email protected] Correspondence:
[email protected]; Fax: +48-58-347-2694
Received: 15 November 2017; Accepted: 1 February 2018; Published: 6 February 2018
Abstract: A multi-tool analytical practice was used for the characterisation of a 16th century carpet manufactured in Cairo. A mild extraction method with hydrofluoric acid has been evaluated in order to isolate intact flavonoids and their glycosides, anthraquinones, tannins, and indigoids from fibre samples. High-performance liquid chromatography coupled to spectroscopic and mass spectrometric detectors was used for the identification of possible marker compounds with special attention paid to natural dyes present in the historical samples. Weld, young fustic, and soluble redwood dye were identified as the dye sources in yellow thread samples. Based on the developed method, it was possible to establish that red fibres were coloured with lac dye, whereas green fibre shades were obtained with indigo and weld. Tannin-containing plant material in combination with indigo and weld were used to obtain the brown hue of the thread. Hyphenation of high-performance liquid chromatography (HPLC) with quadrupole time-of-flight mass spectrometry (QTOF MS) and triple-quadrupole mass spectrometry (QqQ MS) enabled us to recognise four uncommon and thus-far unknown dye components that were also found in the historical samples. These compounds probably represent a unique fingerprint of dyed threads manufactured in a Turkish workshop. Scanning electron microscopy with energy-dispersive X-ray detector (SEM-EDS) and Fourier transform infrared spectroscopy (FT-IR) were used for the identification and characterisation of substrates and mordants present in the historical carpet. Carbon and oxygen were detected in large quantities as a part of the wool protein. The presence of aluminium, iron, and calcium indicated their usage as mordants. Trace amounts of copper, silica, and magnesium might originate from the contaminants. FT-IR analysis showed bands characteristic for woollen fibres and SEM micrographs defined the structure of the wool. Keywords: natural dyes; flavonoids; flavone glycosides; anthraquinones; extraction procedure; liquid chromatography mass spectrometry
1. Introduction Scientific analysis of objects of artistic and historic significance is the key to reconstructing their story and elucidating the circumstances under which they have been created. Investigation of the origin, nature, and chemical behaviour of the coloured materials used in the production of historical artefacts may shed new light on their original colour and appearance [1]. Knowledge of historical Molecules 2018, 23, 339; doi:10.3390/molecules23020339
www.mdpi.com/journal/molecules
Molecules 2018, 23, 339
2 of 15
artworks’ components essential for documentation of their authenticity requires major breakthroughs in interdisciplinary collaborations between archaeologists and analytical chemists [2]. For this reason, many analytical techniques have been employed in the investigation of natural dyestuffs. Identification of colorants in artworks and objects of historical value poses a whole set of analytical challenges due to the wide range of possible dye sources and the vast number of chemical classes they belong to, the small amount of sample available for analysis, and the low amount of coloured compounds often present at trace levels [3]. The first objective of historical textile reconstruction is the identification of fibres’ constitution. They are generally made of organic materials, such as plant and/or animal fibres or silk. Fourier transform infrared spectroscopy (FT-IR) and Scanning electron microscopy with energy-dispersive X-ray detector (SEM-EDS) are powerful tools for fibres’ characterisation and enable us to distinguish their origin and identify mordants [4–6]. Until the mid-19th century, the only sources of dyes for textiles and other fibres were natural materials of vegetal or animal origin. In general, all shades of colour were made from combinations of the primary colours: blue, red, and yellow. An exact identification of the colouring substances in biological sources gives us the information necessary to determine the origin of dyestuffs used to create the object. This data, with additional information about metal ions (mordant-type dyes) and the type of textile raw material used to produce an artefact, can help in determining how, when, and where these works of art were made. One approach to achieve high sensitivity of the analytical procedure is to improve the dye extraction process. It is crucial to fully extract the information that can lead to the identification of a particular plant or other dyestuff used to colour a textile. Since most textiles are mordanted with metal ions, the extracting solution must be able to disrupt the dye–metal complex. The conventional method of a dye’s isolation from textile fibres is usually carried out with boiling a hydrochloric acid–methanol mixture. This procedure allows for the efficient isolation of flavonoids and anthraquinone dyestuffs from textile fibres but causes hydrolysis of their glycosidic forms to parent aglycones [7,8]. Moreover, the use of hydrochloric acid is ineffective for the extraction of indigotin and indirubin [9]. Blue indigoid dyes are better extracted with hot pyridine, pyridine with water [10,11], dimethylformamide, or dimethylsulfoxide [12,13]. For this reason, milder extraction methods based on the use of ethylenediaminetetraacetic acid (EDTA) or citric, tartaric, formic, or hydrofluoric acid are currently being tested [14–18]. Identification of these components in complex mixtures requires sensitive and selective analytical techniques. Liquid chromatography coupled with spectrophotometric and mass-spectrometric detectors (LC-UV-Vis-MS) has been proven to be a useful tool for analysing works of art, especially those containing natural organic dyestuffs [19–22]. A historical carpet originating from a Turkish workshop active in the second half of the 16th century in Cairo and preserved currently in the National Museum in Kracow, Poland, was comprehensively studied in the present work. Twelve fibre samples were analysed in order to identify the natural dyes and mordants used for their manufacture. A mild extraction method with hydrofluoric acid has been optimised for dyestuffs isolation from the wool samples. The dyes were identified by high-performance liquid chromatography-mass spectrometry with atmospheric pressure electrospray ionisation in the negative mode (HPLC-ESI(-)-MS) and confirmed by quadrupole time-of-flight (QTOF) mass spectrometry. Twenty-six dyestuffs were detected and recognised or tentatively characterised, of which four compounds had not been described before. The HPLC-MS technique was also applied to analyse reference dyestuff in the extracts of weld (Reseda luteola L.), lac dye (Kerria lacca Kerr), and indigo (Isatis tinctoria L.) in order to provide indications of the structures of colouring substances that were detected in the historical samples but are not commercially available in pure form. Mordant ions identification was performed by SEM-EDS. Fourier transform infrared spectroscopy was utilised for substrate characterisation. The results reported in the present paper enabled full dye fingerprints in the fibre samples.
Molecules 2018, 23, 339 Molecules 2018, 23, x FOR PEER REVIEW
3 of 15 3 of 15
2. 2. Materials Materials and and Methods Methods 2.1. Chemicals Chemicals and and Materials Materials 2.1. Acetonitrile and and methanol methanol used used as as mobile mobile phase phase components components of of HPLC HPLC grade grade were were purchased purchased Acetonitrile from Merck Merck (Darmstadt, (Darmstadt, Germany). Germany). Hydrofluoric Hydrofluoricacid acid(HF, (HF, 48% 48% in in water) water) was was purchased purchased from from from Sigma-Aldrich (Steinheim, Germany). Dimethyl sulfoxide (DMSO, ACS grade) was obtained from Sigma-Aldrich (Steinheim, Germany). Dimethyl sulfoxide (DMSO, ACS grade) was obtained from Merck KGaA KGaA(Darmstadt, (Darmstadt,Germany). Germany).Standards Standards of dyes: luteolin, apigenin, fistein, and luteolin Merck of dyes: luteolin, apigenin, fistein, and luteolin 7-O7-O-βD -glucoside of HPLC purity were purchased from Sigma-Aldrich. Raw dyestuff materials: β-D-glucoside of HPLC purity were purchased from Sigma-Aldrich. Raw dyestuff materials: weld weld (R. luteola), lac dye (K. lacca), indigo tinctoria)were wereobtained obtainedfrom from Kremer Kremer Pigmente Pigmente (R. luteola), lac dye (K. lacca), andand indigo (I. (I. tinctoria) (Aichstetten, Germany) Germany) in in dried dried form. form. The The dyestuff dyestuff materials materialswere were homogenised homogenisedprior priorto to analysis. analysis. (Aichstetten, All aqueous solutions were prepared using deionised Milli Q water. water. 2.2. Origin Origin of of Textile Textile Fibre Fibre Samples Samples 2.2. The samples samples of of textile textile fibres fibres were were collected collected from from aa historical historical carpet carpet exhibited exhibited in in the the National National The Museum in Kracow (Poland). The carpet, with Chintamani motifs, is unique because it is one of the the Museum in Kracow (Poland). The carpet, with Chintamani motifs, is unique because it is one of largest preserved preserved carpets carpets in in the the world; world; it it has has aa surface surface area area of of almost almost 40 40 square square meters, meters, being being 1063 1063 cm cm largest long and 372 cm wide (Figure 1). The origin of the rug was attributed to a Turkish workshop active in long and 372 cm wide (Figure 1). The origin of the rug was attributed to a Turkish workshop active in the second half of the 16th century in Cairo, based on the analysis of the weave structure, identification the second half of the 16th century in Cairo, based on the analysis of the weave structure, identification of motifs, motifs, and and the the technique technique used. used. According Accordingto tochurch churchtradition, tradition,the thecarpet carpetwas wasdonated donatedby byStanislaw Stanislaw of Jablonowski, the colonel of Polish King Jan Sobieski (1629–1696), after his return from the victorious Jablonowski, the colonel of Polish King Jan Sobieski (1629–1696), after his return from the victorious Battle of of Vienna Vienna (1683). (1683). In In 1901, 1901, itit was was transferred transferred from from the the Corpus Corpus Christi Christi Church Church in in Kracow Kracow to to the the Battle collection of the National Museum. The carpet survived in eight parts, which cannot be explained collection of the National Museum. The carpet survived in eight parts, which cannot be explained merely by by the the structure structure of of the the warp, warp, weft, weft, and and Persian Persian knots knots breaking breaking as as aa result result of of damage damage during during merely usage. Some Some regular regular line forfor thethe needs of usage. line intersections intersectionsindicate indicatepurposeful purposefulextraction extractionofofparts, parts,perhaps perhaps needs the owner or collectors of works of art. One of the detached fragments is now in the collection at the of the owner or collectors of works of art. One of the detached fragments is now in the collection at Munich Museum of Ethnology. the Munich Museum of Ethnology. Twelve fibre samples were collected collected from from different different parts parts of of the the carpet carpet and and are are referred referred to to as: as: F1, F1, Twelve fibre samples were F2, F3, and F4 (yellowish of various shades), F5 and F6 (light and dark reds), F7 (navy blue), F8, F9, F2, F3, and F4 (yellowish of various shades), F5 and F6 (light and dark reds), F7 (navy blue), F8, F9, and F10 F10 (greens (greens of of different different shades), shades), F11 F11 (brown), (brown), and and and F12 F12 (beige). (beige).
Figure 1. Fragment of historical carpet with fibre sampling location (National Museum in Kracow, Figure 1. Fragment of historical carpet with fibre sampling location (National Museum in Kracow, collection MNK XIX-8950). collection MNK XIX-8950).
Molecules 2018, 23, 339
4 of 15
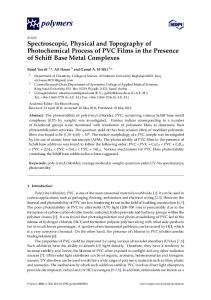
2.3. Extraction of Dyes from Threads Dyes were extracted from the thread samples (estimated weight 0.2 mg) in an ultrasonic bath for 1 h (4 × 15 min) at a temperature not exceeding 40 ◦ C using 500 µL of solution containing 0.4 M hydrofluoric acid/methanol/acetonitrile/DMSO (2:1:1:1, v/v/v/v). The mixtures were centrifuged at 9000 rpm for 5 min, and the supernatants were evaporated almost to dryness under a stream of nitrogen. The residues were dissolved in 300 µL of ACN/MeOH/DMSO, (1:1:1, v/v/v), out of which 2 µL were injected into the HPLC column. The plant raw materials used as reference for the analysis of the historical textile samples were also extracted according to the HF procedure. Standards used for identification purposes were dissolved in an ACN/MeOH/DMSO (1:1:1, v/v/v) mixture. 2.4. Equipment The morphology of the samples was studied with an scanning electron microscopy (SEM) operated with a secondary electron detector in high vacuum mode at an accelerating voltage of 10–20 kV (FEI Quanta FEG 250, Thermo Fisher Scientific, Waltham, MA, USA). Identification of elements was performed using energy dispersive spectroscopy (EDS) on EDAX Genesis APEX 2i (Ametek, Berwyn, PA, USA) with an ApolloX SDD spectrometer at an accelerating voltage 20 kV. Infrared transmission spectra were recorded with a Nicolet iS50 FT-IR spectrometer (Thermo Fisher Scientific, Waltham, MA, USA) equipped with the Specac Quest single-reflection diamond attenuated total reflectance (ATR) accessory. Spectral analysis was controlled by the OMNIC software package (Thermo Fisher Scientific, Waltham, MA, USA). Analyses were performed using the liquid chromatograph series 1290 (Agilent Technology, Waldbronn, Germany) consisting of the binary pump G4220A, the autosampler G4226A, the thermostated column compartment G1316C, the diode-array detector G1315C, and the triple quadrupole mass spectrometer G6470 with an Agilent Jet Stream electrospray ionisation source. The chromatographic system was controlled with Agilent MassHunter software (B.07.05, Agilent, Santa Clara, CA, USA). The components of the extracts were separated on a C-18 reversed-phase column. The analytes were monitored with a diode array detector and a mass spectrometer connected in-line and characterised with their retention times, UV-vis, and mass spectra. In order to ensure universal elution conditions for chemically different compounds, a wide gradient of methanol/acetonitrile and water was used. The structures of the identified dyes were confirmed by HPLC-ESI(-)-QTOF analysis using an Agilent 1290 LC system coupled to the Agilent QTOF mass spectrometer G6540 (Santa Clara, CA, USA) operated in negative ionisation scan mode under the same chromatographic conditions. The parameters of the optimised spectrochromatographic analysis are presented in Table S1. 3. Results and Discussion 3.1. Microscopic and Spectroscopic Studies 3.1.1. Surface Morphology Surface profiles, nature, homogeneity, and microstructure of the samples of the historical fibres were analysed using a scanning electron microscope. SEM micrographs of fibre surfaces display a cylindrical shape and nodular thickening across their length, all of which are typical for the scale structure of wool (Figure 2a–c). In some cases, roughened surfaces were observed with damage of this scale structure due to natural aging (Figure S1). Some of the samples were more degraded, since they have a greater number of fractured fibrils. The diameters of the wool fibres ranged from 20 to 40 µm.
Molecules 2018, 23, 339
5 of 15
Molecules 2018, 23, x FOR PEER REVIEW
5 of 15
Figure 2. Scanning Electron Microscopy (SEM) micrographs of: (a) fibre F1 (magnitude 2500×); (b) Figure 2. Scanning Electron Microscopy (SEM) micrographs of: (a) fibre F1 (magnitude 2500×); (b) fibre fibre F11 (magnitude 2500×); (c) fibre F1 (magnitude 100×); (d) Scanning Electron Microscopy-Energy F11 (magnitude 2500×); (c) fibre F1 (magnitude 100×); (d) Scanning Electron Microscopy-Energy Dispersive Spectroscopy (SEM-EDS) spectrum of fibre F1. Dispersive Spectroscopy (SEM-EDS) spectrum of fibre F1.
3.1.2. Fourier Transformation Infrared Spectroscopy Analysis 3.1.2. Fourier Transformation Infrared Spectroscopy Analysis Infrared is a highly suitable technique for fibres characterisation and allows us to distinguish is aThe highly suitableoftechnique fibresS2) characterisation and allows us to distinguish theirInfrared origin [23]. IR spectra all fibres for (Figure showed a broad stretching band of amino their origin [23]. The IR spectra of all fibres (Figure S2) showed a broad stretching band amino NH and phenolic -OH groups at 3275 cm−1. Absorption at 2925 and 2880 cm−1 was due toofthe C-H − 1 − 1 -NH and phenolic -OH groups at 3275 cm . Absorption at 2925 and 2880 cm was due to the C-H −1 asymmetric stretching of aliphatic carbon compounds. The IR peak at 1225 cm was due to C-N asymmetric stretching of aliphatic carbon compounds. IR peak cm−1 of was due to C-N stretching. The weak absorption band near 1040 cm−1 wasThe attributed to at the1225 presence ether linkages. − 1 stretching. The weak absorption band near 1040 cm was attributed to the presence of ether linkages. Amide I (1700–1600 cm−1) and amide II (1550–1500 cm−1) bands, which are typical for proteins, were −1 ) and amide II (1550–1500 cm−1 ) bands, which are typical for proteins, Amide I (1700–1600 cm also observed in the IR spectra of all the investigated samples. An amide I band together with weaker were also observed in the IR spectra of allgenerally the investigated samples. An amide I band together with contributions around 1674–1695 were attributed to β-sheet structures. The IR band weaker contributions around 1674–1695 were generally attributed to β-sheet structures. The IR band components in the 1662–1686 cm−1 region reflect the contribution of β-turn. Thus, the samples were 1 region reflect the contribution of β-turn. Thus, the samples were components inanimal the 1662–1686 cm−Moreover, unequivocally fibres [24]. observation of the 640–650 cm−1 and 590–525 cm−1 bands, −1 unequivocally animal fibres [24]. Moreover, observation of the the thread 640–650samples cm−1 and designated to ν (C-S) stretching vibrations, indicates that are590–525 woollencm fibresbands, [25]. designated to ν (C-S) stretching vibrations, indicates that the thread samples are woollen fibres [25]. 3.1.3. Scanning Electron Microscopy with Energy-Dispersive X-ray Detector Analysis 3.1.3. Scanning Electron Microscopy with Energy-Dispersive X-ray Detector Analysis SEM-EDS was employed to identify the mordant metals used during the dyeing of the historical SEM-EDS was employed to identify the mordant metals used during the dyeing of the historical threads. A typical EDS spectrum of the textile specimens is given in Figure 2d. Two elements, i.e., threads. A typical EDS spectrum of the textile specimens is given in Figure 2d. Two elements, i.e., carbon and oxygen, arising from wool proteins were detected in large quantities (Table 1). Wool is carbon and oxygen, arising from wool proteins were detected in large quantities (Table 1). Wool is mostly composed of keratin (up to 75%), which includes carbon (50%), oxygen (22%), nitrogen (17%), mostly composed of keratin (up to 75%), which includes carbon (50%), oxygen (22%), nitrogen (17%), hydrogen (7%), and sulphur (4%) [26]. The presence of Al, Fe, S, Ca, Mg, Si and trace amounts of hydrogen (7%), and sulphur (4%) [26]. The presence of Al, Fe, S, Ca, Mg, Si and trace amounts of copper copper were also found. Aluminium and iron probably originate from a mordant essential to obtain were also found. Aluminium and iron probably originate from a mordant essential to obtain fast fast colours. While aluminium salts do not change the colours of dyed textiles, iron and copper salts colours. While aluminium salts do not change the colours of dyed textiles, iron and copper salts cause cause a darkening of yellow and red mordant dyes and tannins affect the final colour of the textile a darkening of yellow and red mordant dyes and tannins affect the final colour of the textile fragments fragments during the dyeing process [26]. Calcium, Si, and Mg might originate from the contaminations during the dyeing process [26]. Calcium, Si, and Mg might originate from the contaminations during during storage and utilisation of the carpet; thus, it is not possible to conclude if they are the storage and utilisation of the carpet; thus, it is not possible to conclude if they are the components components of the mordants. The presence of sulphur is not surprising, since this element is found of the mordants. The presence of sulphur is not surprising, since this element is found in animal in animal fibres. Chromium and potassium were not detected in any of the investigated samples, fibres. Chromium and potassium were not detected in any of the investigated samples, although their although their salts could have been used as mordants in the past [27,28]. The investigated samples salts could have been used as mordants in the past [27,28]. The investigated samples did not differ did not differ significantly with respect to elemental composition, although relative amounts of particular elements were variant. The brown fibre F11 was probably covered by the greatest amount
Molecules 2018, 23, 339
6 of 15
significantly with respect to elemental composition, although relative amounts of particular elements were variant. The brown fibre F11 was probably covered by the greatest amount of iron and calcium salts, as can be seen in Figure 2d and Table 1. The EDS spectrum of this sample exhibits also the highest content of sulphur and silica. Table 1. Composition of elements (in atomic % a ) based on EDS analysis. Fibre No.
F1
F2
F3
F4
F5
F6
F7
F8
F9
F10
F11
F12
70 27 0.5 0.2 0.8 0.5