Chromatographic methods for simultaneous determination of diiodohydroxyquinoline and Metronidazole in their binary mixture Nouruddin Wageih Ali1*, Mohammed Gamal1 and Mohammed Abdelkawy2 1
Pharmaceutical Analytical Chemistry Department, Faculty of Pharmacy, Beni-Suef University, Alshaheed Shehata Ahmed Hegazy St., Beni-Suef Egypt 2 Pharmaceutical Analytical Chemistry Department, Faculty of Pharmacy, Cairo University, Kasr El-Aini St., Cairo, Egypt
Abstract: Two chromatographic methods were developed for analysis ofdiiodohydroxyquinoline (DIHQ) and metronidazole (MTN). In the first method, diiodohydroxyquinoline and metronidazole were separated on TLC silica gel 60F254 plate using chloroform: acetone: glacial acetic acid (7.5: 2.5: 0.1, by volume) as mobile phase. The obtained bands were then scanned at 254 nm. The second method is a RP-HPLC method in which diiodohydroxyquinoline and metronidazole were separated on a reversed-phase C18 column using water : methanol (60 :40, V/V, PH=3.6 )as mobile phase at a flow rate of 0.7 mL.min-1 and UV detection at 220 nm. The mentioned methods were successfully used for determination of diiodohydroxyquinoline and metronidazole in pure form and in their pharmaceutical formulation. Keywords: TLC-spectrodensitometry, RP-HPLC, diiodohydroxyquinoline and metronidazole.
INTRODUCTION Metronidazole (MTN) is 2-methyl-5-nitroimidazole-1ethanol (Merck, 2006). It is a 5-nitroimidazole derivative with activity against anaerobic bacteria and protozoa. MTN is an amoebicide at whole sites of infection with Entamoeba histolytica. The effectiveness of MTN against parasites in the bowel lumen is genenerally weak as a result of its rapid absorbtion so it should be used together with luminal amoebicide in the treatment of invasive amoebiasis (Martindale, 2006). Diiodohydroxyquinoline (DIHQ) or iodoquinol (USP, 2009) is 5, 7-diiodoquinolin-8-ol (Merck, 2006) (1), is a halogenated hydroxyquinoline which can be used in the treatment of amoebiasis. DIHQ is poorly absorbed from the gastrointestinal tract and is amebicidal at the site of infection (Martindale, 2006). This combination of two amoebicidal agents (DIHQ and MTN) is used for treatment of extra and intra-intestinal amoebiasis.The structural formulas of DIHQ and MTN are shown in fig. 1. There are many reports for the determination of DIHQ and MTN either separately or in combination with other drugs including spectrophotometry (Nagarajaet al., 2002; Erk et al., 2001; Khashaba et al., 1999; Shingbal et al., 1980; Rizk et al., 2000; Bhowal et al., 1990; Saha et al., 1988; Belal et al., 1984; Windheuser et al., 1967), electrochemistry ( Lu et al., 2004; Jin et al., 2000), HPLC (Yuet al., 2002; Fraseyet al., 2004; Liu et al., 2003; Shenet al., 2003; Storms and Stewart., 2002; Daeseleireet al., 2000; Rizk et al., 2002; Wojtowicz., 1984), HPTLC *Corresponding author: e-mail:
[email protected] Pak. J. Pharm. Sci., Vol.26, No.5, September 2013, pp.865-871
(Argekaret al., 1996), GC (Wang et al., 2001), atomic absorption spectrometry (Nejem et al., 2008), iodometric titration (Soliman, 1975) and non aqueous titration (Kavarana, 1959; Paranjothy and Banerjee., 1973). Few methods have been mentioned for analysis of DIHQ and MTN in binary mixture. The first method determined the two drugs spectrophotometrically using modified vierodt equation (Chatterjee et al., 1986). The second method used the bivariate calibration method for resolution of the binary mixture and compared results to those of derivative spectrophotometry (Lopez et al., 1997). The third method determined DIHQ and MTN in pharmaceutical preparation by TLC (Parimoo et al., 1992), in which a very complicated process was applied where the spots were detected by spraying 20% w/v methanloic solution of KOH and heating to 80ºC till development of reddish pink color then the spots scrapped and dissolved in 0.1 N HCl and finally the absorbances of supernatant were measured spectrophotometrically at 280 nm. As noted, this method suffers a lot of drawbacks among which is the lack of precision, accuracy and specificity required in determination of drug combinations. Modern TLC densitometry offers a simple manner to quantify directly on TLC plate where the optical densities of the detached bands are measured quantitatively. The concentrations of compounds are detected by comparing to a standard curve from reference materials chromatographed simultaneously under the same conditions (Grinberg, 1990). Therefore, the objective of this work is to develop sensitive, selective and reproducible methods for simultaneous determination of DIHQ and MTN.
865
Chromatographic methods for simultaneous determination Chromatographic methods are well known for providing high selectivity and sensitivity when used for determination of pharmaceutical drugs. In this paper, two chromatographic methods, namely, TLC-spectrodensitometry and reversed phase high performance liquid chromatography (RP-HPLC) have been proposed for simultaneous determination of DIHQ and MTN that can be used for routine quality control analysis of these drugs either in bulk powder or in pharmaceutical formulation.
MATERIALS AND METHODS Apparatus 1- UV lamp with short wavelength 254 nm (USA). 2- TLC scanner 3 densitometer (Camage, Muttenz, Switzerland). The following requirements should be considered: - Slit dimensions: 6.00x0.45, Micrometer - Scanning speed = 20 mm/s - Data resolution = 100 µm/step 3- Sample applicator for TLC Linomat IV with 100 µl syringe (Camage, Muttenz, Switzerland). 4- TLC plates (20x20 cm) coated with silica gel 60 F 254 (Merck KgaA, Darmstad, Germany). 5- Shimadzu Class-LC 10 AD Liquid Chromatograph equipped with Shimadzu SPD-10 A UV-VIS Detector (Shimadzu Corporation, Japan). Phenomenex C18 (25/cm x 4.6/mm i.d, 5/µm particle size) column was used as a stationary phase for HPLC determinations (USA). 6- Sonix TV ss-series ultrasonicator (USA). Materials Pure samples DIHQ and MTN were kindly supplied by (CID) Co. Chemical Industries Development, Giza, Egypt. Their purities were found to be 100.01±0.837 and 99.21±1.602, respectively, according to the spectrophotometric method of (CID) company. Market samples Paramibe compound® tablet (Batch No 114336W) labeled to contain 250/mg of DIHQ and 250/mg of MTN, is from (CID) Co. Chemical Industries Development, Giza, Egypt. Reagents All mentioned reagents and chemicals were of analytical grade and were used without extra purification 1- Chloroform, acetone, orthophosphoric acid and glacial acetic acid from (EL – NASR Pharmaceutical Chemicals Co., Abu - Zabaal, Cairo, Egypt). 2- Methanol HPLC grade (Sigma Aldrich, Germany). 3- Deionized water (SEDICO pharmaceutical Co., 6th October City, Egypt).
866
Preparation of standard solutions 1- Stock standard solution of DIHQ and MTN (0.5 mg.mL-1): weigh accurately 0.05 gram of DIHQ and MTN into two separate 100-mL volumetric flasks, add 50 mL methanol to each flask, stir magnetically for 30 minutes to dissolve then complete the volume to the mark with methanol. 2- Working standard solutions (100 µg.mL-1): transfer accurately 20 mL of DIHQ and MTN stock standard solutions respectively into two 100-mL volumetric flasks, then complete the volume to the mark with methanol. Procedures TLC-spectrodensitometric method 1. Linearity and construction of calibration curves: Apply accurate aliquots equivalent to (0.2-1.8 µg.mL-1) of DIHQ, (0.4-1.8 µg.mL-1) of MTN from their corresponding working solutions (l00 µg.mL-1) to TLC plates(20x20cm) as band using the Camage TLC sampler. Leave a space of 1 cm between each band and1.5 cm from the bottom edge of the plate. Develop the plate in a chromatographic tank previously saturated for one hour with the developing mobile phase consisting of chloroform: acetone: glacial acetic acid (7.5: 2.5:0.1, by volume) by ascending chromatography at room temperature (Parimoo et al., 1992). Detect the bands under UV-lamp and scan at 254 nm under the specified experimental conditions. Construct the calibration curves for each compound by plotting the peak area/100 versus the corresponding concentration and then compute the regression equations. 2. Analysis of laboratory prepared mixtures: Prepare mixtures containing DIHQ and MTN in different ratios. Proceed as described in linearity and construction of calibration curves. Calculate the concentrations of the two compounds from their corresponding regression equations. RP-HPLC method 1. Linearity and construction of calibration curves: Transfer accurate aliquots equivalent to (50-1500) µg of DIHQ and (50-1000) µg of MTN from their corresponding working solutions (100µg.mL-1) into two separate sets of a series of 10-mL volumetric flasks. Complete the volume with methanol. Make triplicate 20 µL injections for each concentration. The separation was done on a C18 column using (water: Methanol 60: 40 v/v, pH adjusted to 3.6 with orthophosphoric acid) as a mobile phase. Record the chromatograms at ambient temperature maintaining the flow rate at 0.7mL.min-1 and detect the effluent at 220 nm. Construct the calibration curves for each compound by plotting the peak area/104 versus the corresponding concentration and then compute the regression equations. Pak. J. Pharm. Sci., Vol.26, No.5, September 2013, pp.865-871
Nouruddin Wageih Ali et al 2. Analysis of laboratory prepared mixtures: Prepare mixtures containing DIHQ and MTN in different ratios. Proceed as described in linearity and construction of calibration curves. Calculate the concentrations of the two compounds from their corresponding regression equations. Application of the proposed methods to pharmaceutical formulations Thoroughly powder ten tablets of Paramibe compound® and mix, then weigh accurately an amount of the powder equivalent to 50/mg of DIHQ and 50/mg of MTN in 250ml beaker. Add 70/mL of methanol; stir magnetically for 30 minutes then filter through filter paper into a 100-mL volumetric flask. Wash the beaker and the funnel then complete the volume with methanol to get a concentration of 0.5mg.mL-1 for each drug. Appropriate dilutions were made to bring up a concentration of 50, 25 and 20µg.mL-1 for each drug. The procedure of each method was followed and the concentrations of DIHQ and MTN were calculated from their corresponding regression equations.
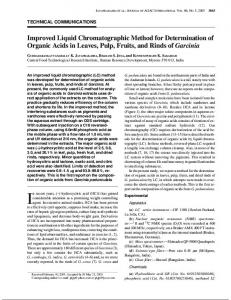
slit dimensions of the scanning light beam should cover completely the band dimensions on the scanned track without any interference of adjacent bands. Different slight dimensions were tried where 6 mm x 0.45 mm provided the highest sensitivity the method is depend on the difference in Rf values of DIHQ (Rf = 0.67) and MTN (Rf = 0.26) as shown in fig. 2.
Fig. 2: 3D diagram showing an example of separated mixture of DIHQ and MTN in the spectrodensitometric method.
RESULTS Method development and optimization TLC- spectrodensitometric method The goal of this work is to develop a method that can be applied successfully for separation and quantification of the studied drugs. B
A
Molecularformula C9H5I2NO Molar mass396.951
Molecular formula C6H9N3O3 Molar mass 171.15
Fig. 1: chemical structure of DIHQ (A) and MTN (B) Evaluation of the optimum parameters for best separation was carried out by investigating the effect of different variables. Different developing systems with different compositions and ratios were tried, but complete separation of DIHQ and MTN was achieved by using the reported developing mobile phase (31) consisting of chloroform: acetone: Glacial acetic acid (7.5:2.5:0.1, by volume). Also different scanning wavelengths were tried, but the best sensitivity obtained when 254 nm was used as scanning wavelength. Different band dimensions were tried to give sharp and symmetrical peaks. The optimum band length chosen was 6 mm and the inter space between bands was 1 cm. The Pak. J. Pharm. Sci., Vol.26, No.5, September 2013, pp.865-871
RP-HPLC method A validated isocratic RP-HPLC method with UV detection was developed for simultaneous determination of DIHQ and MTN. To optimize the mentioned RP-HPLC method, all of the experimental conditions were tested. The stationary phase used was selected to be the reversedphase over the normal phase separation due to the defects of the normal phase, e.g. hydration of silica with water that can cause tailing of peak. C18 column is preferred for mixture separation than C8 column, as it gives higher resolution. Mobile phase systems of different compositions and ratios were tried e.g. (water : methanol) using different acids (H3PO4 and CH3COOH) at different pH values. Complete separation of DIHQ and MTN without interference within a suitable time was achieved using water: methanol (60:40, v/v pH adjusted to 3.6 with H3PO4 acid).In addition, the effect of pH was studied by using acids of different pka values (H3PO4 and CH3COOH). It was found that pH = 3.6 with H3PO4 acid was suitable for proper resolution and peak shape. Different wavelengths were studied for detection of the effluent; it was found that detection at 220 nm gave maximum sensitivity for both compounds. Also different flow rates were tested to provide good separation within acceptable run time where 0.7 mL.min1 was the best flow rate. Finally, an effective separation was done by using C18 (25cm×4.6mm i.d. 5µm particle size) column as a stationary phase and using water: methanol (60:40, v/v pH adjusted to 3.6 with H3PO4 acid) as a mobile phase, maintaining the flow rate at 0.7 mL min−1 with UV detection at 220 nm. The retention times
867
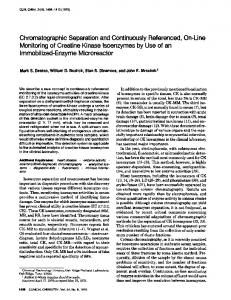
Chromatographic methods for simultaneous determination for DIHQ and MTN were 3.9 and 5.8 min respectively, fig. 3.
Y1=2.5443C1 - 0.0258 Y2=1.1695C2 + 0.1827
r1 = 0.9991 r2 = 0.9986
Where Y1 and Y2 are the peak area /100, C1 and C2 are DIHQ and MTN concentrations in µg. band-1 respectively and r1 and r2 are the correlation coefficients. - In case of RP-HPLC method Y1=0.8861C1+25.724 r1 = 0.9997 Y2=4.9775C2-12.539 r2 = 0.9992 Where Y1and Y2 are the peak area /104, C1and C2 are DIHQ and MTN concentrations in µg.mL-1 respectively and r1 and r2 are the correlation coefficients. Precision of the proposed TLC-spectrodensitometric and RP-HPLC methods were evident as shown in table 1. Accuracy of the proposed methods was checked by applying the mentioned methods for analysis of different blind samples of DIHQ and MTN. The concentrations were calculated from the corresponding regression equations. The results obtained as shown in table 2. Fig. 3: HPLC chromatogram of DIHQ and MTN using methanol: water (40:60, v/v) PH adjusted to 3.6 with H3PO4 acid as a mobile phase with UV detection at 220 nm at a flow rate of 0.7/mL. Method validation Method validation was performed according to ICH guidelines (ICH, 2005). Linearity of the described methods was evaluated and it was evident in the concentration range of 0.2-1.8µg.band-1 for DIHQ and 0.4-1.8/µg.band-1 for MTN in case of TLC spectrodensitometric method and 5-150µg.mL-1 for DIHQ and 5100/µg.mL-1 for MTN in case of RP-HPLC method, good linearity was evident by the high value of the correlation coefficient and the low intercept value, (table 1). The regression equations were calculated and found to be: - In case of TLC-densitometric method
Accuracy of the methods was assured by applying the standard addition technique on paramibe compound® tablets where good recoveries were obtained revealing no interference from excipients and good accuracy of the proposed methods. According to ICH guidelines, for chromatographic procedures, representative chromatograms should be used to demonstrate specificity and individual components should be appropriately labeled. Specificity of the proposed methods is evident from the TLC-spectrodensitometric and RP-HPLC chromatograms in figs. 2 and 3, respectively. According to the ICH recommendations, the approach based on the S.D. of the response and the slope was used for determining the detection and quantitation limits, LOD=3.3S.D./Slope, LOQ=10S.D./Slope (table 1). Robustness of the proposed methods was evaluated in the
Table 1: Results of assay validation parameters of the proposed methods for the determination of DIHQ and MTN in their mixture Parameters Range Slope Intercept Correlation coefficient (r) Accuracy (mean ± SD) (RSD%)a* (RSD%)b* LOD LOQ
TLC-spectrodensitometric method DIHQ MTN 0.2-1.8 (µg.band-1) 0.4-1.8(µg.band-1) 2.5443 1.1695 -0.0258 0.1827 0.9991 0.9986 100.21±1.537 100.14±1.807 1.264 1.201 1.622 1.324 1.99(µg.band-1) 0.51(µg.band-1) 6.04(µg.band-1) 1.55(µg.band-1)
RP-HPLC method DIHQ MTN 5-150(µg.mL-1) 5-100 (µg.mL-1) 0.8861 4.9775 25.724 -12.539 0.9997 0.9992 99.94±0.773 99.89±0.909 1.464 1.311 1.619 1.256 0.85(µg.mL-1) 0.61(µg.mL-1) 2.56(µg.mL-1) 1.86(µg.mL-1)
a and b the intra-day and inter-day relative standard deviations of the average of concentrations 0.4 , 0.6,1.0 µg.band-1 for each in case of TLC-spectrodensitometric method and 20.00 , 40,00 and 60.00 µg.mL-1for each drug in case of RP-HPLC method
868
Pak. J. Pharm. Sci., Vol.26, No.5, September 2013, pp.865-871
Nouruddin Wageih Ali et al Table 2: Results of accuracy for determination of pure DIHQ and MTN by the proposed spectrodensitometric and RPHPLC methods TLC-spectrodensitometric method Taken(µg.band-1)
DIHQ 0.40 0.60 0.80 1.00 1.20 1.40
Found* (µg .band-1)
MTN 0.40 0.60 0.80 1.00 1.20 1.40
DIHQ 0.40 0.59 0.82 0.99 1.20 1.42
RP-HPLC method
Recovery%
MTN 0.41 0.59 0.81 0.99 1.18 1.42
-
DIHQ 100.00 98.33 102.33 99.00 100.00 101.43 100.21 ±1.537
MTN 102.50 98.33 101.25 99.00 98.33 101.43 100.14 ±1.807
Taken(µg.band-1)
Found* (µg .band-1)
Recovery%
DIHQ 10.00 15.00 20.00 50.00 100.00 150.00
DIHQ 9.93 14.98 20.09 49.92 98.87 151.50
DIHQ 99.30 99.87 100.45 100.16 98.87 101.00 99.94 ±0.773
MTN 5.00 10.00 20.00 40.00 80.00 100.00
MTN 4.91 10.07 19.92 40.15 80.32 100.08
-
MTN 98.20 100.70 99.60 100.38 100.40 100.08 99.89 ±0.909
*Average of three determinations
Table 4: Statistical analysis of parameters required for system suitability testing of the proposed method.
Parameters Resolution (Rs) Capacity factor(K') Symmetry factor Selectivity factor(γ)
For TLC-densitometric method Obtained Reference value value DIHQ MTN 1.82 ›1.5 0.49 2.85 0- 10 acceptable 1.25 1.0 ≈1 5.82
›1
For RP-HPLC method Parameters
Obtained value
Reference value
Resolution (Rs) Capacity factor(K')
DIHQ 2.50 2.55
MTN 4.36
›1.5 1- 10 acceptable
Tailing factor (T)
1.33
1.40
‹ 1.5-2
Selectivity factor(γ)
1.71
Number of Theoretical plate(N) HETP (cm.plate-1) Height equivalent to theoretical plate
676.00
556.96
0.037
0.045
›1 Increases with increases efficiency The smaller the value, the higher the efficiency
Table 5: Statistical analysis of the results obtained by proposed methods and reference method for the determination of DIHQ and MTN Parameter Mean% SD N Student’s t-test (2.23)b F-value (5.05)b
Spectrodensitometric method DIHT MTN 100.21 100.14 1.537 1.807 6 6 0.265 0.943 3.372 1.272
RP-HPLC method DIHT MTN 99.94 99.80 0.773 0.909 6 6 0.151 0.785 1.172 3.106
Reference method DIHT MTN 100.01 99.21 0.837 1.602 6 6 -
a manufactured method personal communications . b the values between parenthesis are the theoretical values for t and F at P=0.05.
development phase by making small changes in the composition of mobile phase and detection wavelength. The low value of %RSD shows that the methods are robust and that deliberate small changes in the studied factors did not lead to a significant change in retention values, area or symmetry of the peaks. System suitability tests are depend on the idea that the equipment, electronics, analytical operations and samples Pak. J. Pharm. Sci., Vol.26, No.5, September 2013, pp.865-871
constitute an integral system that should be considered as whole. System suitability is used to evaluate method performance before or during the analysis of the drugs. System suitability was checked by calculating the capacity factor (K'), tailing factor (T), column efficiency (N), the selectivity factor (γ) and resolution (Rs), where the system was found to be adequate as shown in table 4.
869
Chromatographic methods for simultaneous determination
DISCUSSION The mentioned methods are effective for providing sensitive, accurate and reproducible quantitative analysis for simultaneous determination of DIHQ and MTN in bulk powder and in pharmaceutical preparation, without interference from excipients. TLC-spectrodensitometric method has the advantages of that many samples can be developed simultaneously using a small volume of mobile phase and provides high sensitivity and selectivity. RPHPLC method provides rapid, short analysis time, simple and selective method.
CONCLUSION The suggested methods provide selective, accurate and sensitive analytical procedures for the determination of DIHQ and MTN. They are suitable for routine analysis and quality control of DIHQ and MTN in its pharmaceutical formulation. Statistical analysis was performed by comparing the results of the mentioned methods with those of manufacturer method. No significant difference was observed regarding accuracy and precision, as shown in table (5).
REFERENCES Argekar AP, Raj SV and Kapadia SU (1996). Simultaneous Determination of Metronidazole and Nalidixic Acid in Pharmaceutical Dosage Forms by HPTLC. Indian Drugs, 33: 167-170. Belal F (1984). Spectrophotometric determination of halogenated 8-hydroxyquinoline derivatives. Talanta, 3(8): 648-650. Bhowal SK and Das TK (1990). Spectrophotometric determination of clioquinol, iodoquinol and broxyquinoline in pharmaceutical preparations after complexation with some bivalent metal ions. IJPS, 52(4): 200-204 Chatterjee PK, Jain CL and Sethi PD (1986). Simultaneous spectrophotometric estimation of diiodohydroxyquinoline and metronidazole or their analogues derivatives in combined dosage forms. IJPS,48(6): 195-197. Daeseleire E, De-Ruyck H and Van-Renterghem R (2000). Rapidconfirmatory assay for the simultaneous detection of ronidazole, metronidazole and dimetridazole in eggs using liquidchromatographytandem mass spectrometry. Analyst, 125(9): 15331535. Erk N and Altun MLN (2001). Spectrophotometric resolution of metronidazole and miconazole nitrate in ovules using ratio spectra derivative spectrophotometry and RP-LC. J. Pharm. Biomed. Anal., 25(1): 115-122.
870
Frasey AM, Boyer-Grand A, Pouget MP, Vennat B, Lartigue C and Galmier MS (2004). Validation of a Reversed-phase liquid chromatographic method for the determination of metronidazole in transparent oilwater-gel formulations Microchimica. Acta., 144(1): 171-176. ICH Harmonised Tripartite Guideline: Validation of Analytical Procedures: Text and Methodology, Q2(R1) Geneva 2005. Jin WR, Dong Q, Yu DQ, Ye XY and Li W (2000). Capillary electrophoresis/electrochemical detection system with on-line deoxygenation. Electrophoresis, 21(8): 1540-1544. Kavarana HH (1959). Assay of diiodohydroxyquin by non-aqueous titration. American journal of pharmacy and the sciences supporting public health,(Please proper abbreviation)131(5): 184-187. Khashaba PY, Refaat I H C, Emara K M and Gaber H M (1999). ,Utility of Diazotized 4-Amino-6-Chloro-1,3Benzene Disulphonamide for the Spectrophotometric Determination of 8-Hydroxquinolines and Dibenzazepines,Analytical Letters,32(15): 3029-3047. Liu G, Zhang QM, Wu W, Zhang J, Jiang R and Tan ST (2003). HPLC Determination of Metronidazole, Chloramphenicol and Hydrocortisone in Nasal Cavities Lotion,Yaowu Fenxi Zazhi,23(4): 317-319. López-De-Alba P L, Wróbel K, López-Martínez L, Wróbel K, Yepez-Murrieta M L, Amador-Hernández J (1997). Application of the bivariate spectrophotometric method for the determination of metronidazole, furazolidone and di-iodohydroxyquinoline in pharmaceutical formulations. JPBA, 16(2): 349-355. Lu SF, Wu KB, Dang XP and Hu SS (2004). Electrochemical Reduction and Voltammetric Determination of Metronidazole at a Nanomaterial Thin Film Coated Glassy Carbon Electrode. Talanta, 63: 653-657. Martindale: The Extra Pharmacopoeia., The Complete Drug Reference (2006). 35th Ed., K. Profitt (Ed.), Royal Pharmaceutical Society, London, UK. Merck Index: An Encyclopedia of Chemicals, Drugs and Biologicals (2006). 14th Ed., S. Budavari (Ed.), Merck & Co., Inc., Whitehouse Station, NJ. Grinberg N (1990). Modern Thin-Layer Chromatography, Marcel Dekker Inc., New York. Nagaraja P, Sunitha KR, Vasantha RA and Yathirajan HS (2002). Spectrophotometric determination of metronidazole and tinidazole in pharmaceutical preparations. J. Pharm. Biomed. Anal., 28(3-4): 527535. Nejem RM, Issa MM, El-Abadla NS, Al-Kholy M and Saleh AA (2008). Determination of diiodohydroxyquinoline using UV-visible and atomic absorption spectrometry. Asian Journal of Chemistry (AJC),20(5): 3849-3856. Pak. J. Pharm. Sci., Vol.26, No.5, September 2013, pp.865-871
Nouruddin Wageih Ali et al Paranjothy KLK and Banerjee SK (1973). Estimation of diiodohydroxyquin in nonaqueous media. J Pharm Sci, 62(10): 97-1698. Parimoo P, Umapathi P, Ravikumar N and Rajasehar S (1992). Determination of metronidazole and diiodohydroxyquinoline in pharmaceutical preparations by quantitative thin layer chromatography. Indian Drugs, 29(5): 228-230. Rizk M, Belal F, Ibrahim F, Ahmed S and Sheribah ZA (2000). Derivative UV spectrophotometric analysis of some pharmaceutically important halogenated 8Hdroxyquinoline derivatives via their Pd (II)Complexes. Scientia Pharmaceutica, 68(3): 297-307. Rizk M, Belal F, Ibrahim F, Ahmed S and Sheribah ZA (2002). LC of pharmaceutically important halogenated 8-hydroxyquinolines after precolumn derivatization with Pd (II). JPBA, 27(5): 813-820. Saha U, Sen AK and Das TK (1988). Spectrophotometric determination of clioquinol and diodoquin in pharmaceutical preparations using uranyl acetate as a chromogenic agent. Analyst, 113(11): 653-1655. Shen JZ, Yhang Y, Zhang SX, Ding SY and Xiang XH (2003). Determination of Nitroimidazoles and their metabolites in Swine tissues by liquid chromatography. J. AOAC Int. ,86(3): 505-509. Shingbal DM and Natekar GB (1980). Determination of diiodohydroxyquinoline in pharmaceutical dosage forms. IJPS, 42(6): 181-183.
Soliman SA (1975). A simple method for the determination of 5,7-diiodoquinolin-8-ol and 5-chloroAnalyst, 7-iodoquinolin-8-ol (clioquinol). The 100(1195): 696-702. Storms ML and Stewart JT (2002). Development of a reversed-phase liquid chromatographic method for the analysis of amoxicillin metronidazole and pantoprazole in human plasma using solid-phaseextraction. J. Liq. Chromatogr. Rel. Tech., 25(16): 2433-2443. United States Pharmacopeia (2009). The National Formulary USP, United States Pharmacopeia Convention Inc. Wang JH (2001). Determination of three nitroimidazole residues in poultry meat by gas chromatography with nitrogen-phosphorus detection. J. Chromatogr A, 918(2): 435-438. Windheuser JJ and Chu DY (1967). Colorimetric determination of iodochlorhydroxyquin and diiodohydroxyquin. J Pharm Sci , 6(4): 519-521. Wojtowicz EJ (1984). Reverse-phase high-performance liquid chromatographic determination of halogenated 8-hydroxyquinoline compounds in pharmaceuticals and bulk drugs. J Pharm Sci , 73(10): 1430-1433. Yu HY, Xia XP, Xu LY, He J and Chen FY (2002). Studies on determination of metronidazole and tinidazole in breast-feeding women. Yaowu Fenxi Zazhi, 22(2): 274277.
Vol. 26, No.5, September 2013 Vol. 26, No.5, September 2013 Vol. 26, No.5, September 2013 Vol. 26, No.5, September 2013 September 2013 September 2013 September 2013 September 2013
Vol. 26, No.5, Pages 853-1070 Vol. 26, No.5, Pages 853-1070 Vol. 26, No.5, Pages 853-1070 Vol. 26, No.5, Pages 853-1070
Pak. J. Pharm. Sci., Vol.26, No.5, September 2013, pp.865-871
871