Chronic Workload Problems in CSIRTs
Johannes Wiik Jose J. Gonzalez Security and Quality in Organizations research cell Faculty of engineering and science University of Agder 4898 Grimstad, Norway
[email protected],
[email protected] Pål I. Davidsen Institute for geography University of Bergen 5020 Bergen, Norway
[email protected] Klaus-Peter Kossakowski Software Engineering Institute Europe Carnegie-Mellon University 60 322 Frankfurt, Germany
[email protected]
1~19
Abstract Since their inception Computer Security Incident Response Teams (CSIRTs) have been afflicted by chronic problems concerning workload, quality of service, and sustaining their constituency. We have cooperated with one of the oldest CSIRTs to model the most challenging issues. Low-priority and high-priority incident response cause distinct problems. Low-priority reports grow exponentially, which overwhelms the limited CISRT resources. For high-priority incident response, one observes long-term instabilities in workload and QoS and, ominously, oscillatory decreasing recognition of the CSIRT by its constituency. In this paper we focus on low-priority incident response, leaving highpriority response for two companion papers. For low-priority response, the CSIRT tends to handle the workload by adjusting the productivity of manually handled incidents, a futile task owing to exponential growth in incidents. A more fundamental solution is automated incident response, but its implementation requires careful planning of timing and resources.
Keywords Information Security, Incident Response, Incident Management, CERT, CSIRT, Risk Management, System Dynamics
Introduction The Internet Worm incident in 1988 was a “watershed” for the organizational defense of information assets (Killcrece et al. 2003, p. 17-19). It led to the creation of the Computer Emergency Response Team (CERT) in Pittsburgh, USA, as a coordination center for incident response and security teams. Similar response teams using the CERT acronym as part of their name followed elsewhere. Another term, viz. Computer Security Incident Response Team or CSIRT, has gradually taken over as canonical name for incident response teams, although as many as ten acronyms for incident handling and response are in use (Killcrece et al. 2003, p. 10ff). In the following we use the generic term Computer Security Incident Response Team (CSIRT) to refer to all kinds of incident response teams, whether they call themselves CSIRTs, CERTs, CSIRCs, etc. Broadly speaking, a CSIRT is a service organization that is responsible to control and minimize any loss, preserve evidence, provide quick and efficient recovery, prevent similar future incidents, and gain insight into cyber threats against its designated constituency. CSIRTs are mostly recognized for their reactive services, but they provide much needed proactive services and security quality management services as well. Reactive services are the core component of CSIRT work; they are triggered by incidents events or requests – those services can be compared to fire-fighting activities. Proactive services target preparation, protection and securing constituent systems. Security quality management services augment existing and well-established services that are independent of incident handling and traditionally performed by other areas of an organization, such as the IT, audit, or training departments. CSIRT services are normally performed for a constituency, often determined by its parent entity (such as a corporation, government, a research network or paid clients) or based on a public service offering for paying customers. According to their organizational model, CSIRTs are classified as Security Team, Internal Distributed CSIRT, Internal Centralized CSIRT, Internal Combined Distributed and Centralized CSIRT or Coordinating CSIRT (Killcrece et al. 2003, §2.2). In the simplest model, the Security Team, available personnel handles security incidents ad hoc as part of their overall responsibilities for any security event. In an Internal Distributed CSIRT the team does not necessarily operate with full dedication to CSIRT tasks and it is scattered across organizational and geographical locations under the coordination and supervision of a manager. In an Internal Centralized CSIRT the team operates in a single organizational and geographical location and it has the entire responsibility for incident handling and response; mostly, all team members have full dedication to CSIRT tasks. In such instances, the CSIRT often has the entire responsibility for incident handling and response. An Internal Combined Distributed and Centralized CSIRT operates as a combination of the distributed CSIRT and
2~19
the centralized CSIRT. The coordinating, centrally located team usually works exclusively with incident handling in the broadest sense, to provide a broader understanding of the security threats and activities affecting the constituency. The distributed team is composed of staff in strategic locations throughout the organization, working with CSIRT activities, not necessarily full time. A Coordinating CSIRT usually has the broadest scope and most diverse constituency among the CSIRT organizational models. It is typically located in a single location, coordinating and facilitating the handling of incidents across a variety of organizations in dispersed locations. Staff of the affected organizations must be available and respond to security incidents upon appropriate reports or alerts coming from the coordinating CSIRT. Examples of constituencies include individual subsidiaries of a corporation; multiple branches of a military organization: branch campuses in an educational organization; institutions in a national research network; specific institutions within a country or state. The types of computer security incidents and attacks, and the methods, tools, and techniques used by intruders have been evolving towards automation and speed: More and more sophisticated attack tools that take advantage of currently available technologies; faster discovery of vulnerabilities; increasing permeability of firewalls; growing asymmetric threat (employing a large number of distributed systems to attack a single victim); and increasing threat from infrastructure attacks. (CERT Coordination Center 2002) In addition, freely downloadable state-of-the-art intruder knowledge and attack toolkits become more and more common (Killcrece et al. 2003, §3.8). There is an increase in number and type of organizations affected by computer security incidents. New laws and regulations appear affecting how organizations must protect information assets. Organizations must increasingly recognize the need for security policies and practices as part of their overall riskmanagement strategies (Calder and Watkins 2008). Further, it is becoming common lore that systems and network administrators alone cannot protect organizational systems and assets. As a consequence, many large organizations have recognized the need to include a CSIRT capability in their multi-layered defense strategy (Killcrece et al. 2003, p. 1; O'Connell 2004). CSIRTs have been afflicted by chronic problems related to workload, quality of service and ability to obtain and sustain funding. Already in 1994 a study concluded that the existing CSIRTs were insufficiently funded, understaffed, and overworked (Smith 1994). A thorough and extensive CERT/CC report on the state of the practice of CSIRTs documented that the problems persisted in most of the now approximately two hundred external coordinating CSIRTs over the world that are active on a global level (Killcrece et al. 2003). The workload in CSIRTs is overwhelming and becoming worse, implying a wide range of internal problems, such as insufficient funding (van Wyk and Forno 2001; Killcrece et al. 2003), along with lack of management support, shortage of trained incident handling staff, poorly defined mission and authority, and lack of coordination mechanisms (Killcrece et al. 2003, §3.11). To the best of our knowledge this basic situation persists – at least, there is no published material that indicates a change for the better. Information available from existing teams indicate no change either. To understand the causes of such chronic problems we have studied one of the oldest coordinating CSIRTs in existence. It is is arguably a paradigm for studying coordinating CSIRTs over a wide range of conditions and to discern long-term behavior patterns owing to its long history and richness of available data. The study is found in a PhD thesis (Wiik 2007) with full details on all stages of modeling the CSIRT case, including verification, validation, testing and policy analysis. The PhD thesis identified three main challenges in the coordinating CSIRT: 1. The workload burden owing to the overwhelming growth in low-priority incident reports. 2. Long-term instabilities in the high-priority incident workload 3. The retainment of a balance between sites reporting from within and from outside the CSIRT members (the “constituency”).
3~19
In contrast to the PhD thesis, where the three problems were expressed in one large model, we opt now to model the challenges separately. This is possible, since the submodel structures in the PhD thesis model are largely decoupled. This procedure results in three relatively short papers that are more accessible to a larger audience. This first paper deals with challenge 1 (the workload burden). The companion papers (Wiik et al. 2009a, 2009b) examine challenge 2 and 3. We have opted to model the three cases with a new objectoriented system dynamic tool Smia, developed by Dynaplan. Owing to its restricted availability, the PhD thesis was allowed to disclose the name of the actual CSIRT and to use the real data series. In contrast, this paper and its companion two papers withhold the CSIRT name and use sanitized data – in accordance with the practice in information security. Datasharing is a common problem in the domain of information security, since incident related data are regarded as extremely sensitive. Instead of praise, organizations that have informed the public about having experienced and solved security problems have suffered negative repercussions, including loosing clients (Schneier 2000). Restrictions abound (Andersen et al. 2004, §1.3 Cyber Data Restrictions). In particular, most CSIRTs have non-disclosure agreements with their clients.
Modeling process At the outset the management of the coordinating CSIRT was asked for assistance to answer the preliminary three research questions related to performance: 1. What factors limit the effectiveness of the incident response service in the coordinating CSIRT? 2. What policies can improve the effectiveness of the incident response service in the coordinating CSIRT? 3. What constitutes effective incident response in the coordinating CSIRT? The management and staff of the coordinating CSIRT contributed with mental, written and numerical information in five face-to-face meetings (Table 1). In addition to the these physical meetings, regular exchanges in the form of emails, phone conversations, etc were conducted, mainly with the management. Point in time September 2004
Duration 3 days
Main modelling activities Meeting with managing director of CSIRT: Problem formulation, conceptualization and formal model building. December 2004 1 day Meeting with managing director and IRT team of CSIRT (4 persons): Data collection, model formulation and testing April 2005 3 days Meeting with managing director and IRT team of CSIRT (4 persons): Model formulation and testing August 2005 4 days Meeting with managing director and IRT team of CSIRT (4 persons): Model formulation, testing and policy evaluation March 2006 4 days Meeting with managing director, IRT team and former employee of CSIRT (5 persons): Model testing and policy evaluation Table 1 Overview of the time spent in face-to-face meetings with managing director and the Incident Response Team (IRT) of the coordinating CSIRT on direct expert model interaction in the modeling process as well as the main activities in each interaction.
The first four meetings were mostly structured around the problems addressed and the information input needed for the system dynamics modeling process. The participants were guided through a prepared questionnaire to inspect model structure as well as review model scenarios. The necessary insight into the system dynamics methodology for the CSIRT management and staff to be able to evaluate and discuss system dynamics models and their behavior were given. Numerous interviews (several per month) via phone and/or email) were conducted in between these face-to-face meetings. All these virtual meetings were driven by modeling/evaluation/remodeling. The 4~19
subjects interviewed varied dependent on the need for information. The most common people to interview were: • • • • •
The managing director (for the overall current picture and the history from 1993-2005, policies) The three-person team in the current IRT group (concerning structure, behavior and policies. Especially with a focus from 1999-2005) One former employee in the IRT group (mainly questions concerning past history before 1999). External people at other CSIRTs to provide an outside view of the CSIRT. Where applicable, all information and assumptions were cross-checked with at least one other person.
The modeling process led to the precise identification of the three main CSIRT problems listed above (p. 3) and to a system dynamics model expresing those problems. The domain experts (the CSIRT management and staff) agreed that the system dynamics model reproduced the empirical behavior of relevant CSIRT data for the right reasons. The causal and stock-and-flow structure made sense to the evaluators. In particular, all model and policy assumptions were based on full consensus in discussions with the expert team. Also the policy behavior of the model was evaluated and approved, unexpected and counterintuitive results being debriefed to render new insights. For details about the meetings and the procedures used for model structure verification, model behavior validation, policy analysis and evaluation of learning from the model process we refer to the PhD thesis (Wiik 2007). In the following section we describe the model for the first salient CSIRT problem, viz. overwhelming growth of low-priority incidents.
Modeling overwhelming growth of low-priority incidents Since 1997 automation of attacks on the internet and the ensuing automation of detection and reporting of such attacks have led to an exponential growth of incidents to handle by CSIRTs: “The sheer number of attacks that are detect and reported continues to rise, with many CSIRTs typically seeing a doubling (or more) in the rate of new incident reports with each passing year” (Killcrece et al. 2003, §3.8.1).
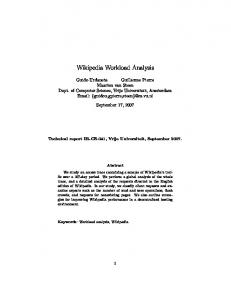
Percent of low priority incidents actually handled
100 %
Fraction of low priority incidents handled (0-100%)
Effort to automation (0-100% of need)
0% Manual productivity is sufficient
Less work pressure releases effort for automation
The manual productivity limit is reached First attempt at developing automation fails due to work overload
An increasing fraction of incidents is handled automatically
The service is gradually discontinued
Figure 1 Idealized reference behavior for our CSIRT case derived from CSIRT time series data and from interviews with CSIRT management and IRT staff
5~19
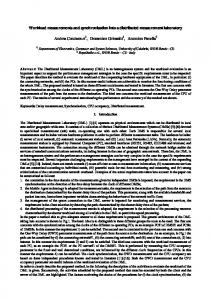
The coordinating CSIRT operated with incident priorities 1-9. For our study, a higher level of aggregation was found useful in order to compare incidents over time and relate this to the overall workload on the incident response staff. Based on a study of the data available and interviews with the current and former members of the Incident Response Team, we experimented with different combinations of incident categories and found two clear patterns: 1. Low-priority incidents, covering priority 8-9, indeed growing over time with an exponential pattern (Wiik 2007) 2. High-priority incidents, covering priority 1-7. Such incidents are much rarer than low-priority incidents. They follow an initial S-shaped behavior with an enguing some decline in the time horizon where data were available Most attacks reported to the coordinating CSIRT are port scans, belonging to the low-priority incident category. Nevertheless, the large volume of such reports represents a significant challenge to CSIRTs (Killcrece et al. 2003, §3.11). Indeed, CSIRT resources are limited – for most CSIRTs they are rather constant over time. Hence, the exponentially growing work volume has a significant impact on a CSIRT over time. In this section we ask what the effect of such growth is on the incident response service in a CSIRT, and how a CSIRT can deal with such an overwhelming growth of low-priority incidents over time. Elsewhere (Wiik 2007; Wiik, Gonzalez, and Kossakowski 2005; Wiik and Kossakowski 2005) we have analyzed a real case with a system dynamics model and shown that the model is able to replicate the empirical behavior for the right reasons. As stated before (p. 4), the discussion in this paper must be based on anonymous, “sanitized” data. Figure 1 is an sanitized version of reference behavior as obtained from the CSIRT data. The system dynamics model has been divided into submodels containing clusters of model variables, allowing to visualize the feedback structure across the different submodels in a policy structure diagram (Figure 2). The submodels, labeled with the symbol next to each submodel name, can be considered organizational subunits, policies or decision rules. At the top level we have two submodels, with explicit stock-and-flow structure, distinguishing between organizational boundaries: 1) The submodel “Incident reporting” representing incident reporting coming (mostly) from the CSIRT constituency as well as other coordinating CSIRTs and 2) the submodel “CSIRT” describing internal processes in the CSIRT. These two submodels are represented with the two square frames labeled accordingly. The “CSIRT” submodel contains five implicit submodels representing various important processes that interact in response to the growing workload: 1) ”Incident handling” 2) ”Resource allocation” 3) ”Productivity improvement” 4) ”Development of automatic handling” 5) ”Resource pressure valve.” The stock-and-flow structure of these “implicit” submodels are separate explicit diagrams (shown in Appendix A). The equations of the model are rendered in Appendix B. Three variables within the incident reporting submodel represent the growth process of low-priority incidents, most notably port scans and spam complaints. The main reasons for this growth can be found in the attack automation, detection and reporting. Automation acts as reinforcing feedback whereby the knowledge derived from past activities is used to improve efficiency through automation/further automation. Also, there is an arms race between attackers and defenders trying to build the most efficient tools, creating reinforcing feedback and, thus, exponential growth in incident reports reaching the CSIRT. This process has been modeled by a feedback loop that includes a stock ‘Rate of automatic incident reports’ (incidents/day) representing the actual capacity used to report detected low-priority incidents and its inflow representing the change in reporting based on the current state of automation. The strength of this feedback process is controlled by an annual growth rate. The growth rate of low-priority incidents has been more than 100 % per year for some CSIRTs (Killcrece et al. 2003, §3.8.1). As incidents are reported, they accumulate. The link from the reporting stock in the “Incident reporting” submodel is a delayed relation between the input variable and variables within the submodel, that is, the influence passes through a stock and flow structure within the submodel “Incident handling.” 6~19
R1: Global growth
R2: Working smarter
B2: Resource compensation B1: Productivity compensation
B3: Fundamental resource allocation
B4: Postponing automation
Figure 2 Policy structure diagram of our CSIRT: The upper frame represents the submodel “Incident reporting” from outside the CSIRT, with a detailed view of the variables within this sector. The lower frame represents the submodel CSIRT containing another level of submodels clustering the main processes interacting in the response to an exponentially growing workload. ’Rate of automatic incident reports’, measuring the number of incidents reported per unit of time, is represented as a stock and it increases with the rate ’Growth of automatic reports’. Links with a zig-zag indicate that the causal link connecting variables in different submodels involves additional variables in the submodel CSIRT that are not explicitly shown.
The CSIRT must compensate for the strongly growing workload driven by the reinforcing feedback “R1: Global growth” with strong balancing feedback processes. The CSIRT can either increase the productivity of incident handling through the balancing feedback loop “B1: Productivity improvement”, or add more resources to the incident handling process controlled by the balancing feedback loop “B2 Resource compensation”. With limited available resources (p. 6) the main feedback loop balancing the growing workload is productivity improvement. Productivity can be increased in various ways (such as making standard answers, creating simple scripts to filter information, clustering incidents to respond more efficiently or by decreasing the time for investigating incidents). To begin with, the increase in workload can be matched by compensating improvements in
7~19
productivity. However, as the growth process gains momentum, it overwhelms the CSIRTs ability to improve over time. Besides, there is a limit to how efficiently an incident report can be handled as long as this is performed manually. As the CSIRT’s incident handling approaches the maximum productivity limit, management is forced to find another solution – automated response to routine (i.e., low-priority) incidents. Even though the quality of service of automated response may not be as good as a manual response, the large volume of reported incidents leaves no other choice if the CSIRT wants to offer response to such incidents. The relation between the submodel “Productivity improvement” and the submodel “Development of automatic handling” represents a non-linear shift whereby tool development is initiated and additional feedback loops start to govern the behavior of the CSIRT. The onset of tool development requires resources, represented as the balancing feedback loop “B3: Fundamental resource allocation.” If management succeeds in developing automatic response, there will be less need for manual resources in incident response, implying free resources for the development and maintenance of the tool. This process is a reinforcing feedback loop “R2: Working smarter”. However, if for some reason the attempt to develop automatic response fails, the very same feedback loop would act against the intention of working smarter – see below. If fewer resources are allocated to tool development, there will be less development and more resources will be needed for manual response, leaving fewer resources for tool development. Developing a tool for automation of the low-priority incident handling process will typically get resources from the already hard pressed manual incident response. At first, the staff will try to do both incident response and tool development according to plan. But incident handlers will hardly prioritize tool development when there are urgent needs for incident response. After all, the incident “fire” occurs today and late or insufficient response may be very damaging to the customers. The resulting pressure will activate the balancing feedback loop “B4: Postponing tool development”. If this loop dominates, it will undermine management’s intentions, the reinforcing loop “R2: Working smarter” acts now as a vicious circle that forces tool development into a death spiral. The failure to automate incident response will create even more difficulties for management. As the compensating feedback processes of manual productivity improvement and resources allocation loose dominance, the continuous growth of low-priority incident reporting will lead to a decrease in the actual fraction of incident handled, typically by staff having to ignore more and more incidents. Over time, the manual service itself becomes less and less useful and the staff will finally stop handling such low-priority incidents. The staff will continue handling high-priority incidents, owing to their importance and that they do not grow uncontrollably such as in the case of the low-priority reports. Nevertheless, high-priority incidents do present problems of their own (Wiik et al. 2009a, 2009b). As the manual low-priority incident response service, in practice, is shut down, tool development can be renewed. Thus, “B4: Postponing tool development” is no longer active, since the short term pressure has been removed by ignoring incidents. Instead “B3: Fundamental resource allocation” is allowed to govern. Thereby the automation tool is developed and gradually introduced. The description above illustrates the main feedback structure governing the base case, representing the behavior actually observed in the case we have studied. To evaluate policies into the future and see trade-offs over time (and long term versus short term effects) conducted simulation runs from 1993 to 2015, that is, 10 years beyond the historical time frame. The results from the base case are shown in the four graphs on Figure 3.
8~19
Figure 3 The base case scenario shows the behavior of some key variables from 1993 to 2015 using the historical policies identified in the case. Further details in main text.
The lower left graph on Figure 3 shows that the exponential growth in incident reporting is matched by manual handling of incidents in the time period 1993-1996. At the end of the period we see in the upper right graph that the actual productivity starts to increase exponentially to compensate for the incident growth. Around 1997 the productivity improvement approaches the maximum productivity that can be achieved using only manual resources. A growing gap between the incident reporting rate and the manual incident handling rate emerges in the lower left graph. The fraction of incidents handled (upper left) starts decreasing. Another reason for the decline is that more resources are allocated to automation development, leaving fewer resources for incident response. However, this allocation quickly levels off as the pressure from incident response leads to a postponement of tool development. During the period 1997-1998 the fraction of incidents handled continues to decrease. Yet another change in service scope takes place as the CSIRT gradually shuts down its manual low-priority incident response service (upper left graph). The CSIRT can again renew its tool development. This time the tool development continues successfully, the tool is launched and a significant fraction of low-priority incidents are handled automatically (upper left). The fraction handled automatically never reaches 100% owing to two reasons: The nature of incidents changes over time, making it almost impossible to automate all incidents; the larger the fraction of existing automation, the more difficult is to further automate the response. The base case raises challenges for CSIRT management. First, the CSIRT achieves automation of lowpriority response after passing through a worse-before-better stage: Is it possible to avoid the temporary decline in incident handling with some clever policy? Can a solution be found if the CSIRT refuses to change service scope or if the postponement loop can be weakened by other means? Second, a newly formed CSIRT would be in a totally different situation in that it can try a different and more proactive path than the CSIRT discussed here. To investigate these issues we run the model with the following what-if scenarios 1. Fixed resource split: The CSIRT separates the workforce into two fixed workgroups instead of using it as a shared resource between tool development and incident response
9~19
2. Only automation: The CSIRT only offers automatic response 3. Maintain manual handling: The CSIRT refuses to change the service scope and only provides manual handling and compare the results with the base case (Figure 4). The first two scenarios were considered viable alternative policies by the CSIRT management and its IRT staff. The last scenario was chosen to illustrate the devastating impacts of such policy.
Figure 4 Comparison of the results from alternative scenarios to the base case. Each scenario has been stored as a separate sub model indicated by the prefixes in the variable names.
Fixed resource split The fixed resources split means that management uses two resources with a fixed split of 50-50 to handle incidents and to develop an automated response. Thereby, all feedback loops involving the submodel “Resource allocation,” that is, the loops B2, B3 and B4 on Figure 2, get deactivated.
10~19
The scenario shows that, at first, the CSIRT handles all incidents by manual response. Within 1-2 years the CSIRT uses a combination of manual and automatic response, bringing the handling fraction close to 100%. As the exponential growth in low-priority incidents overwhelms the capacity for manual handling, the handling fraction drops and stabilizes around 80%. Almost all of these incidents are handled by the scalable automatic response system, while the manual response is negligible in terms of volume. Perhaps the most interesting aspect of this scenario is that it is possible to combine manual incident response and tool development as long as the resources are separated.
Only automation In this scenario the CSIRT only allocates resources for tool development and nothing for manual incident response. At first, the CSIRT is not able to handle any incidents as there are no manual resources available for incident response. However, after 1-2 years about 90% of all incidents will be handled as the automatic system scales to the increasing volume of reports. The main drawback of this scenario, unlike the previous one, is that the CSIRT is not able to handle low-priority incidents in the beginning of the scenario.
Maintain manual handling This scenario may not be the most realistic one but it does show how devastating it can be if management insists on continued low-priority incident response despite complete work overload. The decreasing fraction of incidents handled indicates that CSIRT resources are wasted and that the constituency hardly benefits much from such work. Not included in this scenario is the stress and frustration experience by the staff under pressure, which is – reportedly – very high indeed.
Discussion The model base case suggests that the competition for resources between having to deliver manual incident handling and developing a tool for automated response can frustrate the attempt to achieve a fundamental solution. This phenomenon resembles patterns observed in process improvement and learning programs (see Repenning and Sterman 2001, and references therein). The various scenarios all show that sooner or later the CSIRT will meet capacity constraints for lowpriority incident handling, as long as: 1. The workload is growing exponentially outside the control of the CSIRT 2. The service is provided with manual resources 3. The manual resources cannot grow exponentially at the same rate as the workload These conditions apply for our CSIRT case – and most likely for any other CSIRT. This leaves the CSIRT with two long-term options concerning the service scope of low-priority incidents: 1. Do not offer the service 2. Automate the process. Since the information about low-priority incidents often provides symptomatic information of more serious incidents, we would argue that best option will be to automate the process. The different scenarios suggest different solutions depending on the operational situation of the CSIRT. The base case demonstrated one unsuccessful attempt for the CSIRT to automate the process. This particular example is probably most applicable to a CSIRT that is already offering the lowpriority service and is facing a complete work overload. In addition, we assume that the workforce cannot be split into a group handling low-priority incidents and another group developing a tool for automatic incident response. Typically, resources will also be spent on high-priority incidents and, if management cannot find budget for additional resources, there would be no other option than to temporarily discontinue the service until an automated system can be put in place. This indicates a worse-before-better solution to escape the resource pressure.
11~19
The fixed-resources split is crucial to avoid short term pressure on long term efforts (tool development). This would be a combined scenario where a CSIRT may offer a full or limited lowpriority service depending on the incident volume reported, while at the same time developing a tool for automation. If management is able to separate the resources, i.e., that the same people are not responsible for different tasks, for example by hiring a specialized developer, then this alternative might be a good solution. A newly established CSIRT may have more options than a CSIRT with a history described by our base case scenario. For example, a newly established CSIRT may prioritize automation of low-incident response as a first step before offering the service to its constituency. The CSIRT can thereby create a scalable solution and avoid the devastating resource competition seen in the base case. With increasing automation of reporting within the CSIRT community this option may be the best for a new CSIRT. But the main lesson of the base case, that ongoing support to keep the automation effective needs to be ensured, applies in this case as well as soon as the initial development effort has ended. The last scenario is probably not the most realistic one, but it indicates strongly how useless it might be to insist on offering the service when the CSIRT becomes overloaded. While our model focuses on the problems of a single CSIRT, there might be a more global aspect to the problem as well. If the CSIRT is able to automate the response to low-priority incidents, it might cause information overload in other sites. Future studies should investigate the global aspects of automation and exchange of incident information between sites and CSIRTs.
Impact on CSIRT management Based on the results of the PhD work, the management of the CSIRT had a documented and well understood model to work on. Together with the IRT staff the implications were discussed and approaches for the future formulated. While management was clearly pointing out the need for automation, the IRT staff was hesitant for other reasons not framed in the model. There was an inherent distrust of automation – or to put it the other way round – the importance of not sending out false information. In the end automation was introduced with some quality control components introduced and supported by tools. In fact, experience has shown that by developing a web portal which handles push as well as pull services to get incident reports to the constituents, the IRT staff are no longer involved in identifying the right point of contact, searching for the right encryption key or editing another email. So, while still leaving room for more automation, the most boring and tiresome parts were already taken away from the IRT staff, and as the web portal progresses and development resources are no longer needed for it, they will help to automate more and more subprocesses. Management expects that after some while – given that no major problem occurs due to bad software design – the inherent skepticism will vanish. But the success of the overall recommendation is obvious. In fact, as the CSIRT had to establish a new, PKI-related, service around the time the first results became available, the distinction of development tasks to allow scalable solutions and service handling was defined right from the beginning. This decision has proven to allow a smooth service delivery with a fixed size staff size allowing for a S-size shape of the always growing customer numbers. Without the strict adherence to automate what could be done, this would not have been achieved.
References Andersen, David F., Dawn M. Cappelli, Jose J. Gonzalez, Mohammad Mojtahedzadeh, Andrew P. Moore, Eliot Rich, Jose Mari Sarriegi, Timothy J. Shimeall, Jeffrey M. Stanton, Elise Weaver, and Aldo Zagonel. 2004. Preliminary System Dynamics Maps of the Insider Cyber-threat Problem. Paper read at Twenty second International Conference of the System Dynamics Society, at Oxford, UK. Calder, Alan , and Steve Watkins. 2008. IT Governance: A Manager's Guide to Data Security and ISO 27001/ISO27002. 3 ed. London: Kogan Page Ltd. CERT Coordination Center. 2007. Overview of Attack Trends 2002 [cited 12 December 2007]. Available from http://www.cert.org/archive/pdf/attack_trends.pdf.
12~19
Killcrece, Georgia, Klaus-Peter Kossakowski, Robin Ruefle, and Mark Zajicek. 2003. State of the Practice of Computer Security Incident Response Teams (CSIRTs). Pittsburgh, PA, USA: CMU/SEI. O'Connell, Brian. 2004. Getting CERT'ified: Teams thwart viruses. Bank Technology News, September, p. 1314. Schneier, Bruce. 2000. Secrets and Lies: Digital Security in a Networked World. New York: John Wiley & Sons, Inc. Smith, Danny. 1994. Forming an Incident Response Team. Paper read at FIRST Annual Conference, at University of Queensland, Brisbane, Australia. van Wyk, Kenneth R., and Richard Forno. 2001. Incident Response. Sebastopol, CA, USA: O'Reilly and Associates Inc. Wiik, Johannes. 2007. Dynamics of Incident Response Effectiveness -- A System Dynamics Approach, University of Bergen, Bergen. Wiik, Johannes, Jose J Gonzalez, Pål I Davidsen, and Klaus-Peter Kossakowski. 2009a. Persistent instabilities in the high-priority incident workload Computer Security Incident Response Teams. Paper read at Twenty Seventh International Conference of the System Dynamics Society July, at Albuquerque, NM, USA. ———. 2009b. Preserving a balanced CSIRT constituency. Paper read at Twenty Seventh International Conference of the System Dynamics Society July, at Albuquerque, NM, USA. Wiik, Johannes, Jose J. Gonzalez, and Klaus-Peter Kossakowski. 2005. Limits to effectiveness of Computer Security Incident Response Teams (CSIRTs). Paper read at Twenty Third International Conference of the System Dynamics Society, 17-21 July 2005, at Boston, MA. Wiik, Johannes, and Klaus-Peter Kossakowski. 2005. Dynamics of CSIRT Management. Paper read at Seventeenth Annual FIRST Conference on Computer Security Incident Handling, June 26-July 01, 2005, at Singapore.
13~19
Appendix A – Submodels Incident Handling submodel
Resource Allocation submodel
14~19
Productivity Improvement submodel
Resource Pressure Valve submodel
15~19
Development of Automatic Handling Submodel
Appendix B – Model equations vendor dynaplan product smia version 4 language enGB def { submodel model { unit '%/person/year' = %/person/yr submodel 'Incident reporting' { var 'Annual growth rate' = 120 %/yr var 'Growth of automatic reports' = flow
'Rate of automatic incident reports'*'Annual
growth rate' 'Rate of automatic incident reports' = stock 1 incident/dy inflow 'Growth of automatic reports'
var
} unit 'incident/person/day' = incident/person/dy unit 'time units' = mth submodel CSIRT { submodel 'Development of automatic handling' { var 'Autmation sensitivity lower limit' = 0.5 var 'Automation sensitivity upper limit' = 1.0 var 'Average annual loss of capacity' = 10%/yr var 'Building capacity' = flow CSIRT.'Resource
allocation'.'Resources allocated to automation development'*'Productivity tool development'*'Potential capacity remaining' var 'Capacity for automatic handling' = stock 0% outflow 'Degrading capacity' inflow 'Building capacity'
16~19
'Degrading capacity' = flow 'Capacity for automatic handling'*'Average annual loss of capacity' var 'Effect of productivity exhaustion on tool development' = 'lookup linear'('Fraction of productivity potential remaining','Table for effect of productivity exhaustion',false) var 'Estimated resources needed for tool development' = 'Effect of productivity exhaustion on tool development'* _ ('Maximum capacity'/'Productivity tool development'/'Estimated time to develop full automation') var 'Estimated time to develop full automation' = 1 yr var 'Fraction of automatic reports handled automatically' = 'lookup linear'('Capacity for automatic handling','Table capacity',false) as% var 'Maximum capacity' = 100% var 'Policy tool development' = true var 'Potential capacity remaining' = 'Maximum capacity'-'Capacity for automatic handling' var 'Productivity tool development' = 100%/person/yr var 'Table capacity' = {i=0.5 to 1 step 0.5|0.0,1.0} var 'Table for effect of productivity exhaustion' = {i='Automation sensitivity lower limit' to 'Automation sensitivity upper limit' step 'Automation sensitivity upper limit'-'Autmation sensitivity lower limit'|0.0,1.0}
var
} submodel 'Incident handling' { var 'Actual fraction possible to
handle' = min(Capacity/'Incident reporting'.'Rate of automatic incident reports',100%) var 'Capacity sensitivity lower limit' = 0.3 var 'Capacity sensitivity upper limit' = 0.9 var 'Desired manual handling rate' = 'Incidents pending'/'Desired response time' var 'Desired resources needed for manual handling' = 'Desired manual handling rate'/CSIRT.'Productivity improvement'.'Actual productivity' var 'Desired response time' = 28 dy var 'Effect of capacity overwhelming on acceptance of reports' = 'lookup linear'('Perceived fraction possible to handle'.'smooth output','Table capacity sensitivity',false) as% var 'Fraction of incidents handled' = ( 'Rate of handling incidents manually'+'Rate of handling incidents automatically')/'Incident reporting'.'Rate of automatic incident reports' as % var 'Incidents pending' = stock 0 incidents inflow 'Rate of accepting incidents manually' outflow 'Rate of handling incidents manually' component 'Perceived fraction possible to handle' = clone smooth component 'Perceived fraction possible to handle' { var 'smooth delay time' = in:2 'Time to perceive fraction possible to handle' var 'smooth initial output' = optional in:3 100 % var 'smooth input' = in:1 'Actual fraction possible to handle' } var 'Policy manual handling' = true var 'Rate of accepting incidents manually' = flow ('Incident reporting'.'Rate of automatic incident reports'-'Rate of handling incidents automatically') _ *if('Policy manual handling','Effect of capacity overwhelming on acceptance of reports',100%)
17~19
'Rate of handling incidents automatically' = 'Incident reporting'.'Rate of automatic incident reports'*CSIRT.'Development of automatic handling'.'Fraction of automatic reports handled automatically' var 'Rate of handling incidents manually' = flow min('Desired manual handling rate',Capacity) var 'Table capacity sensitivity' = {i='Capacity sensitivity lower limit' to 'Capacity sensitivity upper limit' step 'Capacity sensitivity upper limit'-'Capacity sensitivity lower limit' | 0.0 ,1.0 } var 'Time to perceive fraction possible to handle' = 3 mth var Capacity = CSIRT.'Resource allocation'.'Resources allocated to incident response'*CSIRT.'Productivity improvement'.'Actual productivity'
var
} submodel 'Productivity improvement' { var 'Actual productivity' = stock 5
incidents/person/dy inflow 'Changing productivity' var 'Changing productivity' = flow max((1- 'Fraction of productivity potential remaining')* _ ('Desired productivity'-'Actual productivity')/'Time to change productivity',0 incidents/dy/person/mth) var 'Desired productivity' = ('Desired manual handling rate'divz0 CSIRT.'Resource allocation'.'Resources allocated to incident response')*(100%+'Extra marging productivity needed') var 'Extra marging productivity needed' = 10% var 'Fraction of productivity potential remaining' = 'Actual productivity'/'Maximum handling capability' as % var 'Maximum handling capability' = 70 incidents/person/dy var 'Time to change productivity' = 3 mth
} submodel 'Resource allocation' { var 'Desired resources for tool
development' = min(CSIRT.'Development of automatic handling'.'Estimated resources needed for tool development',CSIRT.'Development of automatic handling'.'Estimated resources needed for tool development'-CSIRT.'Resource pressure valve'.'Pressure to change resources allocation') var 'Fraction of resources to incident response' = 50% var 'Policy resource split' = false var 'Resources allocated to automation development' = if('Policy resource split', _ 'Total staff'*(1-'Fraction of resources to incident response'), _ 'Total staff'*'Desired resources for tool development'divz0'Total resources desired') var 'Resources allocated to incident response' = if('Policy resource split', _ 'Total staff'*'Fraction of resources to incident response', _ 'Total staff'*'Desired resources needed for manual handling'divz0'Total resources desired') var 'Total resource slack' = 'Total staff'-'Total resources desired' var 'Total resources desired' = 'Desired resources needed for manual handling'+'Desired resources for tool development' var 'Total staff' = 2 person
} submodel 'Resource pressure valve'
{
18~19
'Desired realloaction of tool development resources' = max(-'Total resource slack'+'Pressure to change resources allocation',0 persons) var 'Indicated reallocation of tool development resources' = min('Desired realloaction of tool development resources',CSIRT.'Development of automatic handling'.'Estimated resources needed for tool development') var 'Pressure to change resources allocation' = stock 0 persons inflow 'Rate of changing pressure' var 'Rate of changing pressure' = ('Indicated reallocation of tool development resources'-'Pressure to change resources allocation')/'Time to build pressure' var 'Time to build pressure' = 4 mth
var
} } unit fraction = 1.0 submodel globals { var 'exchange rate'&exchrate = {r ≤ text|"EUR" =>1} var 'game step' = 'time step' var 'report step' = 'time step' type 'role list' = [ ] var 'start future' = 'start time' type horizon = date(1993,Jan) to date(2015,Dec) step 1
mth
} component smooth = template original component smooth { var 'smooth change' = flow ('smooth input'-'smooth output')/'smooth delay time' var 'smooth delay time' = in:2 'time step' var 'smooth initial output' = optional in:3 'smooth input' var 'smooth input' = in:1 1.0 var 'smooth output' = return stock 'smooth initial output' inflow 'smooth change'
} } }
19~19