Department of Computer Science, Virginia Tech,. Blacksburg, VA ... The Computing and Information Technology Interactive Digital Educational Library. (CITIDEL ...
Citiviz: A Visual User Interface to the CITIDEL System Nithiwat Kampanya, Rao Shen, Seonho Kim, Chris North, Edward A. Fox Department of Computer Science, Virginia Tech, Blacksburg, VA 24061 USA {nkampany, rshen, shk, north, fox}@vt.edu
Abstract. The Digital Library (DL) field is one of the most promising areas of application for information visualization technology. In this paper, we propose a visual user interface tool kit for digital libraries, to deliver an overview of document sets, with support for interactive direct manipulation. Our system, Citiviz, employs a dynamic hyperbolic tree to display hierarchical relationships among documents, based on where their topics fit into the ACM classification system. Also, Citiviz provides an interactive, animated 2-dimensional scatter plot. With it, users may gain insight by changing various parameters, or may directly jump to a particular document based on its label or location. According to a preliminary evaluation, our system shows advantages in performance and user preference relative to traditional text based DL web interfaces.
1 Introduction The Computing and Information Technology Interactive Digital Educational Library (CITIDEL, http://www.citidel.org), part of the NSDL (National Science Digital Library, http://www.nsdl.org), uses OAI-PMH (the Open Archives Initiative Protocol for Metadata Harvesting) to harvest resource metadata from its member collections. Those member collections are other digital libraries (DLs) that share their resources with CITIDEL, which provides integrated browsing and searching services. Users can browse separately through each member collection, or can browse through the union collection using any of four different classification schemes. Nevertheless, the primary means to access CITIDEL is through searching. Unfortunately, if users are unfamiliar with the topic of their search, or lack experience regarding search tactics, relevant documents may only appear frustratingly far down in a ranked list of search results. Fortunately, visual interfaces to DLs apply powerful data analysis and information visualization techniques to generate visualizations of document collections in DLs, with possible beneficial effect on browsing and searching. Thus, we have integrated text mining and information visualization to develop a visual interface to CITIDEL. Visualization techniques of one broad category consider predefined document attributes, such as author or date, and query relevance. One example is the Envision interface [14, 22]. It can organize search results according to metadata along the X and Y-axes, and show values for attributes associated with retrieved documents
within each cell. However, the view provided by the original version of the Envision interface gave few cues about how the documents are related to each other in terms of their content and meaning. Visualization techniques of another category do not make assumptions regarding document attributes. They automatically derive a collection overview through unsupervised learning, which usually is based on inter-document similarities. Scatter/Gather [3, 7] is such a system that applied document clustering approaches to browsing and searching. However, the representation of document clusters by Scatter/Gather is textual, not graphical. Reflecting upon the above two different types of visualization techniques has led us to the following research questions: 1. How should we combine the two different types of visualization techniques to develop a visual interface to CITIDEL for post-retrieval analysis? 2. What text mining technology should we use to explore the inter-document similarities for online document collections that are dynamically created, such as the set of retrieved documents from a search engine? 3. What are the insights supported, and how are they supported? 4. What interaction and navigation strategies should we use to facilitate visual browsing and analysis? To address the above questions, we 1. Developed clustering components to discovery document relationships and to identify subject categories for retrieved documents. 2. Developed a visual interface, called Citiviz (http://feathers.dlib.vt.edu/ CitiViz/), for post-retrieval analysis, initially for CITIDEL, following the guiding principles of Resnikoff [18] and Shneiderman [20]. Resnikoff observed that the human eye and other biological systems process the vast amounts of information available in the real world by smoothly integrating a focused view, for details, with a general view, for context. Shneiderman advocated an interaction model in which the user begins with an overview of the information to be worked with, then pans and zooms to find areas of potential interest, and then views details. The followings are interaction and navigation methods we implemented. Use aggregation by document clustering as an overview strategy. Use the “focus + content” (fisheye) scheme to visualize a hierarchical graph of a concept map representing subject categories of retrieved documents. Combine tree graphs with scatter plot graphs. Documents attached to nodes of a tree graph can be visualized in a 2D space. Integrate a 2D scatter plot graph with a network of citations. Documents of selected clusters are scatter plotted in a 2D space and connected by citation relationships. Apply the aggregate towers technique [16] to solve occlusion problems of documents visualized in the scatter plot graph.
2 Related Works Visual interfaces to DLs apply powerful data analysis and information visualization techniques to manage document collections in DLs. They exploit human vision and spatial cognition to help humans mentally organize and electronically access and manage large, complex information spaces [1]. They have common usage scenarios supporting searching and browsing for DLs. Further, visualization of search results has much in common with gaining an overview of the coverage of a DL to facilitate browsing. Both enable the user to become oriented, and to find relevant information. They differ mainly in two respects. First is the origin of the document sets (a preexisting static collection, or result set dynamically retrieved from a search engine). Second is the information available that relates documents to user information needs. Thus, first, we consider visualization based on predefined document attributes such as author or date, along with query relevance. In Section 1 we discussed Envision [14, 22]. Here we broaden the discussion to include semantic information. Cougar [5] and Cat-a-Cone [6] display semantic information (categories assigned to each document) to users. Categories also can be visualized as a Hyperbolic tree [12] or a SpaceTree [15] as well as through a traditional node-link representation of a tree. Cat-a-Cone used ConeTree [19] to display the category labels of the documents retrieved, while the retrieved documents are organized as pages in a WebBook [2]. Another example is Map.net (http://map.net/start). It provides hierarchical (multilevel/categorical) information maps for browsing over two million Web sites from the Open Directory Project (http://dmoz.com). Rather than using conventional search engine technology to navigate the Web, it creates a landscape that spatially represents data relationships, though in a very abstract, geometric fashion. Size and position of areas on the map indicate number of documents in respective categories and mutual relations between them. Users of this kind of interface gain an immediate overview of available categories and the number of documents these categories contain. Document-query relevance was visualized in TileBars [4] and VIBE [11]. TileBars showed how query terms appear within individual documents, while VIBE displayed an overview of the retrieved documents according to which subset of query terms they contain. Often there are more than two predefined document attributes. Visualizing multiattribute sets can be seen as visualizing multidimensional data sets. Techniques for visualizing multidimensional data include pixel-oriented, geometric projection, iconbase, hierarchical, and graph-based techniques [9]. The basic idea of pixel-oriented techniques is to map each data item to a colored pixel, while icon-based techniques map each data item to an icon. A well-known representative of hierarchical techniques is Treemaps [8]. Graph-based techniques effectively present a large graph using specific layout algorithms, query languages, and abstraction techniques. Visualization techniques in the second category introduced at the start of this section do not make assumptions regarding document attributes. They automatically derive a collection overview via the use of text mining, often through document clustering or neural networks. Examples are Scatter/Gather [3, 7]. Grouper[24-26], Galaxy of News [17], Vivisimo (http://vivisimo.com), Kartoo (http://kartoo.com), Highlight (http://highlight.njit.edu/technology.htm), SOM [10, 13], ThemeScapes [23], and Mooter (http://mooter.com:8080/moot).
Occlusion is one of the important issues in information visualization. The Envision system [14, 22] solves this problem by using a flexible table that resizes its cells appropriately. On the other hand, the aggregate tower technique [16] avoids occlusion of objects by stacking objects together, creating towers of objects. Grouper was a dynamic clustering interface to web search results. It introduced the Suffix Tree Clustering (STC) algorithm. Vivisimo is a web search clustering interface. Its algorithm is based on an old artificial intelligence idea: a good cluster or document grouping is one that possesses a good, readable description. Kartoo is a web interface organizing search results retrieved from relevant web search engines by topics that displays them on a 2-dimensional map. Theoretically, Kartoo provides a node-link graph. A document (Web page) node is presented by a ball. The size of the ball corresponds to the relevance of the document to the query. Links are labeled with sets of keywords shared by related documents. Another example of visualization techniques of this category is self-organizing map (SOM). SOM is a neural network algorithm that takes a set of high-dimensional data and maps them onto nodes in a 2D grid. Shifting to 3D, the ThemeScapes view imposes a three-dimensional representation on the results of clustering. The layout makes use of “negative space” to help emphasize the areas of concentration where the clusters occur. Combining visualization with text mining could lead to novel discovery tools [21] Examples are commercial tools such as SAS JMP (http://www.sas.com), Spotfire (http://www.spotfire.com), and SPSS Diamond (http://www.spss.com).
3 System Design To address the research questions raised in Section 1, and building upon related work (Section 2) and our prior work with CITIDEL and Envision, we have developed Citiviz, according to a component based design. Communication between components is XML based. There are three types of components. They are Data Source Components, Clustering Component, and Visualizing Component. The first two were implemented and then wrapped into Java servlets to enable web access. The Visualizing Components, also implemented in Java, communicate with those servlets in XML. 3.1 Data Source Components Data Source Components send queries to CITIDEL or other DLs, and parse the retrieved HTML pages into XML files, conforming to XML schemas we developed. Those XML files are then transmitted to the Clustering Components for processing. 3.2 Clustering Component Clustering Components are implementations of different document clustering algorithms. We developed a new clustering component to supplement the clustering components of Carrot2 [26] that have been incorporated into our system.
3.3 Visualizing Component or Citiviz Citiviz applies two major visualizing techniques -- a hyperbolic tree of a hierarchical concept map and a 2D scatter-plot graph. The initial interface is shown in Figure 1.
Fig. 1. Initial Interface of Citiviz
The top right of the screen is a hyperbolic tree based on the ACM Computing Classification System (1998 Version, CCS1998, http://www.acm.org/class/1998/). On the top left is a query box. By default, a user will retrieve results from a member DL (e.g., “ACM DL”) of CITIDEL. A user also has an option to retrieve results from all CITIDEL member DLs. In the middle right of the screen, there is a 2D scatter-plot. At the bottom right, there are fields for details of the attributes of a selected document. Citiviz supports exploring to gain insights, as is illustrated in the following three example scenarios. Examples of Insights Sought 1. How are the retrieved documents clustered according to the ACM Computing Classification System? 2. How are the retrieved documents clustered according to inter-document similarity? 3. Which cluster has the largest portion of the document collection? 4. To what category does the 1st ranked document belong? 5. Which document is cited most among the selected clusters of documents? 6. Which documents cite a selected document? 7. What’s the most recently published paper by a particular author? 8. To what topics does a document belong?
Scenario 1: Show me the retrieved results from ACM DL. A user inputs query “Information Visualization”. By default, Citiviz provides retrieved results from the CITIDEL member DL named “ACM DL”. A hierarchical concept map organized according to the ACM Computing Classification System then is displayed as a hyperbolic tree on the top right of the screen. The node name represents a category, and a bubble attached to a node represents a document collection belonging to that category. The size of a bubble attached to a node indicates the size of the document collection clustered in that category. The hyperbolic tree supports “focus + context” navigation. After the user clicks “Show all data in the scatter plot” button, all the retrieved documents from ACM DL are scatter plotted in the 2D space as shown in Figure 2.
Fig. 2. Visual Results of Scenario 1
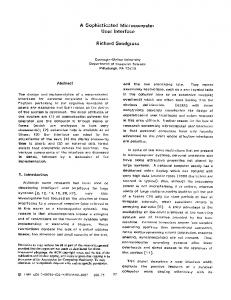
Fig. 3. Towers of documents Each document is visually mapped to a tower of cylinders (see Figure 3). Each level of a tower represents a cluster to which a document belongs. The taller a tower is, the more categories the document belongs to. Moreover, clicking on a tower allows users
to see detailed information for the selected tower, as shown in the bottom of the screen. (See Figure 2 and Figure 4.). On the left of the screen, there is a list of colored bars representing the categories that those retrieved documents belong to. Clicking on a bar allows users to see a list of documents belonging to the cluster represented by the clicked bar. Moving the mouse over a bar invokes an animation of blinking towers in the 2D scatter plot space. Those blinking towers represent documents belonging to the category visually mapped to a colored bar selected with the mouse. Towers in the 2D space can be arranged according to attributes of rank, date, and citations. The colors of the levels of a tower correspond to those categories to which a document belongs. A user can change the color of a bar to distinguish different categories. The color of a bar, the color of its corresponding level in all towers, and the color of its corresponding node in the hyperbolic tree are always synchronized.
Fig. 4. Detailed information for selected document
Scenario 2: Show me papers related to “Algorithm analysis” and published by “Donald Knuth”, from CITIDEL. A user inputs query “Donald Knuth”. She selects option “Search for all collections”. The retrieved results from CITIDEL then are clustered, using suitable components. After the clustering, results are displayed as a hyperbolic tree. She navigates the hyperbolic tree and finds that a category named “Algorithm” is of interest. She then clicks the purple bubble attached to that interesting category. This cause all the five documents belonging to this cluster to be plotted as five purple, 1-level towers in the 2D scatter plot space as shown in Figure 5(a). She continues browsing the hyperbolic tree and finds another interesting category named “Analysis”. She clicks the magenta bubble attached to the category named “Analysis”. This new category contains nine documents. Since there exist two papers that belong to both “Algorithm” and “Analysis” categories, the interface shows seven 1-level magenta towers and two 2story towers consisting one purple story and one magenta level as shown in Figure 5(b), instead of adding nine new 1-level towers into the scatter plot. Scenario 3: Show me all papers related to “Data Compression” that are cited by this paper. A user inputs query “Data Compression”. By default, she gets retrieved results from the CITIDEL member DL “ACM DL”. After she clicks “Show all data in the scatter plot”, all the retrieved documents from ACM DL are scatter plotted in the 2D space. When she clicks a tower representing the document with title “Data Compression”, citation links pointing to other towers are dynamically displayed on demand as shown in Figure 6. A link connecting two towers indicates a citation relationship between the two papers. That is, a pointed to paper is cited by a pointing paper. She then follows the link to get detailed information for the cited papers.
Fig. 5. a) Top, a 1-level document is selected. b) Bottom, where results for two categories are shown, the document selected has 2 levels.
4 Evaluation To evaluate the interface, we conducted a small usability study to suggest further improvements and determine whether or not the combination of the hyperbolic tree and the scatter plot helps users find a document easier and faster than using traditional,
web-based interfaces. Four Computer Science graduate students participated in this evaluation. The test consists of three sections. Each section was designed to measure different tools: Citiviz using ACM classification, Citiviz using Citiviz clustering component, and CITIDEL (www.citidel.org). In each section, participants were asked to complete four tasks. The tasks were designed such that they could be completed using any of the tools. During the test session, the order of tool use was permuted to avoid bias. The participants were asked to perform each of the following tasks: 1. Given an author and a topic, find a document published by that author and belonging to that topic. 2. Given an author and a publication year, find a document published by that author and in that year. 3. Given a title, find a document having that title. 4. Find the most recently published paper. The results of the study are summarized in Figure 7. From the study, there is no significant difference between Citiviz (ACM classification) and Citiviz (Citiviz clustering) when users browse search results for a paper based on topic or title information (tasks 1 and 3). However, Citiviz (Citiviz clustering) helps users find a document faster than Citiviz (ACM classification) when users browse search result for a paper based on publication date (tasks 2 and 4). Based on our observations, the reason that users perform tasks faster when using Citiviz (Citiviz clustering) is that several users were confused by the concept of aggregate tower. As a result, it might be more difficult for users to identify documents in Citiviz (ACM classification), where documents usually are in towers consisting of several levels. In contrast to Citiviz using the ACM classification scheme, documents visualized using Citiviz’s clustering component usually have one level. Thus, it is relatively easy for users to identify the publication date of a document. Unsurprisingly, Citiviz helps users find a document faster than CITIDEL, when users browse search results for a paper based on topic and publication date (tasks 1, 2, and 4). Citiviz is designed to visualize topic and publication date information graphically by using a hyperbolic tree and a scatter plot. These features allow users to gain more insight about document relationships based on topic and publication date information. In contrast, CITIDEL displays this information textually and individually. Users cannot see quickly the relationships among documents. However, CITIDEL helps users find a document faster than Citiviz when users browse search result for a paper based on title (task 3) because, in contrast to Citiviz, CITIDEL displays search result as a list of titles. As a result, finding a paper with a certain title is quite easy in CITIDEL. Accordingly, in a future version of Citiviz, we will add features to better support this type of task. After users completed all tasks, they were asked to fill out questionnaires. It appears users believe that Citiviz is easy to use and helps them find documents easier and faster than would a traditional tool. Users also think the scatter plot and the hyperbolic tree are helpful, although some users think that the hyperbolic tree for the ACM classification scheme is too big and too complex. The hyperbolic tree of the ACM classification scheme usually has three levels (depth-oriented). If users know the exact topic, it is still difficult to locate the topic in
the hyperbolic tree. Unlike Citiviz using ACM classification scheme, the hyperbolic tree of Citiviz clustering component usually has one level (breadth-oriented). If users know the exact topic, it is easy to locate the topic in the hyperbolic tree and to find the document.
Fig. 6. Scatter Plot shows Citations.
Time measured (second)
Average Times on Tasks
150 120 90 60 30 0 Task 1: Given an author and a topic, find the document.
Task 2: Given an author and a publication year, find the document.
Task 3: Given a title, find the document.
Task 4: Find the most recent published paper.
Task Citiviz - ACM Classification
Citiviz - Citiviz Clustering
Fig. 7. The results of the user study
Citidel.org
5 Conclusion The result of our work is a DL visual interface tool kit combining text mining and information visualization. It uses a 2D scatter plot to visualize document attributes (e.g., rank, date) as did Envision [17, 25]. Unlike Envision, the 2D scatter plot space also integrates a network of citations to show the document relationships. A further difference of our work from Envision is that we integrate document clustering and information visualization to show the insight of similarity among documents as well as predefined document attributes. Though some approaches such as ThemeScapes [27] show the inter-document similarities, they display data in a completely flexible manner and do not provide an overview of document attributes. The visual interface provides overviews of retrieved results from CITIDEL. The overview strategy of aggregation by document clustering provides users insights of how similar documents are clustered. The overview of a hierarchical concept map displayed as a hyperbolic tree supports “focus + context” navigation. “Focus + context” navigation provides direct manipulation and high interaction, and therefore a balance of local detail and global context. The overview of document attributes such as query relevance shown in the 2D scatter plot space allows users to understand why a document is retrieved. Integrating the 2D scatter plot space with a network of citations shows users document citation relationships. All these address the last two questions mentioned in Section 1. The componentized and XML based architecture of our project makes the tool kit reusable for different DLs. The Data Source Component we developed provides a data source from CITIDEL, which serves as a portal to its member DLs such as the ACM DL. So, in addition to being a visual interface to CITIDEL, the result of our project is also to provide a visual interface to its member DLs. Connecting our tool kit to another different DL can be completed easily by implementing a Data Source Component for that DL. Accordingly, after some small improvements identified in this study are made to Citiviz, we plan to deploy it for larger scale testing with CITIDEL, CITIDEL-member DLs, and other DLs such as NDLTD (www.ndltd.org).
6 References 1. Börner, K. and Chen, C. Visual Interfaces to Digital Libraries. Springer, 2002. 2. Card, S.K., G.G., R. and York, W., The WebBook and the WebForager: an Information Workspace for the World Wide Web. in Proceedings of ACM Human Factors in Computing Systems Conference (CHI'96), (1996), 111-117. 3. Cutting, D., Karger, D., Pedersen, J. and Tukey, J., Scatter/Gather: A Clusterbased Approach to Browsing Large Document Collections. in Proceedings of the 15th Annual International ACM/SIGIR Conference, (1992), 318-329. 4. Hearst, M.A., TileBars: Visualization of Term Distribution Information in Full Text Information Access. in Proc. of the ACM SIGCHI Conference on Human Factors in Computing Systems, (1995), 59-66. 5. Hearst, M.A., Using Categories to Provide Context for Full-text Retrieval Results. in Proceedings of the RIAO’94, (1994).
6. Hearst, M.A. and C., K., Cat-a-Cone: An Interface for Specifying Searches and Viewing Retrieval Results Using a Large Category Hierarchy. in Proceedings of the 20th International ACM SIGIR Conference on Research and Development in Information Retrieval (SIGIR’97), (1997). 7. Hearst, M.A. and Pedersen, J.O., Reexamining the Cluster Hypothesis: Scatter/Gather on Retrieval Results. in Proceedings of the 19th International ACM SIGIR Conference on Research and Development in Information Retrieval (SIGIR’96), (1996), 76-84. 8. Johnson, B. and Shneiderman, B., Treemaps: A Space-filling Approach to the Visualization of Hierarchical Information Structures. in Proc. of the 2nd International IEEE Visualization Conference, (San Diego, USA, 1991), 284-291. 9. Keim, D.A. and Kriegel, H.-P. Visualization Techniques for Mining Large Databsaes: A Comparison. IEEE Transactions on Knowledge and Data Engineering, 8. 923-938. 10. Kohonen, T., Exploration of Very Large Databases by Self-organizing Maps. in Proceedings of the IEEE International Conference on Neural Networks, (1997), 1-6. 11. Korfhage, R.R., To See or Not to See - Is That the Query? in Proc. of the 14th Annual Int. ACM SIGIR Conference, (Chicago, USA, 1991). 12. Lamping, J. and Rao, R., Laying Out and Visualizing Large Trees Using a Hyperbolic Space. in Proceedings of the ACM Symposium on User Interface Software and Technology, (1994), 13-14. 13. Lin, X., Visualization for the Document Space. in IEEE Vis, (1992). 14. Nowell, L.T. Graphical Encoding for Information Visualization: Using Icon Color, Shape, and Size To Convey Nominal and Quantitative Data computer science, Virginia Tech, Blacksburg, (1997), 84. 15. Plaisant, C., Grosjean, J. and Bederson, B.B., SpaceTree: Supporting Exploration in Large Node Link Tree, Design Evolution and Empirical Evaluation. in INFOVIS 2002. IEEE Symposium on Information Visualization, 2002, (2002), 57 -64. 16. Rayson, J.K. Aggregate Towers: Scale Sensitive Visualization and Decluttering of Geospatial Data. Information Visualization, INFOVIS, (1999), 92-99. 17. Rennison, E., Galaxy of news: An Approach to Visualizing and Understanding Expansive News Landscapes. in Proc. of UIST'94, ACM Symposium on User Interface Software and Technology, (New York, USA, 1994), 3-12. 18. Resnikoff, H.L. The illusion of Reality. Springer-Verlag, New York, 1989. 19. Robertson, G.G., Card, S.K. and Mackinlay, J.D. Information Visualization Using 3D Interactive Animation. Communications of the ACM, 36(4). (1993), 57-71. 20. Shneiderman, B., The Eyes have it: A Task by Data Type Taxonomy. in Proc. of IEEE Symp. Visual Languages 96, (1996), 336-343. 21. Shneiderman, B. Inventing Discovery Tools: Combining Information Visualization with Data Mining. Information Visualization, INFOVIS, (2002), 5-12. 22. Wang, J., Agrawal, A., Bazaza, A., Angle, S., Fox, E.A. and North, C., Enhancing the ENVISION Interface for Digital Libraries. in Second ACM/IEEE-CS joint conference on Digital libraries, (Portland, Oregon, USA, 2002), ACM Press, 275-276. 23. Wise, J.A., Thomas, J.J., Pennock, K., Lantrip, D., Pottier, M. and Schur, A., Visualizing the Non-visual: Spatial Analysis and Interaction with Information from Text Documents. in Proc. of the Information Visualization Symposium 95, (1995), IEEE Computer Society Press, 51-58. 24. Zamir, O. Clustering Web Algorithms: A Phrase-Based Method For Grouping Search Engine Results, University of Washington, 1999. 25. Zamir, O. and Etzioni, O., Grouper: A Dynamic Clustering Interface to Web Search Results. in WWW8 / Computer Networks, (1999). 26. Zamir, O. and Etzioni, O., Web Document Clustering: A Feasibility Demonstration. in SIGIR 1998, (Melbourne, Australia, 1998).