STOTEN-21418; No of Pages 10 Science of the Total Environment xxx (2016) xxx–xxx
Contents lists available at ScienceDirect
Science of the Total Environment journal homepage: www.elsevier.com/locate/scitotenv
Citizen science-based water quality monitoring: Constructing a large database to characterize the impacts of combined sewer overflow in New York City David J. Farnham a,⁎, Rebecca A. Gibson b,1, Diana Y. Hsueh b, Wade R. McGillis b, Patricia J. Culligan c, Nina Zain d, Rob Buchanan e a
Department of Earth and Environmental Engineering, Columbia University, 918 S.W. Mudd, Mail Code: 4711, New York, NY, USA Department of Geochemistry, Lamont Doherty Earth Observatory, 61 Route 9W, – PO Box 1000, Palisades, NY, USA c Department of Civil Engineering and Engineering Mechanics, Columbia University, 610 S.W. Mudd, Mail Code: 4709, New York, NY, USA d The River Project, Pier 40 at West St. & Houston St, 2nd Floor, New York, NY. USA e Steering Committee, New York City Water Trail Association and Coordinator, Citizens Water Quality Testing Program, USA b
H I G H L I G H T S
G R A P H I C A L
A B S T R A C T
• A citizen science water quality sampling campaign to construct a database • Data show elevated enterococci concentrations following days of rainfall. • A cost/time efficient alternative pathogen detection method shows potential. • Discussion of barriers to citizen science proliferation in water quality testing
a r t i c l e
i n f o
Article history: Received 16 September 2016 Received in revised form 17 November 2016 Accepted 17 November 2016 Available online xxxx Editor: D. Barcelo
a b s t r a c t To protect recreational water users from waterborne pathogen exposure, it is crucial that waterways are monitored for the presence of harmful bacteria. In NYC, a citizen science campaign is monitoring waterways impacted by inputs of storm water and untreated sewage during periods of rainfall. However, the spatial and temporal scales over which the monitoring program can sample are constrained by cost and time, thus hindering the construction of databases that benefit both scientists and citizens. In this study, we first illustrate the scientific value of a citizen scientist monitoring campaign by using the data collected through the campaign to characterize the seasonal variability of sampled bacterial concentration as well as its response to antecedent rainfall. Second, we
Abbreviations: NYC, New York City; EPA, Environmental Protection Agency; CSO, combined sewer overflows; CSS, combined sewer system; MPN, Most Probable Number; CFU, Colony Forming Units; TNTC, Too Numerous To Count; WWTP, wastewater treatment plant; FIB, fecal indicator bacteria; CWQT, Citizen's Water Quality Testing Program; NYCWTA, New York City Water Trail Association; CU, Columbia University; FWW, FreshWater Watch; HSBC, Hong Kong and Shanghai Banking Corporation; NYC DEP, New York City Department of Environmental Protection; ENT, enterococci. ⁎ Corresponding author. E-mail addresses:
[email protected] (D.J. Farnham),
[email protected],
[email protected] (R.A. Gibson),
[email protected] (D.Y. Hsueh),
[email protected] (W.R. McGillis),
[email protected] (P.J. Culligan),
[email protected] (N. Zain),
[email protected] (R. Buchanan). 1 Current address: Duke University School of Medicine, Box 102005 Durham, NC, USA.
http://dx.doi.org/10.1016/j.scitotenv.2016.11.116 0048-9697/© 2016 Elsevier B.V. All rights reserved.
Please cite this article as: Farnham, D.J., et al., Citizen science-based water quality monitoring: Constructing a large database to characterize the impacts of combined sewer overfl..., Sci Total Environ (2016), http://dx.doi.org/10.1016/j.scitotenv.2016.11.116
2
D.J. Farnham et al. / Science of the Total Environment xxx (2016) xxx–xxx
Keywords: CSO Water quality Fecal indicator bacteria HyServe Compact Dry ETC IDEXX Enterolert Citizen science
examine the efficacy of the HyServe Compact Dry ETC method, a lower cost and time-efficient alternative to the EPA-approved IDEXX Enterolert method for fecal indicator monitoring, through a paired sample comparison of IDEXX and HyServe (total of 424 paired samples). The HyServe and IDEXX methods return the same result for over 80% of the samples with regard to whether a water sample is above or below the EPA's recreational water quality criteria for a single sample of 110 enterococci per 100 mL. The HyServe method classified as unsafe 90% of the 119 water samples that were classified as having unsafe enterococci concentrations by the more established IDEXX method. This study seeks to encourage other scientists to engage with citizen scientist communities and to also pursue the development of cost- and time-efficient methodologies to sample environmental variables that are not easily collected or analyzed in an automated manner. © 2016 Elsevier B.V. All rights reserved.
1. Introduction Citizen scientist engagement in environmental data collection is a co-beneficial activity in which laymen can help build large datasets of environmental parameters that are not automatically collectable due to technological or budgetary constraints. Enhancements in public learning and civic engagement often come out of such programs, most notably increased understanding in certain aspects of scientific literacy and thought processes (Price and Lee, 2013; Trumbull et al., 2000) and legislature/advocacy participation (Cornwell and Campbell, 2012; Overdevest et al., 2004). Mature and successful citizen scientist engagement exists in both the astronomy and ornithology disciplines, e.g. volunteers have classified galaxies for the Sloan Digital Sky Survey (Lintott et al., 2011, 2008) and observed the procreation and breeding biology of birds (Ornithology, 2011). Water quality monitoring campaigns, however, have utilized citizen science less. Several exceptions include measuring underwater diffuse attenuation (Bardaji et al., 2016), nitrate, ammonium and dissolved organic nitrogen in surface waters (Breuer et al., 2015), sea surface temperatures (Brewin et al., 2015), and FreshWater Watch, which was spearheaded by the Earthwatch Institute with support from Hong Kong and Shanghai Banking Corporation (HSBC). FreshWater Watch's focus has been to examine the health of various freshwater ecosystems globally using citizen scientists (Thornhill et al., 2016). Even less work has been put into monitoring water quality to assess aquatic and human exposure to harmful pathogens and/or pollutants (Stepenuck et al., 2011), including those arising from combined sewer overflows (CSOs). Bacteria testing, which often requires the incubation of samples in a laboratory, is an active area of interest for both scientists attempting to understand the impacts of CSO contamination in urban waterways (Brosnan et al., 1996; McLellan and Salmore, 2003) and citizen groups eager to make informed choices about participating in water-based recreational activities. Resolute sampling campaigns and the construction and curation of spatially distributed datasets are critical because of the spatially and temporally heterogeneous nature of fecal bacteria in urban waterbodies, which arises in part because of the distributed nature of point discharges from combined sewer systems (CSSs) (EPA, 2004). As such, increased formal engagement of citizen scientists in bacteria monitoring campaigns is a win-win for citizen and scientific communities. This study is a unique example of the use of citizen science-based monitoring of fecal indicator bacteria (FIB) concentrations in waterbodies of the greater New York City area to a) inform scientific inquiries and b) to construct a practically useful data repository for citizen groups with a vested interest in the bacteria concentrations in the water (e.g. kayakers, rowers and other recreational users). In the present study, we use citizen sourced data to characterize the concentration of the FIB enterococci (ENT) across space and time by 1) computing the percentage of samples that showed levels of ENT above the acceptable threshold for recreation, 2) evaluating the seasonality of ENT concentrations at the sites that citizens sampled year-round, 3) discussing the spatial and temporal correlation structures in ENT concentrations among the sites, and 4) investigating whether ENT concentrations
sampled the day after a precipitation event were elevated compared to those sampled the day after dry days. A barrier to the expansion of citizen science monitoring campaigns such as the one showcased in this study is the cost of the sampling kits and the need for specialized laboratory equipment. We address this by evaluating the use of a cheaper and less time-intensive alternative testing protocol to the current protocol through a paired sample analysis. Specifically, we ask: how well does the HyServe testing protocol correspond to the currently used IDEXX testing protocol with regard to concentrations being above or below the critical threshold for recreational activity? In the following sections we outline the combined sewer systems in the context of NYC and introduce the citizen science group engaged in this project. We then describe the materials and methods used in the study. Next, the results are presented and discussed before the study conclusions are provided. 2. Combined sewer overflows and citizen science monitoring Public sewer designs heavily influence the quality of surrounding waterways. Over 700 communities in the United States have combined sewer systems, where a single network of pipes collects domestic, commercial, and industrial wastewaters together with storm water runoff. On a dry day, effluent from buildings gets transported to a wastewater treatment plant (WWTP) where the water is treated and discharged into the adjacent waterway. During precipitation events, the additional stormwater combines with building wastewater, sometimes exceeding WWTP capacity and results in the release of a mix of wastewater and stormwater into the surrounding surface waterways at designated outfall points. The EPA defines these discharge events as CSOs and estimates that CSO events result in the release of approximately 850 billion gallons (3.2 billion m3) of untreated wastewater and stormwater per year across the U.S. (EPA, 2004). The discharge of untreated wastewater into nearby surface waters via CSOs has major environmental consequences for receiving waterbodies. CSOs can contribute oxygen depleting organic material, total suspended solids, toxics, nutrients, floatables and trash, steroid hormones, wastewater micropollutants, and pathogens harmful to human health to the receiving waterbody (Alp et al., 2007; Donovan et al., 2008; Eganhouse and Sherblom, 2001; EPA, 2004; Miskewitz and Uchrin, 2013; Phillips and Chalmers, 2009; Phillips et al., 2012). The environmental impacts of CSOs on water quality can include eutrophication and hypoxia, making ecosystems uninhabitable to aquatic fauna. The severity of CSO impact varies significantly based on a suite of natural and built environmental factors including CSO outfall design, rain history, waterbody type, and land cover. For example, a large, urban environment like NYC generates frequent CSO events via excess storm water runoff from its predominantly impervious land cover. CSO discharge poses particular problems for recreational users of receiving waterbodies. Exposure to fecal contamination in untreated wastewater has been linked to gastrointestinal illness and less often respiratory illness (Byappanahalli et al., 2012), which associate with symptoms including fever, nausea, stomachache, diarrhea, or vomiting. The prominence of CSO events, in conjunction with the evident link
Please cite this article as: Farnham, D.J., et al., Citizen science-based water quality monitoring: Constructing a large database to characterize the impacts of combined sewer overfl..., Sci Total Environ (2016), http://dx.doi.org/10.1016/j.scitotenv.2016.11.116
D.J. Farnham et al. / Science of the Total Environment xxx (2016) xxx–xxx
between human health and fecal contamination, led the EPA in 1986 to publish recommended water quality measurements and associated concentration levels for the protection of recreational waterway users (EPA, 1986). The EPA updated its recommendations in 2012 (EPA, 2012). To provide better data for decision makers on CSO control and increase national understanding of the environmental and human health impacts associated with CSOs, the EPA is encouraging development of improved CSO monitoring and reporting programs (EPA, 2004). However, CSO monitoring is both cost and time intensive. The US EPA, 2012 Recreational Water Quality Criteria recommend monitoring the presence of wastewater via ENT and Escherichia coli (EPA, 2012), but current methodologies for measuring FIB require sampling materials, expensive laboratory equipment, and prior hours of laboratory training. Additionally, comprehensive monitoring of a CSS, which may include hundreds of CSO outfall points each exhibiting varying water quality conditions over time, requires a great deal of manpower to collect and analyze water quality samples. In NYC, around 72% of land area consists of impervious surface (NYC DEP, 2013), making the majority of precipitation that falls on the city drain into the city's CSS. This causes CSOs to discharge approximately 30 billion gallons (110 million m3) of effluent into NYC's waterways each year (NYC DEP, 2010). To ameliorate this problem, the city will spend $5.3 billion toward cost-effective grey investments and green infrastructure by 2030 to reduce the amount of discharge by 3.8 billion gallons (14 million m3) per year (NYC DEP, 2010). Simultaneously, there have been several programs in place that serve to assess current and long-term changes in water quality in the New York Harbor, most notably the yearly testing that has been done by the New York City Department of Environmental Protection (NYC DEP) since 1909 (NYC DEP, 2016a). Presently, NYC DEP performs weekly bacteria water testing campaigns from June through September and monthly water sampling campaigns from October through May at 70 sites around NYC (NYC DEP, 2016b). A major critique of this program is that the NYC DEP only collects samples in the middle of the waterways and not along the shorelines. This is particularly troublesome for canoe and kayak recreationalists because they are occasionally exposed to the water near the shoreline when entering and exiting their vessel. Other critiques of the NYC DEP monitoring program concern the substantial delay (sometimes several weeks) in the posting of the testing results
3
and the fact that the NYC DEP does not publish the time of sampling on their website. With 426 CSO outfall locations (NYC DEP, 2013), a large percentage of impervious land cover, a wide variety of recreational water activities, and over 8 million residents to provide CSO monitoring manpower, NYC proves an excellent testbed for the application of citizen science CSO-related water quality monitoring. One particular group that has had a vested interest is the Citizen's Water Quality Testing Program (CWQT), which was started in 2011 by the New York City Water Trail Association (NYCWTA) and The River Project (TRP). It was initiated by a group of concerned human-powered boaters who wanted to better understand the water quality of the urban waterways. As of the summer of 2015, the CWQT organization has approximately 50 primary and back-up samplers who collect grab samples from a total of 46 sites. Sampling takes place every Thursday morning between the hours of 6 am to 12 noon and the grab samples are delivered to a partnering laboratory to be processed. Results are then tallied and circulated via email every Friday afternoon. In this study, most of the data was collected as part of the CWQT program, and all samples were analyzed at Columbia University (CU). 3. Materials and methods 3.1. Site locations and sampling protocols The locations, characteristics, and sample sizes associated with each of the sites used in this study are given in Table 1 and Fig. 1. The IDEXX samples are used in Section 4.1, and the paired samples are used in Section 4.2. Sites were selected throughout the New York City harbor waterways based on their proximity to CU and locations of interest to the citizen scientists. All data was collected between April 2014 and July 2016. There were two distinct time frames in which samples were collected to produce a yearlong dataset. In the months of May through September, volunteers individually collected the water samples and delivered the grab samples to CU where CU lab members conducted the bacteria analysis. In the months of October through April, CU lab members completed both the grab sampling and analysis. There were more sites sampled during the warm months of May through September because of the volunteer efforts. Ideally, we would not have a cold season break in the monitoring at any of the sites, however, we chose not to ask volunteers to endure the cold temperatures, snow, and winds of the
Table 1 Sampling site characteristics. *The samples collected at West 154th street are not included in Section 4.1 because the exact grab sample location was not constant throughout the study. West 154th samples are included in Section 4.2 for the paired comparison of IDEXX and HyServe. Site name
Abbreviation
Water body
Dock/pier or shore
# of paired samples
# of IDEXX samples
West 100th West 125th West 133rd West 145th West 154th Pier 25 Pier 40 Bronx Kill East Bronx Kill West Gowanus Hunts Point Inwood Canoe Club JFK Park Dock (Yonkers) JFK Park Ramp (Yonkers) Little Hells Gate Muscota Marsh North Cove New York Botanical Garden Saw Mill River Swindler's Cove Starlight Park—North Starlight Park—South Yonkers Paddling and Rowing Club
100 125 133 145 154 25 40 BxKill E BxKill W Gow Hunt ICC JFK Dock JFK Ramp LHG MM NC NYBG SMR SC Star N Star S YPRC
Hudson River Hudson River Hudson River Hudson River Hudson River Hudson River Hudson River Bronx Kill Strait Bronx Kill Strait Gowanus Canal Bronx River Hudson River Hudson River Hudson River Little Hells Gate Salt Marsh/Harlem River Harlem River Harlem River Bronx River Saw Mill River Harlem River Bronx River Bronx River Hudson River
Shore Dock/pier Dock/pier Shore Shore/shore with bucket Dock/pier Dock/pier Shore Shore Shore Dock/pier Dock/pier Dock/pier Shore Shore Dock/pier Shore Shore with bucket Shore/shore with bucket Dock/pier Dock/pier Dock/pier Dock/pier
0 3 45 0 49 1 4 19 19 1 32 30 6 10 0 29 19 51 9 28 31 28 10
6 3 60 9 56* 1 4 28 28 1 39 47 6 19 9 46 28 56 18 43 42 28 19
Please cite this article as: Farnham, D.J., et al., Citizen science-based water quality monitoring: Constructing a large database to characterize the impacts of combined sewer overfl..., Sci Total Environ (2016), http://dx.doi.org/10.1016/j.scitotenv.2016.11.116
4
D.J. Farnham et al. / Science of the Total Environment xxx (2016) xxx–xxx
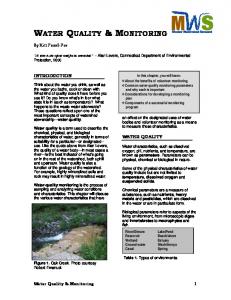
Fig. 1. Water sampling site locations (red circles), and Central Park weather station (blue diamond). (For interpretation of the references to color in this figure legend, the reader is referred to the web version of this article.)
wintertime to collect data during a time when there is little chance of human contact with the water. In all cases, samples were collected manually using IDEXX's sterile 120 mL shrink-banded vessels with sodium thiosulfate by submerging the container approximately 6 in. (15 cm) below the water surface. The sodium thiosulfate is present to prevent chlorine, which is often added to water at WWTPs, from eradicating more bacteria currently present in the water sample. Thus the amount of bacteria in the water sample is representative of the amount in the water body. The samples were kept in a chilled, lightproof, insulated bag and processed in the laboratory within 6 h of obtaining the water sample. 3.2. Enterococci laboratory analysis Two techniques were used to analyze the water samples: Enterolert from IDEXX Laboratories and Compact Dry ETC Plates from HyServe GmbH & Co. KG. For the Enterolert analysis we used a 1:10 dilution, which is recommended for saline and brackish water. 10 mL of sample water was poured into another sterile shrink-banded vessel. 90 mL of sterilized water was then added to the 10 mL of sample water for a total of 100 mL of diluted sample water. The Enterolert media, which contains nutrition and a UV tag for the bacteria, is then added to this vessel and shaken to let thoroughly dissolve. The contents are then
poured into a Quanti-Tray/2000 and then sealed using a Quanti-Tray sealer. The trays were placed in an incubating oven at 41 °C ± 0.5 °C for 24–28 h. After this period the tray is taken out and illuminated under a UV light. The number of large and small wells that glow are then counted and the results are enumerated using a chart provided by IDEXX. The reading from the chart is then multiplied by 10 due to the dilution factor. The units are expressed in Most Probable Number (MPN) per 100 mL of sample. For the Compact Dry ETC Plate method, 1 mL of water from the original shrink-banded vessel used to obtain the water sample was aliquoted with a sterile disposable pipette. The 1 mL of water was then dripped onto the plate with nutritional media over which the water diffused. The plate was then incubated at 35 °C ± 2.0 °C for 20– 24 h. After the incubation period, visible colony dots that appear on the plate are counted. The results are expressed in Colony Forming Units (CFU) per 100 mL (i.e. the number of colonies that formed from the 1 mL is multiplied by 100). However, a HyServe representative indicated that if over 200 colonies were counted on any plate, the exact numeric result was not deemed reliable because the chromogens in the plate may not be enough to color all bacteria (Sprenger, R. personal communication, November 3, 2015) and the sample was recorded as “Too Numerous To Count” (TNTC) but indicated as 20,000 ENT for data analysis purposes. The IDEXX ENT testing method costs
Please cite this article as: Farnham, D.J., et al., Citizen science-based water quality monitoring: Constructing a large database to characterize the impacts of combined sewer overfl..., Sci Total Environ (2016), http://dx.doi.org/10.1016/j.scitotenv.2016.11.116
D.J. Farnham et al. / Science of the Total Environment xxx (2016) xxx–xxx
approximately $12/sample and takes 10 min to complete the analysis, while the HyServe ENT testing method costs only $1.50/sample and takes a minute to complete the analysis. 3.3. Data preparation and methods For the analysis presented in Section 4.1, only the IDEXX data were used and the following preparation was completed: 1. When multiple samples from the same location were analyzed, the arithmetic mean of the tests was used. This was only applicable to 12 samples. 2. Values coded as “b 10 MPN” were set to “10 MPN”. For the analysis presented in Section 4.2, IDEXX and HyServe data were prepared (as follows) for ease of comparison: 1. When multiple samples from the same location were analyzed, the arithmetic mean of the tests was used. This was only applicable to 12 IDEXX and 50 HyServe samples. 2. All HyServe values coded as “TNTC” were set to 20,000 CFU. 3. All IDEXX values N20.000 MPN were set to 20,000 MPN. 4. All values coded as “b 10 MPN” or “0 CFU” were set to 10 MPN and 10 CFU. This transformation was done to allow for log-log plotting. The aforementioned transformations did not meaningfully affect the quantitative comparisons of the two testing protocols in Section 4.2, particularly because our primary concern is whether a sample is above or below the standard outlined in the following section. The use of the IDEXX kits as the benchmark protocol is supported by the extensive comparison of the IDEXX with membrane filtration and multiple tube fermentation methods (Noble et al., 2003b). The Central Park daily station precipitation data was collected from the KNMI Climate Explorer website (https://climexp.knmi.nl). 3.4. Critical threshold for enterococci ENT is the EPA-recommended FIB in non-fresh waters, and the recommendations for the Statistical Threshold Value (STV) are 130 and 110 CFU/100 mL, based on estimated illness rates of 36 and 32 per 1000 primary contact recreators (EPA, 2012). The STV estimates the 90th percentile of acceptable FIB testing results (i.e. no N 10% of the samples taken should exceed this value). Here, we use this standard as a single sample threshold (as it is referred to as in Boehm and Sassoubre, 2014), and focus on the stricter ENT recommendation of 110 CFU/100 mL. We treat the MPN ENT per 100 mL results from the IDEXX protocol as simply ENT per 100 mL. In other words, we do not use the 95% confidence intervals associated with the IDEXX enumeration and instead use the point estimate of the Most Probable Number of ENT per 100 mL to allow for comparison to the HyServe results. While CFU and MPN are not strictly equivalent (Gronewold and Wolpert, 2008) due to their different means of estimation, both enumeration methods are attempts to estimate the same underlying quantity of interest (i.e. ENT concentration). In fact, CFU and MPN are sometimes used interchangeably for ENT (Noble et al., 2003a). Therefore, we report the IDEXX and HyServe results in number of ENT per 100 mL from this point forward. The implicit assumption here is that neither of the testing protocols are biased with respect to their maximum likelihood estimates of ENT concentration. There are, however, reasons why the results from each method may differ (Noble et al., 2003b). In particular, the HyServe test is counting colonies of ENT, while the IDEXX test is measuring the ability of the ENT to metabolize a substrate. In the case of comparing membrane filtration-based tests (that report in CFU), and multiple tube fermentation tests (that report in MPN), some work has been done to construct conversion procedures to account for the different levels of intrinsic variability present in each estimation procedure (see Gronewold and Wolpert, 2008 for a more complete explanation) and intrasample bias
5
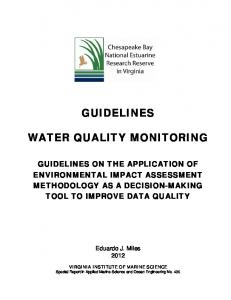
between the two testing protocols (Cho et al., 2010; Gronewold and Wolpert, 2008). The development of such a correction procedure is outside the scope of this paper and would be difficult in this case because we do not have samples of known ENT concentrations, multiple tests were not conducted on each water sample, and we are using enumeration methods with different levels of resolution and variability. 4. Results We start by illustrating how citizen-scientist-collected data can be used to characterize the waterway sites in greater New York City. Only the IDEXX data is used in Section 4.1. In Section 4.2, we present the paired IDEXX/HyServe data and discuss the use of the HyServe testing protocol as a low-cost alternative to the IDEXX testing protocol. 4.1. NYC waterway enterococci seasonality and response to antecedent rainfall Elevated ENT concentrations above the recreational water quality criteria for a single sample of 110 ENT per 100 mL were common among many of the sites during the warm season of May through October (31% of the warm season samples eclipsed the threshold), and less common during the cold season of November through April (9% of the cold season samples eclipsed the threshold). For the sites that were tested year-round and included at least 10 warm season and at least 10 cold season samples (i.e. sites 133, Hunt, NYBG, Star N, and Star S), the seasonal differences were also stark: 35% of warm season samples were N110 ENT per 100 mL, compared to only 10% for the cold month samples. Fig. 2 exemplifies the relative lack of high ENT concentrations during the colder months for the five well-sampled sites. The Star S site stands out as the only site for which the cold season median value was greater than the warm season median value. The autocorrelation at a lag of 1 week at each site with at least 20 warm month observations was b0.2 and non-significant, indicating that estimating a continuous time record of ENT concentrations will require higher temporal frequency sampling. While we expect the ENT concentration to be heterogeneous in space due to varying hydrodynamics of the waterways and varying proximity of the sampling sites to CSO outfalls of various sizes, Fig. A1 illustrates that the majority of the sites are well correlated with one another (29 of the 45 pairs of the 10 sites used in the analysis have statistically significant positive rank correlations at 95%). However, these significant correlations
Fig. 2. Boxplots of enterococci concentrations for the five sites with at least 10 warm month and 10 cold season samples (blue = cold season, red = warm season). The dotted horizontal line represents the safety standard for contact with the water and the color of the boxplots indicates whether the sample was taken during the warm or cold season. The box spans from the 25th to the 75th percentiles, and the solid black horizontal line inside of the box represents the median value. The tails on the boxes show the location of extreme values within 1.5 times the interquartile (75th–25th percentiles), while dots represent extreme values outside of that range. (For interpretation of the references to color in this figure legend, the reader is referred to the web version of this article.)
Please cite this article as: Farnham, D.J., et al., Citizen science-based water quality monitoring: Constructing a large database to characterize the impacts of combined sewer overfl..., Sci Total Environ (2016), http://dx.doi.org/10.1016/j.scitotenv.2016.11.116
6
D.J. Farnham et al. / Science of the Total Environment xxx (2016) xxx–xxx
Star N
# ENT/100 mL
10000 1000
season Cold
100
Warm 10 1 May 2014
Jul 2014
Sep 2014
Nov 2014
Jan 2015
Mar 2015
May 2015
Jul 2015
Sep 2015
Date
Hunt
# ENT/100 mL
10000 1000
season Cold
100
Warm 10 1 May 2014
Jul 2014
Sep 2014
Nov 2014
Jan 2015
Mar 2015
May 2015
Jul 2015
Sep 2015
Date
NYBG
# ENT/100 mL
10000 1000
season Cold
100
Warm 10 1 May 2014
Jul 2014
Sep 2014
Nov 2014
Jan 2015
Mar 2015
May 2015
Jul 2015
Sep 2015
Date
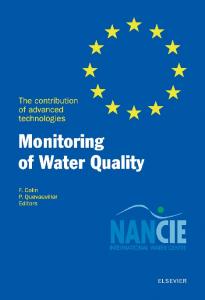
Fig. 3. Enterococci over time at site Star N (top), Hunt (middle), and NYBG (bottom). The horizontal dashed line represents the safety standard for contact with the water and the colors of the bars indicates whether the sample was taken during the warm (red) or cold (blue) season.
between many sites appears to be due to a shared dependence on rainfall and subsequent CSOs rather than a reflection of consistently spatially homogeneous ENT concentrations throughout the waterways. In fact, only 18 of the 45 pairs of the 10 sites have statistically significant positive rank correlations (at 95%) when excluding the grab samples collected the day of or the day after precipitation above 7.5 mm. Although sites generally have higher concentrations during the warm months, seasonality and/or location do not explain the periodic spikes in bacteria concentration (e.g. mid September 2015 in Fig. 3). Additional data are needed to estimate the effects of site and/or seasonality on the concentration of ENT in the NYC waterways. Estimating the effects of the site and season is challenging due to the variability that
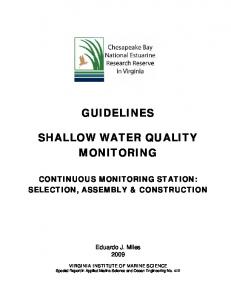
exists at the grab sample level (e.g. the tide and/or wind conditions may impact the turbidity of the water at a site throughout the sampling campaign). To evaluate whether the spikes in bacteria concentration are related to antecedent rainfall, we compare the samples taken after dry and wet days. We exclude the cold month data from this analysis to evaluate the effect of precipitation without confusion from the disparate system reactions to rainfall vs. snowfall. We make this exclusion without significantly reducing our sample (471 of the 540 samples were collected during the warm months). The presence of precipitation (at least 7.5 mm) at the Central Park weather station on the day prior to sampling is clearly associated with increased ENT concentrations (Fig. 4).
Fig. 4. The paired boxplots show the enterococci concentration when rainfall occurred the day before sampling. Any day with rainfall N7.5 mm at the Central Park station is considered to be a rain day (red boxplot = rain on previous day, blue = no rain on previous day). Only warm month (May through October) data is included. The box and whiskers are as in Fig. 2. Only sites with 20 or more warm month samples and at least 2 wet samples were included in the figure. The horizontal dashed line represents the safety standard for contact.
Please cite this article as: Farnham, D.J., et al., Citizen science-based water quality monitoring: Constructing a large database to characterize the impacts of combined sewer overfl..., Sci Total Environ (2016), http://dx.doi.org/10.1016/j.scitotenv.2016.11.116
D.J. Farnham et al. / Science of the Total Environment xxx (2016) xxx–xxx
7
city. For example, on August 12th, 2016, the Laguardia Airport and Central Park stations in NYC received 25 and 23 mm of rain each, while John F. Kennedy Airport in NYC received no measureable rainfall. 4.2. IDEXX vs. HyServe testing protocols
Fig. 5. The correlation between the enterococci sample values and precipitation amount at the Central Park weather station on days zero to five days prior to sampling (all n = 364). Points between the dashed horizontal lines are not statistically significant correlations at 95%.
While the increase in ENT is only statistically significant for the NYBG and SC sites (at 95% for a two sample Wilcoxon rank-sum test, Mann and Whitney, 1947), the relationship of higher bacteria concentrations in response to day-prior rainfall appears to be consistent across all sites. The median value is higher for each site for the samples collected the day following rainfall. Rain on the day of sampling also appears to elevate the ENT concentrations (Appendix Fig. A2), however, without hourly precipitation data the analysis is noisy due to the mid-day collection of the samples (i.e. day of sampling rain records also include rain that occurred after the grab sample was collected). With this caveat in mind, a correlation analysis on the pooled data (all data used in Fig. 4) reveals that a significant positive relationship between antecedent precipitation and elevated bacteria concentrations only appears to exist for precipitation the day of and the day before (Fig. 5). Figs. 4 and 5 indicate that elevated ENT concentrations are partially attributable to CSO impacts, however, forming a quantitative understanding of the functional relationship between ENT concentration and rainfall at various points in the NYC harbor waterbody system will require further research. For example, monitoring the overflow sites over the course of a storm to identify when CSO discharges occur would help to remove confounding factors in determining the effect of CSOs on water quality such as the effect of sediment resuspension throughout the water column during rain storms as a result of rougher waters from enhanced surface winds. The use of spatially distributed precipitation stations should also be pursued since storms often produce disparate precipitation amounts at different locations within a
Our primary focus in the comparison of the relatively simplistic HyServe ENT testing method and the relatively equipment intensive IDEXX ENT testing method is to understand how the testing methods compare with regard to the threshold of 110 ENT per 100 mL. While the comparison data used in this section mixes both the warm and cold season samples (and thus mixes samples collected by volunteers and lab members), we do not expect this mixing to effect the HyServe/IDEXX relationship since both the HyServe and the IDEXX tests were conducted on a single grab sample. The comparison of the paired IDEXX and HyServe samples (sites and sample sizes in Table 1) illustrates three primary points (Figs. 6 and 7): 1. The HyServe reports in units of hundreds of ENT per 100 mL. While this lack of precision is a clear drawback of the testing protocol, the use of multiple 1 mL HyServe plates for the same (~100 mL) water sample could improve the resolution of the testing (e.g. if ten 1 mL subsamples from one water sample and ten HyServe plates were used, the test could theoretically detect concentrations of 10, 20, 30, … ENT per 100 mL). 2. There was a tendency for the HyServe to return higher ENT values than the IDEXX (Fig. 6). For example, 73% of the HyServe ENT concentration values were higher than corresponding IDEXX values for all paired samples with IDEXX values N100 ENT per 100 mL. This indicates that a more rigorous comparison procedure that accounts for differences resulting from the two enumeration methods (e.g. Gronewold and Wolpert, 2008) is likely useful in this case. 3. Despite the differences in test result resolutions, the tests largely agreed on whether a sample was above or below the critical threshold of 110 ENT per 100 mL (i.e. most of the paired samples were in quadrants I and III of Fig. 6). Over 80% (343 out of 424 samples) have consistent classification across the two methodologies (Fig. 7). 5. Discussion 5.1. Seasonality of enterococci in NYC waterways The strong seasonality in bacteria concentration in the waterways is presumably due (in part) to effects resulting from the strong temperature seasonality in NYC. Firstly, the dominance of snowfall precipitation
150
10000
IIV V
Method
IIII I
count
HyServe (# ENT/100 mL)
200
100
IDEXX HyServe
100 50
I
II 0 100
10000
IDEXX (# ENT/100 mL)
100
10000
HyServe/IDEXX
Fig. 6. (Left) Paired test results from the HyServe and IDEXX testing protocols. The dashed line shows 1:1, while the horizontal and vertical red lines show the violation threshold of 110 enterococci per 100 mL. A jitter has been applied in the vertical and horizontal directions to separate collocated points. (Right) The marginal distributions for the paired samples. The vertical dashed red line shows the median HyServe value and the vertical blue line shows the median IDEXX value. (For interpretation of the references to color in this figure legend, the reader is referred to the web version of this article.)
Please cite this article as: Farnham, D.J., et al., Citizen science-based water quality monitoring: Constructing a large database to characterize the impacts of combined sewer overfl..., Sci Total Environ (2016), http://dx.doi.org/10.1016/j.scitotenv.2016.11.116
8
D.J. Farnham et al. / Science of the Total Environment xxx (2016) xxx–xxx
5.3. Evaluating the HyServe method
60
40
IDEXX low & HyServe low (I)
%
IDEXX high & HyServe high (III) IDEXX low & HyServe high (IV) 20
IDEXX high & HyServe low (II)
0 I
III
IV
II
Fig. 7. The distribution of classification categories that correspond to the quadrants in Fig. 6.
during the winter season in NYC results in a delay of water entering the CSS. This reduces the peak flow in the system and giving the WWTPs a chance to process sewage and stormwater drainage in a timely manner, ultimately reducing the sewage input into receiving waterways during and following precipitation events. Secondly, cold temperatures limit ENT growth (the genus survives best under a temperature range of 5– 65 °C, as per Fisher and Phillips, 2009) and winter temperatures in NYC are often below 5 °C. Enhanced solar radiation during the warm months, on the other hand, should have a negative effect on bacteria concentrations during the summer months since solar radiation kills ENT (Alkan et al., 1995). The Star S site stood alone as the only site with a higher median concentration during the cool season (Fig. 2). We speculate that the presence of a small dam that separates Star N and Star S may at times result in stagnant water at Star S and in turn influence the near-surface bacteria concentration. Understanding the seasonality of Bronx River flow will therefore be important. At present it is difficult to discern which effects (e.g. ambient temperature, solar radiation, local hydrodynamics) dominate under which conditions across a variety of urban waterways. 5.2. Barriers to growing citizen science water quality sampling campaigns There have been many attempts to leverage the correspondence between antecedent rainfall and bacterial waterway contamination through the use of statistical models that predict bacteria concentration based on other environmental parameters such as antecedent rainfall, water temperature, and dissolved oxygen (Farnham and Lall, 2015; Gonzalez et al., 2012; Olyphant and Whitman, 2004). These modeling efforts would benefit from increasingly granular data in both space and time. From a recreation safety perspective, on the other hand, sampling should be prioritized at locations where recreational activities are most concentrated, such as kayak launches, as is done by the Citizen's Water Quality Testing Program (see also Levesque et al., this issue). Given the positive outcomes associated with increased citizen scientist participation in water quality sampling, expanded citizen scientist participation seems to be a goal worthy of pursuit. The primary barriers to increased and sustatined citizen scientist participation (as understood through informal conversations and formal surveying of the CWQT participants) are time and money. Therefore, one course of action should be to seek out low-cost, time efficient alternative methods to IDEXX such as HyServe. The fact that the incubation oven is the only specialized equipment required for the HyServe protocol creates the possibility of decentralized testing initiatives (even “at-home” labs), which would reduce citizen scientist time commitments. In fact, the cost of purchasing a egg-incubation oven (~$150) that has the precision required for sample incubation can be offset by the cost savings of analyzing only 13 HyServe samples rather than 13 IDEXX samples.
While the HyServe testing protocol is no silver bullet, it appears to offer potential to predict whether a sample is above or below a critical threshold of 110 ENT per 100 mL (EPA, 2012). Only 3% of the IDEXXHyServe paired samples showed high IDEXX and low HyServe values, and only 16% showed low IDEXX and high HyServe values. Clearly the former is more problematic from a risk-averse perspective. The preliminary analysis presented here should be extended to formalize the comparison between the IDEXX and HyServe testing protocols by using water samples of known ENT concentrations, using multiple IDEXX and HyServe tests for each water sample, and attempting to resolve any bias between the testing protocols. Also, other strategies for reducing the time required to collect, deliver, and analyze field water quality data should continue to be pursued in an effort to promote scientific investigation and aid regulators and water managers in understanding the downstream effects of management policies. 6. Summary and conclusions The primary purpose of this paper was to illustrate engagement of citizen scientists in water quality testing activities working toward the mutually beneficial goal of constructing a large database of historical bacteria concentrations in waterways. We have presented a test case for partnering with citizen scientists to construct large, spatially distributed datasets of waterway fecal indicator bacteria concentrations for the dual purpose of facilitating scientific knowledge building and providing a resource for citizens to inform themselves of the risks associated with contacting water in urban settings. We have used the citizen science data to characterize the NYC waterbodies and show a clear difference in the distribution of ENT concentrations conditional on whether there was rainfall during the day prior to sample collection. We speculate that the elevated ENT levels following the wet days are a result of combined sewer overflows but stress that more targeted sampling campaigns are needed to investigate the rain-combined sewer overflow-waterway bacterial contamination pathway more rigorously. We have illustrated the potential usefulness of a low-cost alternative (HyServe) to a more established testing protocol for ENT (IDEXX). HyServe and low-cost incubation ovens could stimulate data collection through lower analysis costs. As we move toward a future that is increasingly well monitored by networks or sensors, there are still some environmental variables that do not have established technology for automatically collecting and analyzing samples. Citizen science initiatives can aid in the sampling of such variables, while at the same time promoting science literacy, increasing environmental health awareness among non-scientists, and empowering communities to become involved in management and infrastructure planning processes. Making such initiatives as time and money efficient as possible, while maintaining sufficient accuracy and precision in the data collection and analysis process, can increase the engagement of citizen scientists and ultimately benefit both citizens and scientists. Acknowledgements The authors thank Nancy Brous of the NYC Water Trail Association, and Eli Caref of The River Project for their work with the Citizen's Water Quality Testing Program. We also thank Yun Zheng, Diana Eddowes, Lizzette Butkiewicz and Steven Loiselle for field support and Ian Thornhill and the three anonymous reviewers for comments that improved the manuscript. This work was supported by HSBC Bank USA grant EARTHWATCH CU13-1246 where under the scope of FreshWater Watch HSBC Water Programme was the catalyst for this work, the National Science Foundation (NSF) grant CMMI-0928604 and the NSF Integrative Graduate Education and Research Training (IGERT) Fellowship #DGE-0903597. LDEO contribution #8073.
Please cite this article as: Farnham, D.J., et al., Citizen science-based water quality monitoring: Constructing a large database to characterize the impacts of combined sewer overfl..., Sci Total Environ (2016), http://dx.doi.org/10.1016/j.scitotenv.2016.11.116
D.J. Farnham et al. / Science of the Total Environment xxx (2016) xxx–xxx
9
Appendix A
Fig. A1. (Left) The rank correlation between sites that included at least 20 warm month samples. An “X” marks correlations that are not significant at 95%. The color and the portion of the circle filled both represent the correlation coefficient between the two sites shown in red on the top and diagonal. (Right) Bivariate relationship between the sites identified by the red boxes on the left. Only the IDEXX method data was used for this plot.
Fig. A2. Same as Fig. 4 but for samples collected when both the day of sampling and the day prior were dry (i.e. b7.5 mm of precipitation at Central Park weather station). The increase in ENT is statistically significant for the 133, Hunt, NYBG, and Star N (at 95% for a two sample Wilcoxon rank-sum test, Mann and Whitney, 1947).
References Alkan, U., Elliott, D., Evison, L., 1995. Survival of enteric bacteria in relation to simulated solar radiation and other environmental factors in marine waters. Water Res. 29, 2071–2081. Alp, E., Melching, C.S., Zhang, H., Lanyon, R., 2007. Effectiveness of combined sewer overflow treatment for dissolved oxygen improvement in the Chicago waterways. Water Sci. Technol. 56:215–222. http://dx.doi.org/10.2166/wst.2007.455. Bardaji, R., Sanchez, A.-M., Simon, C., Wernand, M.R., Piera, J., 2016. Estimating the underwater diffuse attenuation coefficient with a low-cost instrument: the KdUINO DIY Buoy. Sensors 16. http://dx.doi.org/10.3390/s16030373. Boehm, A.B., Sassoubre, L.M., 2014. Enterococci as indicators of environmental fecal contamination. In: Gilmore, M.S., Clewell, D.B., Ike, Y., Shankar, N. (Eds.), Enterococci: From Commensals to Leading Causes of Drug Resistant Infection. Massachusetts Eye and Ear Infirmary, Boston, Massachusetts. Breuer, L., Hiery, N., Kraft, P., Bach, M., Aubert, A.H., Frede, H.-G., 2015. HydroCrowd: a citizen science snapshot to assess the spatial control of nitrogen solutes in surface waters. Sci. Rep. 5. http://dx.doi.org/10.1038/srep16503.
Brewin, R.J.W., de Mora, L., Jackson, T., Brewin, T.G., Shutler, J., 2015. On the potential of surfers to monitor environmental indicators in the coastal zone. PLoS One 10. http://dx.doi.org/10.1371/journal.pone.0127706. Brosnan, T.M., Shea, M.L.O., Shea, L.O., Brosnan, M., 1996. Sewage Abatement and Coliform Bacteria Trends in the Lower Hudson-Raritan Estuary since Passage of the Clean Water Act 68. pp. 25–35. Byappanahalli, M.N., Nevers, M.B., Korajkic, A., Staley, Z.R., Harwood, V.J., 2012. Enterococci in the environment. Microbiol. Mol. Biol. Rev. 76:685–706. http://dx.doi.org/10. 1128/MMBR.00023-12. Cho, K.H., Han, D., Park, Y., Lee, S.W., Cha, S.M., Kang, J.-H., Kim, J.H., 2010. Evaluation of the relationship between two different methods for enumeration fecal indicator bacteria: Colony-forming unit and most probable number. J. Environ. Sci. 22:846–850. http://dx.doi.org/10.1016/S1001-0742(09)60187-X. Cornwell, M.L., Campbell, L.M., 2012. Co-producing conservation and knowledge: Citizenbased sea turtle monitoring in North Carolina, USA. Soc. Stud. Sci. 42:101–120. http:// dx.doi.org/10.1177/0306312711430440. Donovan, E., Unice, K., Roberts, J.D., Harris, M., Finley, B., 2008. Risk of gastrointestinal disease associated with exposure to pathogens in the water of the Lower Passaic
Please cite this article as: Farnham, D.J., et al., Citizen science-based water quality monitoring: Constructing a large database to characterize the impacts of combined sewer overfl..., Sci Total Environ (2016), http://dx.doi.org/10.1016/j.scitotenv.2016.11.116
10
D.J. Farnham et al. / Science of the Total Environment xxx (2016) xxx–xxx
River. Appl. Environ. Microbiol. 74:994–1003. http://dx.doi.org/10.1128/AEM. 00601-07. Eganhouse, R.P., Sherblom, P.M., 2001. Anthropogenic organic contaminants in the effluent of a combined sewer overflow: impact on Boston Harbor. Mar. Environ. Res. 51: 51–74. http://dx.doi.org/10.1016/S0141-1136(00)00035-0. EPA, 1986. Ambient Water Quality Criteria for Bacteria—1986. EPA, 2004. Report to Congress on the Impacts and Control of CSOs and SSOs—Executive Summary. EPA, 2012. Recreational Water Quality Criteria. Farnham, D.J., Lall, U., 2015. Predictive statistical models linking antecedent meteorological conditions and waterway bacterial contamination in urban waterways. Water Res. 76:143–159. http://dx.doi.org/10.1016/j.watres.2015.02.040. Fisher, K., Phillips, C., 2009. The ecology, epidemiology and virulence of Enterococcus. Microbiology-SGM 155:1749–1757. http://dx.doi.org/10.1099/mic.0.026385-0. Gonzalez, R.A., Conn, K.E., Crosswell, J.R., Noble, R.T., 2012. Application of empirical predictive modeling using conventional and alternative fecal indicator bacteria in eastern North Carolina waters. Water Res. 46:5871–5882. http://dx.doi.org/10.1016/j. watres.2012.07.050. Gronewold, A.D., Wolpert, R.L., 2008. Modeling the relationship between most probable number (MPN) and colony-forming unit (CFU) estimates of fecal coliform concentration. Water Res. 42:3327–3334. http://dx.doi.org/10.1016/j.watres.2008.04.011. Levesque, D., Cattaneo, A., Deschamps, G., Hudon, C., n.d. In the eye of the beholder: assessing the waterquality of shoreline parks around the Island of Montreal. Sci. Total Environ. Lintott, C.J., Schawinski, K., Slosar, A., Land, K., Bamford, S., Thomas, D., Raddick, M.J., Nichol, R.C., Szalay, A., Andreescu, D., Murray, P., Vandenberg, J., 2008. Galaxy Zoo: morphologies derived from visual inspection of galaxies from the Sloan Digital Sky Survey. Mon. Not. R. Astron. Soc. 389:1179–1189. http://dx.doi.org/10.1111/j.13652966.2008.13689.x. Lintott, C., Schawinski, K., Bamford, S., Slosar, A., Land, K., Thomas, D., Edmondson, E., Masters, K., Nichol, R.C., Raddick, M.J., Szalay, A., Andreescu, D., Murray, P., Vandenberg, J., 2011. Galaxy Zoo 1: data release of morphological classifications for nearly 900,000 galaxies. Mon. Not. R. Astron. Soc. 410:166–178. http://dx.doi.org/ 10.1111/j.1365-2966.2010.17432.x. Mann, H.B., Whitney, D.R., 1947. On a test of whether one of two random variables is stochastically larger than the other. Ann. Math. Stat. 18:50–60. http://dx.doi.org/10. 1214/aoms/1177730491. McLellan, S.L., Salmore, A.K., 2003. Evidence for localized bacterial loading as the cause of chronic beach closings in a freshwater marina. Water Res. 37:2700–2708. http://dx. doi.org/10.1016/S0043-1354(03)00068-X. Miskewitz, R., Uchrin, C., 2013. In-stream dissolved oxygen impacts and sediment oxygen demand resulting from combined sewer overflow discharges. J. Environ. Eng. 139: 1307–1313. http://dx.doi.org/10.1061/(ASCE)EE.1943-7870.0000739.
Noble, R.T., Moore, D.F., Leecaster, M.K., McGee, C.D., Weisberg, S.B., 2003a. Comparison of total coliform, fecal coliform, and enterococcus bacterial indicator response for ocean recreational water quality testing. Water Res. 37:1637–1643. http://dx.doi.org/10. 1016/S0043-1354(02)00496-7. Noble, R.T., Weisberg, S.B., Leecaster, M.K., McGee, C.D., Ritter, K., Walker, K.O., Vainik, P.M., 2003b. Comparison of beach bacterial water quality indicator measurement methods. Environ. Monit. Assess. 81:301–312. http://dx.doi.org/10.1023/A: 1021397529041. NYC DEP, 2010. NYC Green Infrastructure Plan—a Sustainable Strategy for Clean Waterways. NYC DEP, 2013. LTCP Frequently Asked Questions. NYC DEP, 2016a. New York Harbor Water Quality Report [WWW Document]. URL http:// www.nyc.gov/html/dep/html/harborwater/harborwater_quality_survey.shtml. NYC DEP, 2016b. Harbor Water Sampling Data [WWW Document]. URL http://www.nyc. gov/html/dep/html/harborwater/harbor_water_sampling_results.shtml. Olyphant, G.A., Whitman, R.L., 2004. Elements of a predictive model for determining beach closures on a real time basis: the case of 63rd Street Beach Chicago. Environ. Monit. Assess. 98:175–190. http://dx.doi.org/10.1023/B:EMAS.0000038185.79137. b9. Ornithology, T.C.L., 2011. NestWatch—Where Birds Come to Life [WWW Document]. URL http://nestwatch.org/. Overdevest, C., Orr, C.H., Stepenuck, K., 2004. Volunteer stream monitoring and local participation in natural resource issues. Res. Hum. Ecol. 11, 9. Phillips, P., Chalmers, A., 2009. Wastewater effluent, combined sewer overflows, and other sources of organic compounds to lake champlain. J. Am. Water Resour. Assoc. 45:45–57. http://dx.doi.org/10.1111/j.1752-1688.2008.00288.x. Phillips, P.J., Chalmers, A.T., Gray, J.L., Kolpin, D.W., Foreman, W.T., Wall, G.R., 2012. Combined sewer overflows: an environmental source of hormones and wastewater micropollutants. Environ. Sci. Technol. 46:5336–5343. http://dx.doi.org/10.1021/ es3001294. Price, C.A., Lee, H.-S., 2013. Changes in participants' scientific attitudes and epistemological beliefs during an astronomical citizen science project. J. Res. Sci. Teach. 50: 773–801. http://dx.doi.org/10.1002/tea.21090. Stepenuck, K.F., Wolfson, L.G., Liukkonen, B.W., Iles, J.M., Grant, T.S., 2011. Volunteer monitoring of E. coli in streams of the upper Midwestern United States: a comparison of methods. Environ. Monit. Assess. 174:625–633. http://dx.doi.org/10.1007/s10661010-1483-7. Thornhill, I., Loiselle, S., Lind, K., Ophof, D., 2016. The citizen science opportunity for researchers and agencies. Biosci. Adv. Access. http://dx.doi.org/10.1093/biosci/biw089. Trumbull, D.J., Bonney, R., Bascom, D., Cabral, A., 2000. Thinking scientifically during participation in a citizen-science project. Sci. Educ. 84:265–275. http://dx.doi.org/10. 1002/(SICI)1098-237X(200003)84:2b265::AID-SCE7N3.0.CO;2-5.
Please cite this article as: Farnham, D.J., et al., Citizen science-based water quality monitoring: Constructing a large database to characterize the impacts of combined sewer overfl..., Sci Total Environ (2016), http://dx.doi.org/10.1016/j.scitotenv.2016.11.116