Classification in Graphs using Discriminative Random Walks
Semi-supervised learning, large graphs, betweenness measure, passage times J´ erˆ ome Callut Kevin Fran¸ coisse Marco Saerens UCL Machine Learning Group (MLG) Louvain School of Management, IAG, Universit´e catholique de Louvain, B-1348 Louvain-la-Neuve, Belgium
[email protected] [email protected] [email protected]
Pierre Dupont UCL Machine Learning Group (MLG) Department of Computing Science and Engineering, INGI, Universit´e catholique de Louvain, B-1348 Louvain-la-Neuve, Belgium
[email protected]
Abstract This paper describes a novel technique, called D-walks, to tackle semi-supervised classification problems in large graphs. We introduce here a betweenness measure based on passage times during random walks of bounded lengths in the input graph. The class of unlabeled nodes is predicted by maximizing the betweenness with labeled nodes. This approach can deal with directed or undirected graphs with a linear time complexity with respect to the number of edges, the maximum walk length considered and the number of classes. Preliminary experiments on the CORA database show that D-walks outperforms NetKit (Macskassy & Provost, 2007) as well as Zhou et al’s algorithm (Zhou et al., 2005), both in classification rate and computing time.
cation of individuals in social networks, linked documents (e.g. patents or scientific papers) categorization or protein function prediction, to name a few. Even when the data are not naturally structured as a graph, it can be convenient to build a neighborhood graph of similar examples from an affinity matrix.
Mining and learning problems involving structured data such as graphs, trees or sequences have received much attention recently. This paper is concerned with semi-supervised classification of nodes in a graph. Given an input graph with some nodes being labeled, the problem is to predict the missing node labels. This problem has numerous applications such as classifi-
Several approaches have been proposed to tackle semisupervised classification problems in graphs. Kernel methods (Zhou et al., 2005; Tsuda & Noble, 2004) embed the nodes of the input graph into an Euclidean feature space where decision boundaries can be estimated. In general, these techniques cannot easily scale up to large problems due to their high time complexity. Nevertheless, they obtain good results on problems of moderate size. NetKit (Macskassy & Provost, 2007) is an alternative approach which has been recently proposed. This general network learning framework builds a model based on three components: a local classifier to generate class-priors, a relational classifier which takes advantage of the relations in the network to guess the class membership and a collective inferencing component further refines the class predictions. The main advantage of this framework is that each of the three components can be instantiated with various existing methods making it easily adaptable to many situations. This flexibility comes however with a timeconsuming tuning process to optimize performance. Compared to the above mentioned kernel methods, it provides good performance while having a lower time complexity.
Preliminary work. Under review by the International Workshop on Mining and Learning with Graphs (MLG). Do not distribute.
The approach proposed in this paper, called D-walks, relies on random walks performed on the input graph seen as a Markov chain. More precisely, a betweenness
1. Introduction
Discriminative Random Walks
measure, based on passage times during random walks of bounded length, is derived for each class (or label category). Unlabeled nodes are assigned to the category for which the betweenness is the highest. The D-walks approach has the following properties: (i) it has a linear time complexity with respect to the number of edges, the maximum walk length considered and the number of classes; such a low complexity allows to deal with very large graphs, (ii) it can handle directed or undirected graphs, (iii) it can deal with multi-class problems and (iv) it has a unique hyper-parameter that can be tuned efficiently. This paper is organized as follows: section 2 introduces the D-walks approach for semi-supervised classification in graphs and section 3 shows some experimental results obtained with the proposed technique applied to real-life data.
2. Discriminative random walks We are given an input graph G = (N , E), where N is the set of nodes and E is the set of edges. In the sequel, n = |N | denotes the number of nodes and m = |E| the number of edges in the graph. Let also A denote the n × n adjacency matrix of G. Since the graph G may be directed and weighted, the matrix A is not necessarily symmetric nor binary. The graph G is assumed partially labeled. The nodes in the labeled set L ⊂ N are assigned to a category from a discrete set Y. The unlabeled set is defined as U = N \ L. The label of a node q ∈ L is written yq and Ly denotes the set of nodes in class y, with ny = |Ly |. Random walks in a graph can be modeled by a discrete-time Markov chain {Xt ∈ N }t∈N (MC) describing the sequence of nodes visited during the walk. The random variable Xt represents the state of the MC reached at the discrete time index t. Since each state of the Markov chain corresponds to a distinct node of the graph, the state set of the MC is simply the set of nodes N . The terms nodes and states are thus used interchangeably in this paper. The transition probability to state q 0 at time t + 1, given that the current state is q at time t, is defined as: aqq0 . (1) P [Xt+1 = q 0 | Xt = q] = pqq0 , P 0 0 q ∈N aqq Thus, from any state q, the (homogeneous) probability to jump to state q 0 is proportional to the weight aqq0 of the edge from q to q 0 . These transition probabilities are conveniently stored in a n × n row-stochastic transition matrix P = {pqq0 }q,q0 ∈N . We consider discriminative random walks (D-walks,
for short) in order to define a betweenness measure used for classifying unlabeled nodes. A D-walk is a random walk starting in a labeled node and ending when any node having the same label (possibly the starting node itself) is reached for the first time. Definition 1 (D-walk) Given a MC defined on the state set N , a class y ∈ Y and a discrete length l > 1, a D-walk is a sequence of state q0 , . . . , ql such that yq0 = yql = y and yqt 6= y for all 0 < t < l. The notation Dly refers to the set of all D-walks of length l, starting and ending in a node of class y. We y also consider D≤L referring to all limited D-walks up to a given length L. The betweenness function BL (q, y) measures how much a node q ∈ U is located “between” nodes of class y ∈ Y. The betweenness BL (q, y) is formally defined as the expected number of times node y q is reached during D≤L -walks. Definition 2 (D-walk betweenness) Given an unlabeled node q ∈ U and a class y ∈ Y, the D-walk betweenness function U × Y → R+ is defined as foly lows: BL (q, y) , E [pt(q) | D≤L ], where pt(q) is the passage times function N → R+ counting the number of times a node q has been visited. This betweenness measure is related to the one proposed by Newman in (Newman, 2005). Our measure is however relative to a specific class y rather than to the whole graph. It also considers random walks up to a given length instead of unbounded walks. Bounding the walk length has two major benefits: (i) better results are generally obtained with respect to unbounded walks1 , as enforcing a certain degree of locality improves discrimination between classes (ii) the betweenness measure can be computed very efficiently. The betweenness computation relies on forward and backward variables, similar to those used in the BaumWelch algorithm for HMM parameter estimation (Rabiner & Juang, 1993). Given a state q ∈ N and a time t ∈ N0 , the forward variable αy (q, t) computes the probability to reach state q after t steps without passing through2 nodes in class y, while starting initially from any state in class y. The forward variables α’s are computed using the recurrence (2). 1 The optimal walk length estimated with crossvalidation (see section 3) is generally falling between 6 and 30, depending on the considered graph. 2 In contrast with leaving from a node q, passing through q means to jump from some node q 0 to q and then to leave from q.
Discriminative Random Walks
q 0 ∈N \Ly
αy (q 0 , t − 1) pq0 q (2)
Given a state q ∈ N and a time t ∈ N0 , the backward variable β y (q, t) computes the probability that state q is attained by the process t steps before reaching any node labeled y for the first time. The backward variables β’s are computed using the recurrence (3).
(t = 1) β y (q, 1)
=
P
q 0 ∈Ly
pqq0
β y (q 0 , t − 1) pqq0 (3) The time complexity of the forward and backward recurrences is Θ(mL), where m is the number of edges and L is the maximal walk length considered. (t ≥ 2)
β y (q, t)
=
P
q 0 ∈N \Ly
The betweenness measure follows from the computation of the forward and backward variables: PL Pl−1 y y t=1 α (q, t)β (q, l − t) BL (q, y) = l=1 (4) PL P y 0 l=1 q 0 ∈Ly α (q , l) By rearranging adequately the sums in the numerator of equation (4), the time complexity of the betweenness computation for all unlabeled nodes is O(nL). The time complexity for computing the betweenness with respect to all classes is thus Θ(|Y|mL) as, for each class, the computation time is dominated by the cost of the recurrence computations. Finally, an unlabeled node q ∈ U is assigned to the class with the highest betweenness: yˆq = arg max BL (q, y)
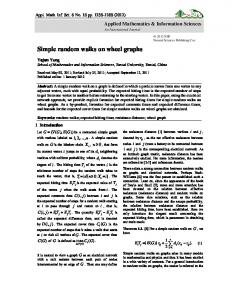
Classification rate on the CORA dataset 0.90
P
0.85
=
0.80
αy (q, t)
(t ≥ 2)
q 0 ∈Ly
hyper-parameters of each approach have been tuned using ten-fold cross-validation. For the D-walks approach, the unique hyper-parameter to tune is L (optimal L values typically fall between 6 and 30 on this dataset, showing the interest of bounding the walk length) whereas Zhou et al. approach also needs one smoothing parameter to be tuned. The three components of NetKit have been instantiated with the default choice present in the framework: a weighted-vote for the relational classifier and a relaxation labeling for the collective inference component. Figure 1 shows the correct classification rate on test data obtained by each approach for increasing labeling rates. The Dwalk approach clearly outperforms its competitors on these data. The D-walks approach is also the fastest method. It requires typically 1.5 seconds of CPU4 for every graph classification including the auto-tuning of its hyper-parameter L. NetKit takes about 4.5 seconds per graph classification and our implementation of Zhou et al. approach typically takes several minutes. A larger graph of 7,590 nodes and 18,696,340 edges has been successfully classified in about 11 minutes with the D-walks approach whereas neither NetKit nor Zhou et al. methods can be applied to such a large graph due to memory and time constraints on a standard PC4 .
0.75
=
1 0 ny p q q
Classification Rate
(t = 1) αy (q, 1)
P
(5) 0.70
y∈Y
3. Experiments We report here preliminary experiments performed on the Cora dataset (Macskassy & Provost, 2007) containing 3582 nodes classified under 7 categories. As this graph is fully labeled, node labels were randomly removed and used as test set. More precisely, we have considered 9 labeling rates3 : {0.1, 0.2, . . . , 0.9} and for each rate, 10 independent runs were performed. Comparative performances obtained with NetKit (Macskassy & Provost, 2007) and with the approach of Zhou et al. (Zhou et al., 2005) are also provided. The 3 The labeling rate is the proportion of labeled nodes in the graph.
D−Walk NetKit Zhou et al. 0.2
0.4
0.6
0.8
Labeling rate
Figure 1. Classification rate of D-walk and two competing methods on the Cora dataset. Error bars report standard deviations over 10 independent runs.
References Macskassy, S. A., & Provost, F. (2007). Classification in networked data: A toolkit and a univariate case 4
Intel Core 2 Duo 2.2Ghz with 2Gb of virtual memory.
Discriminative Random Walks
study. J. Mach. Learn. Res., 8, 935–983. Newman, M. (2005). A measure of betweenness centrality based on random walks. Social networks, 27, 39–54. Rabiner, L., & Juang, B.-H. (1993). Fundamentals of speech recognition. Prentice-Hall. Tsuda, K., & Noble, W. S. (2004). Learning kernels from biological networks by maximizing entropy. Bioinformatics, 20, 326–333. Zhou, D., Huang, J., & Sch¨ olkopf, B. (2005). Learning from labeled and unlabeled data on a directed graph. ICML ’05: Proceedings of the 22nd international conference on Machine learning (pp. 1036– 1043). New York, NY, USA: ACM.