Mousa K. WALI1, M. MURUGAPPAN1, R. BADLISHAH AHMAD1 School of Computer Engineering, University Malaysia Perlis
Classification of Driver Drowsiness Level using Wireless EEG Abstract. In this work, wireless Electroencephalogram (EEG) signals are used to classify the driver drowsiness levels (neutral, drowsy, high drowsy and sleep stage1) based on Discrete Wavelet Packet Transform (DWPT). Two statistical features (spectral centroid, and power spectral density) were extracted from four EEG frequency bands (delta, theta, alpha, and beta) using Fast Fourier Transform (FFT). These features are used to classify the driver drowsiness level using three classifiers namely, subtractive fuzzy clustering, probabilistic neural network, and K nearest neighbour. Results of this study indicates that the best average accuracy of 84.41% is achieved using subtractive fuzzy classifier based on power spectral density feature extracted by db4 wavelet function. Streszczenie. W artykule zaprezentowano możliwość wykorzystania dyskretnej transformaty falkowej do analizy sygnału elektroencefalografii w badaniach senności kierowcy. Parametry statystyczne sygnału analizowano z wykorzystaniem dyskretnej transformaty Fouriera. Stwierdzono że najlepsza dokładność uzyskuje się stosując klasyfikator rozmyty i funkcję falkową db4. (Badania senności kierowcy na podstawie sygnału EEG)
Keywords: Discrete Wavelet Transform, EEG, Fast Fourier Transform, Fuzzy inference system. Słowa kluczowe: in the case of foreign Authors in this line the Editor inserts Polish translation of keywords.
Introduction National Sleep Foundation documented in 2002 that, 51% of drivers were in drowsiness state and 17% entered sleep mode during long distance driving [1]. In Europe countries, 150000 casualties and 50000 deaths of people are reported over a period of one year [2]. In general, 20% of all road accidents are mainly due to driver hypo-vigilance [3]. Drowsiness can be detected either by using physiological signals, physical behaviours of driver (head position, eye blinking and movement) and performance behaviour [4,5]. Among the different types of physiological signals such as (Electroencephalography (EEG), Electromyography (EMG), Electrooculography (EOG), Electrocardiography (ECG), Skin Conductance (SC), Heart Rate Variability (HRV)), EEG plays a vital role on efficiently tracking the minute changes in brain activity during different levels of drowsiness [6]. Subasi et.al achieved a 92% discrimination rate between alert, drowsy and sleep, based on extraction wavelet coefficients from the wavelet scales that contain the frequencies of alpha, delta, theta and beta bands [7]. Tsai et al. design a real time system which can discriminate alertness from drowsiness with accuracy 79.1% and 90.91% respectively, based on two new features; integral of EEG and zero crossings, as the input to a back propagation neural network [6]. Torbjorn et al. used EEG, EOG, and EMG to identify sleep stages (1, 2, 3, 4) [8]. This present work has three objectives: (1) to determine the best statistical feature for classifying the drowsiness levels, (2) to select the optimal wavelet function for determining the better classification accuracy from the features of delta, theta, alpha, and beta bands, (3) to determine the suitable classifier which gives better average and individual classification rate. In this work, virtual reality (VR) based environment has been designed to create a driving environment as similar to the real-world driving in our laboratory. All the subjects are asked to drive the car for 1 hour in a monotonous manner with a maximum speed of 70 km/hour to induce the drowsiness on the subjects. This work aim is to classify four different states of drowsiness such as, drowsy, high drowsy, sleep stage1 and neutral using two statistical features (spectral centroid, and power spectral density (PSD)). Discrete Wavelet Packet Transform (DWPT) with four different wavelet functions were used to derive the statistical features and classified using three nonlinear classifiers (K Nearest Neighbour (KNN), fuzzy subtractive clustering and probabilistic neural network (PNN)).
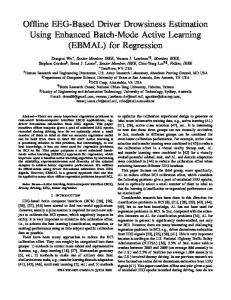
Data Acquisition Figure 1 shows a simulated environment of real driving in one of our university laboratory based on simulation driving software. In this work, 50 subjects (43 Males and 7 Females) in the age range of 24 years to 34 years participated. Emotive EEG system is used to acquire the EEG signals over the complete scalp through 14 electrodes (FP1, FP2, F7, F8, F3, F4, T7, T8, P7, P8, O1, O2, A1, & A2 at a sampling frequency of 128 Hz and band pass filtered between 0.05 Hz and 60 Hz. Infrared camera had been used to capture the driver face image for data validation after finishing the experiment. According to the literature, most of the human being feels sleepy during 1 am to 3 am and 3 pm to 5 pm. These timing factors have already been investigated by several researchers on drowsiness level detection using EEG signals. In the case of subject who is driving the car at a constant speed of 70 km/hour in the monotonous road over longer time duration might induce sleepiness on the subject. Hence, this present experiment is conducted on the above said timings and all the subjects should not sleep more than six hours on last night and asked them not to consume any alcohol/coffee/cigarette before coming to the experiment. The experimental timing and set up highly induces the drowsiness on the subjects. For neutral initialization, before start driving, the subject was initially keep their eyes closed for 2 minutes duration. Followed by another 2 minutes for eyes open. Through this protocol and according to the visual inspection we allocate the subject drowsiness for less than 3 seconds as drowsy state which is under driver control, but if it exceed 3 seconds, then it is considered as high drowsy case which mean the driver in dangerous situation because this period is enough to make accident. However after 10 minutes of sleeping, the subject considered in sleep stage 1 [9].
(a) (b) Fig. 1. Protocol flow (a) Subject in drowsy state (b) Driving car environment
PRZEGLĄD ELEKTROTECHNICZNY, ISSN 0033-2097, R. 89 NR 6/2013
113
Feature Extraction Discrete Wavelet Packet Transform (DWPT) plays a vital role in localizing the frequency bands compared to other methods [10-12]. In this work, the statistical features from the EEG signals for different drowsiness levels are derived from four frequency bands, namely delta (δ), theta (θ), alpha (α) and beta (β). The mother wavelet function (Ψ) can be expressed as given in (1). (1)
b , a (t )
t a b b
1
a,b ∈ R,b≠0
where a, b ∈ R, a>0, and R is the wavelet space. Parameter 'b' is the scaling factor and ‘a’ is the shifting factor. In this work, four different wavelet functions: db4, db8, sym8 and coif5 are used for decomposing the EEG signals into four different frequency bands. These wavelet functions are chosen due to their near optimal time-frequency localization properties. Moreover, the waveforms of these wavelets are similar to the waveforms to be detected in the EEG signal. Therefore, extraction of EEG signals features are more likely to be successful [13]. However, wavelet can also be designed to match any event waveform that is desired by implementing direct design technique with Meyer wavelets. The extracted wavelet coefficients provide a compact representation that shows the energy distribution of the EEG signal in time and frequency [14]. Amplitude Spectrum The frequency spectrum can be generated via a Fourier transform of the signal, and the resulting values are usually presented as amplitude and phase, both plotted versus frequency. In this work, the average amplitude of the FFT output of EEG bands wavelet transformed is used to derive two different features namely; spectral centroid, and PSD. Power Spectral Density (PSD) Spectral analysis is the distribution of power over frequency. In medicine, spectral analysis of various signals measured from a patient, such as electrocardiogram (ECG) or electroencephalogram (EEG) signals can provide useful material for diagnosis. A random signal usually has finite average power and, therefore, can be characterized by an average power spectral density as in Eqn. (2) [15]. (2)
PSDf (w) limT
FXT (w)
2
2T where FX T (w) represent the FFT output. T is the total duration of the input signal. Spectral centroid frequency Spectral centroid (SC) frequency is commonly known as sub band spectral centroid [7, 10]. The Spectral Centroid is used to find the center value of the groups for each frequency bands[12,14]. In this work, SC is used for drowsiness level classification using EEG. The Spectral Centroid (SC) is calculated using formula (3). (3)
SC
wFX T ( w)dw FX T ( w)dw
where w is the angular frequency in radians per second. The Classifiers In this paper, three different classifiers have been used to compare the results of drowsiness classification. In a consequence, a best classifier will be chosen based on highest mean classification rate. (i) Probabilistic Neural Network (PNN): The PNN model is one among the
114
supervised learning networks and has many features in contrast with other networks in the learning processes. The data training set is used to train designed PNN. The PNN is tested with testing data set to show the impact on classification rate. The spread value (σ) of the radial basis function (RBF) was used as a smoothing factor and classifier accuracy was examined with different values of σ. In this work smoothing factor of 0.1 is used to classify the drowsiness level. (ii) K Nearest Neighbor (KNN): KNN classifier algorithm based on Euclidian distance metrics to locate the nearest neighbors. This classifier memorizes all vectors in the training sets and then compared with the test vector. In this work the K nearest neighbor value varies from 2 to 9. The best value of K is chosen based on the highest mean classification rate (iii) Fuzzy subtractive (FS) clustering is a fast, one-pass algorithm for estimating the number of clusters and the cluster centers in a set of data. This technique depends upon the measure of the density of data points in the feature space. The aim is to find area in the feature space with high densities of data points. The point with highest number of neighbors is considered as the center of a specific cluster. The radii variable is a vector of entries between 0 and 1 that specifies a cluster center’s range. Small radii values will generate a few large clusters. Recommended values for radii should be between 0.2 and 0.5. In this work, a value of 0.5 for all the radii was chosen because this lead to fewer membership functions and less computation time, without losing accuracy. Once the inputs for drowsiness levels classification are selected, input membership functions must be determined. The Gaussian membership function is selected since it has continuous derivability. Data Preparation for Classification In this work, 3 sec framing is performed on each state of drowsiness EEG signals and statistical features were extracted. Two statistical features (SC and PSD) were extracted from four different frequency bands (δ, θ, α, β ) over 50 subjects and used for classifying the four drowsiness levels. 60% of this data is used for training and remaining 40% data is used for testing. Results and Discussion The significance of these two features, SC and PSD, are verified based on the Analysis of Variance (ANOVA) test over each wavelet function (db4, db8, sym8, and coif5) on four different drowsiness levels as given in Table 1. . All the results are presented as mean ± SD with "p" values. For db4 wavelet function case, both features after neutral start increasing through the drowsy, high drowsy, and sleep stage 1 with less resources ( p < 0.001) and this indicate that the features are suitable to distinguish these three levels easily. In db8, the features start decreasing in the high drowsy level and increase again at sleep1 level. While for both sym8 and coif5, the features start increasing in the high drowsy level and decrease again in sleep1 with more resources (p = 0.004) for the former and less resources (P < 0.001) for the latter. Hence, among these wavelets, db4 gives a gradual increment in the mean of the features from drowsy to high drowsy and to sleep stage1. In a consequence, db4 wavelet function gives the maximum mean classification rate of 84.41% as given in table 2 using PSD feature for Fuzzy subtractive classifier which its input vectors distribution is shown in Fig. 2. The KNN and PNN classifiers wavelet function produce maximum classification of 70.17% and 60.60%, respectively. The former is based on PSD feature extracted by sym8, while the latter on SC
PRZEGLĄD ELEKTROTECHNICZNY, ISSN 0033-2097, R. 89 NR 6/2013
extracted by db8. Therefore, we considered db4 wavelet function for subsequent analysis. Sensitivity is defined as the proportion of actual positives which are correctly identified as positive, and specificity is the proportion of negatives which are correctly identified as negative. These parameters, namely; accuracy, sensitivity, specificity, true positive rate (TPR), and false negative rate (FNR), can be calculated as in (4, 5, 6, 7, and 8) respectively : TP TN TP TN FP FN
(4)
Accuracy
(5)
Sensitivity
(6)
Specifity
(7)
TPR
(8)
FNR
TP TP FN
TN FP FN
TP TP FP FN FN FP
where TP is true positive, TN is true negative, FP is false positive, and FN is false negative. Table 3 summarizes the classification sensitivity, specificity, TPR, FNR of KNN, PNN, and Fuzzy classifiers using db4 wavelet function. The best performance of classification of 84.41% was achieved by fuzzy using PSD feature with an average sensitivity of 88.63% and specificity of 75.97% with an average PRV of 79.77% and NPR of 71.75%. Therefore, Wavelet Function
db4 wavelet can be considered as the dominant wavelet type for getting good accuracy of classification of different levels of drowsiness based on PSD feature. Table 4 shows the comparison between the maximum mean drowsiness classification rate of the previous researchers work and the present work. From this table, the maximum classification rate of 85% is achieved on classifying two classes [Chin, 2005] and 98.5% is gained on classifying 3 classes [Mehmet , 2008]. However the present recognition system produce maximum mean rate of 84.41% on classifying 4 classes using 50 subjects. Conclusion Most of the research works have been discussed about the classification of driver drowsiness into two levels either (awake or sleep) or (drowsy and non-drowsy) and some on three levels (awake, drowsy, and sleep). Whereas, our proposal towards 4 levels (awake, drowsy, high drowsy, sleep stage 1). This paper presents about amplitude spectrum of the four bands (delta, theta, alpha, and beta) of the EEG signal has been proposed along with the hybrid scheme based on DWT and FFT. Fusions of above two methods give more significant results on extraction of SC, and PSD features under ANOVA analysis. The proposed methodology has been tested on 50 subjects and provides maximum accuracy of 84.41% using db4 and subtractive fuzzy inference system for PSD feature with an average sensitivity of 88.63% % and specificity of 75.97% among three classifiers (KNN, PNN, and subtractive fuzzy) and 4 wavelets (db4, db8, sym8, and coif5).
Table 1. ANOVA test of SC & PSD features over db4, db8, sym8, & coif5 for each drowsiness level. Statistical Neutral Drowsy High-Drowsy Sleep-1 Features
db4
db8
sym8
coif5
P
SC
18.92 ± 31.96
8.94 ± 20.39
29.9 ± 39.26
34.7 ± 39.35
< 0.001
PSD
0.0078 ± 0.0173
0.0026 ± 0.0173
0.0198 ± 0.045
0.344 ± 1.536
< 0.001
SC
6.54 ± 7.44
15.39 ± 25.35
13.98 ± 32.17
19.8 ± 38.45
0.004
PSD
0.002 ± 0.0026
0.0072 ± 0.0173
0.014 ± 0.038
0.036 ± 0.113
0.004
SC
8.98 ± 14.25
8.29 ± 14.92
35.65 ± 45.62
31.18 ± 43.75
< 0.001
PSD
0.0047 ± 0.012
0.0034 ± 0.0054
0.077 ± 0.027
0.317 ± 1.28
< 0.001
SC
22.71 ± 31.48
6.26 ± 11.08
15.15 ± 26.51
2.009 ± 11
0.008
PSD
0.243 ± 1.25
0.019 ± 0.084
0.017 ± 0.037
0.0025 ± 0.0134
0.008
Table 2. Classification accuracy of different classifiers for different wavelets over 4 drowsiness levels for both two features Avg. Classification Neutral Low Medium High Wavelet Statistical Rate Function Features SC PSD SC PSD SC PSD SC PSD SC PSD db4 Fuzzy
db8 sym8 coif5 db4
PNN
db8 sym8 coif5 db4
KNN
db8 sym8 coif5
73.67
84.33
81.32
83.39
76.36
87.86
76.49
82.07
76.96
84.41
74.29
71.55
79.00
74.80
93.25
87.34
75.23
79.37
80.44
78.26
72.27
91.51
73.72
84.88
90.09
84.18
72.95
75.43
77.26
84.00
77.23
75.60
81.69
71.93
84.78
92.36
79.96
80.88
80.91
80.19
61.16
64.98
75.58
72.93
58.13
40.52
58.41
34.52
52.54
53.24
68.31
60.76
65.85
34.63
71.40
72.35
36.85
38.03
60.60
51.44
66.54
82.05
66.89
54.06
61.58
61.16
35.96
41.08
57.74
59.59
62.64
63.51
68.12
34.57
70.22
62.95
35.15
35.73
59.03
49.19
40.13
45.94
45.44
82.93
66.74
75.47
65.85
71.39
54.54
68.93
35.84
42.67
39.49
60.54
85.50
85.31
69.17
67.79
57.50
64.08
76.63
62.18
34.99
38.62
80.81
77.45
64.51
64.43
54.73
70.17
65.13
35.73
48.76
41.33
78.03
80.68
68.69
60.76
59.20
60.58
PRZEGLĄD ELEKTROTECHNICZNY, ISSN 0033-2097, R. 89 NR 6/2013
115
Fig. 2.The distribution of the input vectors to the Fuzzy classifier over 4 drowsiness levels based on Fuzzy classifier (a) 120 training (b) 80 testing vectors Table 3. Classification results of KNN, PNN, FUZZY classifiers over 4 drowsiness levels based on db4 using SC & PSD features. Drowsiness Statistical feature and Levels Classifier % CR SEN. SPEC. TPR FNR SC Awake PSD
SC Drowsy PSD
SC High drowsy PSD
SC Sleep1 PSD
SC Average PSD
116
KNN
40.13
42.14
36.12
37.92
34.11
PNN
64.98
68.23
58.49
61.41
55.24
Fuzzy
73.67
77.35
66.30
69.62
62.62
KNN
45.94
48.23
41.34
43.41
39.05
PNN
75.58
79.35
68.02
71.42
64.24
Fuzzy
84.33
88.55
75.90
79.69
71.68
KNN
45.44
47.71
40.90
42.94
38.62
PNN
72.93
76.58
65.64
68.92
61.99
Fuzzy
81.32
85.39
73.19
76.85
69.12
KNN
82.93
87.07
74.63
78.37
70.49
PNN
58.13
61.04
52.32
54.93
49.41
Fuzzy
83.39
87.56
75.05
78.80
70.88
KNN
66.74
70.07
60.06
63.07
56.73
PNN
40.52
42.54
36.46
38.29
34.44
Fuzzy
76.36
80.18
68.72
72.16
64.91
KNN
75.47
79.25
67.92
71.32
64.15
PNN
58.41
61.33
52.57
55.19
49.65
Fuzzy
87.86
92.26
79.08
83.03
74.68
KNN
65.85
69.15
59.27
62.23
55.97
PNN
34.52
36.25
31.07
32.62
29.34
Fuzzy
76.49
80.31
68.84
72.28
65.01
KNN
71.39
74.96
64.25
67.46
60.68
PNN
52.54
55.17
47.29
49.65
44.66
Fuzzy
82.07
86.17
73.86
77.56
69.76
KNN
54.54
57.27
49.09
51.54
46.36
PNN
53.24
55.90
47.91
50.31
45.25
Fuzzy
76.96
80.81
69.26
72.73
65.42
KNN
68.93
72.38
62.04
65.14
58.59
PNN
61.16
64.22
55.05
57.80
51.99
Fuzzy
84.41
88.63
75.97
79.77
71.75
PRZEGLĄD ELEKTROTECHNICZNY, ISSN 0033-2097, R. 89 NR 6/2013
Table 4. Comparison of maximum mean drowsiness classification rate of present work with that of earlier work Refreence Physoligical Database Feature Classifier % Signal Extraction Accuracy [Chin, 2005]
[Rakesh, 2008] [Mehmet , 2008]
[Hong, 2010] Present work
EEG, EOG
ECG,
16 Subjects 33 Channels
FFT
linear Regression Model 2 Class
85
EEG, EMG
EOG,
5 Subjects 33 Channels
FFT
BPNN 3 Classes
95
EEG, EMG
30 Subjects 2 Channels
WT
BPNN 3 Classes
98.5
EEG
5 Subjects 64 Channels
WT
sparse representation method 3 Classes
94.2
EEG
50 Subjects 14 Channels
WT+FFT
Fuzzy 4 Classes
REFERENCES [1] Lyznicki M.J., Doege C.T., Davis M.R., Williams A.W., “Sleepiness, driving, and motor vehicle crashes,” JAMA, 279(23):1908-1913, 1998. [2] Horne A.J., Reyner A.L., “Sleep-related vehicle accidents,” British Medical Journal, 310:565-567, 1995. [3] McCartt T.A., Ribner A.S., Pack A.I., Hammer C.M., “The scope and nature of the drowsy driving problem in New Youk State, “ Accident Analysis and Prevention, 28 (4):511-517, 1996. [4] Hayami T. , Matsunaga K., Shidoji K., Matsuki Y., “Detecting Drowsiness While Driving by Measuring Eye Movement-A Pilot th Study,” in Proc. 5 Internation Conference on Intelligent Transportation Systems, Singapore, 2002, pp. 156-161. [5] HamadaT., Adachi K., Nakano T., Yamamoto S., “Detecting Method for Drivers’ Drowsiness Applicabel to Individual Features,” In Proc. 2003 Intelligent Transportation Systems, Vol. 2, 2003, pp 1405-1410. [6] Tsai P., Weichih H., Kuo B.J., Shyu L., “A Portable Device for Real Time Drowsiness Detection Using Novel Active Dry Electrode System,” In Proc. 2009 International Conference of the IEEE EMBS Minneapolis, Minnesota, USA, 2009, September 2-6. [7] Subasi A., “Automatic recognition of alertness level from EEG by using neural network and wavelet coefficients,”Expert Systems with Applications, 28, pp. 701–711, 2005. [8] Torbjorn A., Peter M., Kecklund G., “ Sleep and Recovery” Current Perspectives on Job-Stress Recovery Research in Occupational Stress and Well Being, by Emerald Group Volume 7, 2009, 205–247. [9] Carskadon, MA, Dement WC, Monitoring and staging human sleep. In M.H. Kryger, T. Roth, & W.C. Dement (Eds.), Principles and practice of sleep medicine, 5th edition, (pp 1626). St. Louis: Elsevier Saunders, 2011.
84.41
[10] Murugappan M., Nagarajan R., Yaacob S., “Comparison of Different Wavelet Features fromEEG Signals for Classifying Human Emotions”, IEEE Symposium on Industrial Electronics and Applications Kuala Lumpur, Malaysia, October 4-6, 2009. [11] Acharya U.R., Oliver F., VinithaSree S., Chuan A., ”Atheromatic Symptomatic vs. Asymptomatic Classification Of Carotid Ultrasound Plaque using a combination of HOS, DWT &Texture”,EMBS Boston Conference 2011 [12] Wali K.M., Murugappan M., Badlishah A., Zheng B.,”Development of Discrete Wavelet Transform (DWT) Toolbox for Signal Processing Applications”,2012 International Conference on Biomedical Engineering (ICoBE),,Penang, Malaysia,27-28 February 2012. [13] Glassman, E. L., "A wavelet-like filter based on neuron action potentials for analysis of human scalp electroencephalographs." Biomedical Engineering, IEEE Transactions on, 52(11), 1851-1862. 2005. [14] Rizon M., Murugappan M., Nagarajan R., Yaacob S.,”Asymmetric Ratio and FCM based Salient Channel Selection for Human Emotion Detection Using EEG”,WSEASTransactions on signal processing, Issue 10, Volume 4, October 2008. [15] HEKIM M.,” ANN-based classification of EEG signals using the average power based on rectangle approximation window”, Electrical Review, 88, 2012. . Authors: Mousa K. Wali PhD Student, School of Computer Eng., University Malaysia Perlis (Unimap), Perlis, Malaysia. E-mail:
[email protected].. E-mail:
[email protected]. Dr M. Murugappan E-mail:
[email protected]. Prof Dr. R. Badlishah Ahmad The correspondence address is: e-mail:
[email protected]
PRZEGLĄD ELEKTROTECHNICZNY, ISSN 0033-2097, R. 89 NR 6/2013
117