environments Article
Classification of Land Use on Sand-Dune Topography by Object-Based Analysis, Digital Photogrammetry, and GIS Analysis in the Horqin Sandy Land, China Takafumi Miyasaka 1, *, Toshiya Okuro 2 , Xueyong Zhao 3 and Kazuhiko Takeuchi 4 1 2 3 4
*
Institute of Agriculture, Tokyo University of Agriculture and Technology, 3-5-8 Saiwai-cho, Fuchu-shi, Tokyo 183-8509, Japan Graduate School of Agricultural and Life Sciences, The University of Tokyo, 1-1-1 Yayoi, Bunkyo-ku, Tokyo 113-8657, Japan;
[email protected] Cold and Arid Regions Environmental and Engineering Research Institute, Chinese Academy of Sciences, 260 Donggang West Road, 730000, Lanzhou, China;
[email protected] Integrated Research System for Sustainability Science, The University of Tokyo, 7-3-1 Hongo, Bunkyo-ku, Tokyo 113-8654, Japan;
[email protected] Correspondence:
[email protected]; Tel.: +81-42-367-5754
Academic Editor: Teiji Watanabe Received: 1 May 2016; Accepted: 5 July 2016; Published: 12 July 2016
Abstract: Previous field research on the Horqin Sandy Land (China), which has suffered from severe desertification during recent decades, revealed how land use on a sand-dune topography affects both land degradation and restoration. This study aimed to depict the spatial distribution of local land use in order to shed more light on previous field findings regarding policies on a broader scale. We performed the following analyses with Panchromatic Remote-sensing Instrument for Stereo Mapping (PRISM) and Advanced Visible and Near Infrared Radiometer type 2 (AVNIR-2) images of Advanced Land Observing Satellite (ALOS): (1) object-based classification to discriminate preliminary classification of land-use types that were approximately differentiated by ordinary pixel-based analysis with spectral information; (2) digital photogrammetry to generate a digital surface model (DSM) with adequately high accuracy to represent undulating sand-dune topography; (3) geographic information system (GIS) analysis to classify major topographic types with the digital surface model (DSM); and (4) overlay of the two classification results to depict the local land-use types. The overall accuracies of the object-based and GIS-based classifications were high, at 93% (kappa statistic: 0.84) and 89% (kappa statistic: 0.81), respectively. The resultant local land-use map represents areas covered in previous field studies, showing where and how land degradation and restoration are likely to occur. This research can contribute to future environmental surveys, models, and policies in the study area. Keywords: cropland; Digital Elevation Model (DEM); Inner Mongolia; landform; livestock exclusion; object-oriented analysis; pastureland; remote sensing; Sloping Land Conversion Program (SLCP); tree plantation
1. Introduction Desertification and land degradation are globally recognized environmental problems but also strongly localized phenomena. One of the major causes of land degradation is unsustainable use of scarce natural resources by local land users, such as over-grazing and over-cultivation [1]. The absence of widespread degradation does not necessarily mean that no degradation is occurring [2]; land degradation advances in a spatially heterogeneous manner on the basis of a mosaic of non-uniform physical land conditions and human activities. The spatial distribution of local land use, as well as Environments 2016, 3, 17; doi:10.3390/environments3030017
www.mdpi.com/journal/environments
Environments 2016, 3, 17
2 of 11
physical land cover, needs to be observed in order to assess the present and potential land degradation, and to design appropriate policies and plans. Rapid advancement in remote sensing technologies has enabled the monitoring of land use and cover in more efficient, comprehensive ways. In particular, algorithms for image classification have made great progress in recent decades [3]. However, land-use classification is not as straightforward as land-cover classification. Land cover is defined by the physical attributes of the earth’s surface, whereas land use is defined as the purposes for which humans exploit the land cover [4]. These definitions suggest that land cover can be directly observed by remote sensing, while land use requires socioeconomic interpretation. Although a number of works have addressed the automatic identification of land use from remotely sensed data [5], depicting land-use information is still one of the most challenging parts of a classification process and requires auxiliary data and significant post-classification analysis [6]. To depict land uses, it is crucial to consider a target area’s unique circumstances. It is often the case, however, that little is known about detailed land-use distribution in various local contexts [7]. The Horqin Sandy Land, in northeast China, has suffered from severe desertification in recent decades, mainly due to inappropriate agro-pastoral land use. This area is characterized by its undulating sand-dune landscape, which is a dynamic environment determined by wind erosion, sand accumulation, and dune encroachment. Sand-fixing (stabilization) measures, such as livestock exclusion and tree planting, have been implemented here for land restoration since the mid-1970s [8]. Previous field studies have found that the sand-dune topography is a critical factor for characterizing both land degradation and restoration in the area. The local topography is classified into three types: lowlands, flat sandy lands, and sand dunes (sloping sandy lands) [9]. When people graze their livestock or execute restoration measures, the extent of land degradation or restoration brought about by those activities differs significantly depending on the topographic type [9–14]. In addition, Miyasaka et al. [15] found that local cropland types—What crop species is typically planted and how—are determined largely on the basis of topographic types, and the patterns of land degradation vary significantly with the types of cropland. It therefore needs to be shown how the land-use types—such as pasture, cropland, and tree plantations—are spatially distributed on different topographic types, in order to incorporate the field-scale findings on land degradation and restoration into actual policies and planning at a broader scale. Land-use maps have yet to be developed, however, that classify land in sufficient detail to link to the field research in the area. Researchers have demonstrated the progress of land degradation and restoration by identifying desertified land [16–18] or classifying land use or cover types [19,20] on multi-temporal satellite images. Their image analyses, however, were mainly based on spectral information in the images, an approach that cannot adequately distinguish different land-use types that have similar spectral characteristics, or different topographic types within the same land use. Consequently, the spatial distribution of local land-use types with reference to sand-dune topography has never been presented. This paper aims to depict in greater detail the local land-use types examined in relevant previous field surveys in the Horqin Sandy Land. We performed the following analyses with images obtained from the Panchromatic Remote-sensing Instrument for Stereo Mapping (PRISM) and Advanced Visible and Near Infrared Radiometer type 2 (AVNIR-2) of the Advanced Land Observing Satellite (ALOS): (1) Object-based classification to discriminate preliminary classification of land-use types that were approximately differentiated by ordinary pixel-based analysis with spectral information; (2) Digital photogrammetry to generate a digital surface model (DSM) with adequately high accuracy to represent undulating sand-dune topography; (3) GIS analysis to classify major topographic types with the DSM; and (4) overlay of the two classification results to depict the local land-use types.
Environments 2016, 3, 17
3 of 11
2. Materials and Methods 2.1. Study Area The study area is situated in the central part of Naiman County, Inner Mongolia of China (42˝ 55’ N, 120˝ 42’ E). The elevation of the area is approximately 360 m above mean sea level. The region is in a temperate zone with a continental semi-arid monsoon climate, with the highest rainfall occurring in the summer months, and dry and windy conditions prevailing in springtime. The mean annual precipitation is approximately 360 mm, falling mainly between June and August. The mean annual temperature is 6.4˝ C, with the coldest and warmest monthly mean air temperatures in January (´13.1˝ C) and July (23.7˝ C), respectively. The land-use system in the study area can be classified into semi-farming and semi-pastoral. Earlier research has documented adverse effects of the agro-pastoral land use on soil and vegetation and their relation to sand-dune topography. According to Miyasaka et al. [15], there are three typical cropland types: maize cropland on flat sandy land, maize cropland on lowland, and bean-centered cropland on sand dunes. Maize is the preferred crop species because of its high productivity and stable production, but requires large fertilizer inputs and is basically restricted to flatland (i.e., lowland and flat sandy land) where irrigation is possible. On lowland, however, maize can be grown with little or no irrigation thanks to favorable soil moisture conditions. On sand dunes, bean-centered rotational cropping is practiced, with a small amount of fertilizer applied, taking advantage of the ability of legumes to fix nitrogen in the soil. Soil properties and crop biomass are more degraded in cropland types on lowland and sand dunes than on flat sandy land. As for pastoral impacts, Okuro [9] conducted a grazing experiment to examine temporal changes in vegetation and soil properties on flat sandy land and sand dunes under different grazing pressures, and found that degradation of vegetation and soil advanced more rapidly on sand dunes. The government has implemented environmental policies, including the Sloping Land Conversion Program, under which the conversion of degraded cropland to tree plantations is strongly promoted. Many studies have reported that land has been ameliorated by those restoration measures [8,10–14,21–26]. Miyasaka et al. [10] reported that land restoration proceeds in an upward direction, when facilitated by tree or shrub plantations or grazing exclusion, along the topographic gradient on sand dunes. In other words, during the restoration process, flat, lower parts of sand dunes are restored ahead of the other sloping, higher parts. In short, both land degradation and restoration in this area occur heterogeneously because of differences in the agro-pastoral and policy-induced activities in the context of sand-dune topography. We selected two separate sites for analysis in the area, each of which was 2.5 ˆ 6 km in size and belonged to a different village, one in which Mongolian and the other in which Han residents were in the majority. The local people’s livelihoods were strongly related to their ethnic group: livestock farming was carried out by almost every resident in the former, but only by a small number of residents in the latter village. The two research sites reflect land-use variations of Mongolian and Han peoples, who are the major ethnic groups in their much broader surrounding areas. 2.2. Data We used remote-sensing images from two sensors installed on ALOS: PRISM, with 2.5 m spatial resolution, and AVNIR-2, with 10 m spatial resolution (see Tadono et al. [27] for details of these sensors as well as the satellite). Our PRISM images covered two seasons: a level 1B2 summer image (August 2008) for object-based classification, and level 1B1 triplet-stereo winter images (February 2008) for digital photogrammetry to generate the DSM. A level 1B2 AVNIR-2 image observed on the same date as the summer PRISM image was additionally used for object-based classification. The level 1B1 data are radiometrically calibrated, and the level 1B2 data are further geometrically corrected. Moreover, we used the Rational Polynomial Coefficients (RPC) data of the winter PRISM images for accurate triangulation and also GPS data collected by a field survey in 2007 for more accurate
Environments 2016, 3, 17
4 of 11
geometrical rectification of the AVNIR-2 image and the accuracy assessment of classification results, in addition to accurate triangulation. We also carried out a field topographic survey in 2007 to estimate the average slope angle of each topographic type, with the measurements used for topographic classification with the DSM. 2.3. Object-Based Classification of Preliminary Land-Use Types Object-based classification is characterized by an image segmentation process [28]. This process creates image objects by merging pixels, and those objects are used as classification units instead of single pixels. Not only spectral, but also texture, shape, and topological information can be calculated for each object and utilized for classification. Meanwhile, ordinary pixel-based classification uses only spectral information, which results in difficulties dealing with spectral ambiguities: spectral similarities between different land use/cover types and spectral heterogeneity within each land use/cover type [29]. The difficulties often result in inconsistent salt-and-pepper classification results (with individual pixels classified differently from their neighbors), particularly with high-resolution data including PRISM images. We therefore employed object-based classification in the present study. Using eCognition 4.0, we first segmented the summer PRISM image on the basis of the following parameters: scale, color, and shape. The scale parameter determines the maximum allowed heterogeneity for the resulting image objects. It serves as the threshold that terminates the segmentation algorithm, thereby controlling the relative size of image objects. That heterogeneity is a mixture of spectral heterogeneity measured by the color parameter and shape heterogeneity measured by the shape parameter; the shape parameter is further broken into smoothness and compactness parameters. More details of those parameters, including their mathematical expressions, are found in Baatz et al. [30] and Benz et al. [28]. Since there are no general methods to automatically determine appropriate parameters [31], we set them by trial and error as follows: scale, 90; color, 0.9; shape, 0.1; smoothness, 0.5; and compactness, 0.5. We adopted the nearest-neighbor classification for the segmented image objects and set six preliminary land-use classes: maize cropland, bean-centered cropland, paddy, pastureland, unused land (i.e., shifting sand dunes, where pasture productivity is extremely low), and tree plantation. Before carrying out classification, we performed feature space optimization [32] to find the best combination of the following candidate information for classification: spectral information {band 1, band 2, band 3, band 4, band 1–2 (the difference between bands 1 and 2), band 1–3, band 1–4, band 2–3, band 2–4, band 3–4, and Normalized Difference Vegetation Index (NDVI) derived from the AVNIR-2 image}, texture information (contrast, correlation, dissimilarity, entropy, homogeneity, angular second moment, and standard deviation) derived from the gray level co-occurrence matrix [33], and shape information (compactness, rectangular fit, and shape index) [30]. We computed the means of Euclidean spectral distances between the six classes plotted in feature spaces for every combination of the information. The combination that had the maximum mean value was selected as the best, and used for classification. We also performed maximum-likelihood classification, which is a typical pixel-based method, using the same data for comparison with ERDAS Imagine 8.7. 2.4. Generation of Digital Surface Model (DSM) We generated the DSM from the triplet stereo PRISM images with the RPC and field-collected GPS data using Leica Photogrammetry Suite 9.1 in the following ordinary workflow: (1) Interior and exterior orientation through triangulation using bundle block adjustment, (2) The generation of mass points by image matching and space forward intersection, (3) The creation of a Triangulated Irregular Network (TIN) model from the mass points using the Delaunay triangulation, and (4) the generation of the DSM with 15 m spacing by the interpolation of the TIN model. These procedures are detailed in Leica Geosystems [34].
Environments 2016, 3, 17
5 of 11
2.5. GIS-Based Classification of Sand-Dune Topography We classified topography with the DSM by GIS analysis into lowlands, flat sandy lands, and sand dunes. Lowlands were located along a river on a valley floor and could be visually distinguished on images. Hence we first depicted lowlands by applying the image segmentation technique with the same parameter setting as above to the summer PRISM image and the DSM. A slope image was then generated from the DSM and was divided into flat and slope areas using an empirically determined threshold of slope angle (2 degrees). The divided flat area included not only flat sandy lands but also relatively large dune crests. Such dune crests, however, needed to be grouped in sand dunes from the perspective of their topographic characteristics, e.g., lower groundwater levels and high erodibility. We thus applied the following methods to identify the dune crests from the flat area: (1) Grouped contiguous pixels within eight neighborhood pixels in the flat-area image and polygonized those patches; (2) Generated a one-pixel-wide doughnut-shaped buffer around each patch and calculated the mean elevation value within each patch (patch value) and buffer (buffer value); and (3) compared the patch value and the surrounding buffer value, and the patch whose value was higher than the buffer value was separated as a dune crest. Finally, the slope and dune-crest areas were integrated into sand dunes. The DSM was consequently classified into lowlands, flat sandy lands, and sand dunes. The above analysis was conducted using eCognition 4.0 and ArcGIS 9.1. 2.6. Depiction of Local Land-Use Types We overlaid the results of the object-based and GIS-based classifications and produced a local land-use map. The resultant map can technically have 18 classes (including untypical or unrealistic combinations): 6 preliminary land-use classes in each of 3 topographic types. We assumed that “bean-centered cropland on lowland” and “bean-centered cropland on flat sandy land” were part of “maize cropland on lowland” and “maize cropland on flat sandy land”, respectively. This is because in maize cropland other crops including some kinds of bean are also occasionally planted to avoid soil problems caused by continuous cropping of maize every year [15]. We also deemed “maize cropland on sand dunes” to be “untypical maize cropland” and “paddy on flat sandy land” and “paddy on sand dunes” to be “N/A” (not applicable), as an unrealistic land-use type in the area. 3. Results and Discussion 3.1. Object-Based Classification of Preliminary Land-Use Types The mean Euclidean spectral distance between the six classes peaked in the following combination of 14 pieces of information: band 1, band 2, band 3, band 4, and NDVI as spectral information; contrast, correlation, dissimilarity, entropy, homogeneity, and standard deviation as texture information; compactness, rectangular fit, and shape index as shape information. Overall accuracy of the object-based classification using the above information was 93% (kappa statistic: 0.84), and that of the pixel-based classification was 78% (kappa statistic: 0.57) (Table 1 and Figure 1). Although the classification accuracies of bean-centered cropland and tree plantations were relatively low, the object-based classification produced an accurate result on the whole. On the other hand, the overall accuracy and kappa statistic of the pixel-based classification were not as high for the object-based classification, and both producer’s and user’s accuracy fluctuated over the classes. In particular, the producer’s accuracy of maize cropland and the user’s accuracy of bean-centered cropland and tree plantations were low. This result suggested that the pixel-based classification tended to fail to detect maize cropland, and instead mistakenly classified it as bean-centered cropland or tree plantation, as shown in Figure 1. If multi-temporal images are available at high temporal resolution, and then crop phenology or land surfaces right before and after harvest can be adequately detected and added as information for classification, the relatively low accuracies found in each classification result could be improved, particularly non-separability between cropland and non-cropland, or even different types of cropland.
Maize cropland 48% 100%
Accuracy measure Producer’s accuracy User’s accuracy Overall Environments 2016,accuracy 3, 17
Bean-centered cropland 75% 24%
Paddy
Pastureland
100% 67%
84% 94%
Unused land 71% 92%
Tree plantation 65% 28%
78%
Kappa statistic
6 of 11
0.57
Figure 1. Subset images of (a) the object-based classification result, (b) the summer Panchromatic Figure 1. Subset images of (a) the object-based classification result, (b) the summer Remote-sensing Instrument for Stereo Mapping (PRISM) data, and (c) the pixel-based classification result. Panchromatic Remote-sensing Instrument for Stereo Mapping (PRISM) data, and (c) the pixel-based classification result.
3.2. Generation of DSM and GIS-Based Classification of Sand-Dune Topography
Table 1. Accuracy of object-based and pixel-based results. The Root Mean Squareassessment Error (RMSE) of triangulation should classification generally not be higher than the pixel size of images used [34]. The RMSE of our triangulation was 0.37 pixels, indicating that the Object-Based Classification accuracy of triangulation achieved a subpixel level. The height accuracy of the generated DSM was Maize Bean-centered Accuracy Paddy Pastureland Unused land Tree of plantation RMSE 2.2 measure m, which aligns with Takaku et al. [37] reporting that the height accuracy the DSM cropland cropland 91% 63% 100% 96% 94% 65% Producer’s accuracy generated from PRISM data in flat areas was approximately 2 m where the slope angles were less User’s accuracy 91% 71% 100% 96% 80% 73% 93% Overall accuracy thanKappa 10 degrees. of topographic types was 89% statistic The overall accuracy of the subsequent classification 0.84 Pixel-Based Classification0.81). Figure 2 shows that the DSM well represents undulating sand-dune (kappa statistic: Accuracy measure Producer’s accuracy User’s accuracy Overall accuracy Kappa statistic
Maize cropland 48% 100%
Bean-centered cropland 75% 24%
Paddy
Pastureland
Unused land
Tree plantation
100% 67%
84% 94%
71% 92%
65% 28%
78% 0.57
Meanwhile, Figure 1 also shows that applying a pixel-based classification to a high-resolution image can produce an impractical result with much noise. Advantages of using the object-based classification include not only higher classification accuracy, but also more practical depictions in resultant maps [35]. For example, the strip pattern in maize cropland shown in the PRISM image of Figure 1 indicates rotational cropping, as mentioned above. This occasional non-maize cropland does not appear as maize cropland, and actually some of the strips are classified as bean-centered cropland in the result of the pixel-based classification. It is not necessarily wrong, but the occasional non-maize cropland should not be seen as bean-centered cropland (which is typically located on sand dunes) in monitoring desertification because of the differentiated effects of land degradation [15]. As Yu et al. [36] pointed out, the increase in intra-class spectral variability causes a reduction of separability between classes with traditional pixel-based classification; consequently, classification accuracy is reduced, and the classification results show a salt-and-pepper effect (as mentioned above). 3.2. Generation of DSM and GIS-Based Classification of Sand-Dune Topography The Root Mean Square Error (RMSE) of triangulation should generally not be higher than the pixel size of images used [34]. The RMSE of our triangulation was 0.37 pixels, indicating that the accuracy of triangulation achieved a subpixel level. The height accuracy of the generated DSM was RMSE 2.2 m, which aligns with Takaku et al. [37] reporting that the height accuracy of the DSM generated from PRISM data in flat areas was approximately 2 m where the slope angles were less than 10 degrees. The overall accuracy of the subsequent classification of topographic types was 89% (kappa statistic: 0.81). Figure 2 shows that the DSM well represents undulating sand-dune
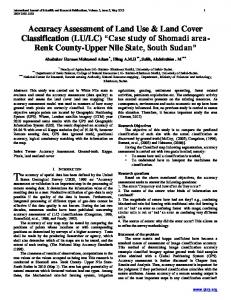
version 1 was released as a new global elevation dataset without [41]. This dataset is being produced on the basis of the archive data the ALOS PRISM recorded, and the coverage of the dataset is being expanded and updated on the website. It has higher accuracy than ASTER GDEM: spatial resolution is 1 arcsec (approximately 30 m) and height accuracy is less than 5 m (RMSE) [37,42]. Its horizontal Environments is 2016, 17 of 11 resolution the3,same as ASTER GDEM’s, but this free dataset is a coarser version of the original7 one, Environments 2016, 3, 17 7 of 11 which has 5 m spacing (the original is distributed on a commercial basis). This paper demonstrates topography that the result differentiates sand dunes and flat sandy lands, that a DSM and produced fromclassification PRISM images is accurate enough to capture undulating sand-dune including inter-dune areas. topography a semi-arid region of northeast China. Taking advantage thisflat new elevation dataset, topography andin that the classification result differentiates sand dunes of and sandy lands, including Until recently, the Advanced Spaceborne Thermal Emission and Reflection Radiometer Global our method will become more feasible and easier to apply. inter-dune areas. Digital Elevation Model (ASTER GDEM) version 2, which has 30 m spacing and less than 12 m height accuracy (RMSE) [38], had been used as the highest-resolution, freely-available global (a) (b) elevation dataset for the spatial analysis of dune topography [39,40]. In April 2016, ALOS World 3D version 1 was released as a new global elevation dataset without [41]. This dataset is being produced on the basis of the archive data the ALOS PRISM recorded, and the coverage of the dataset is being expanded and updated on the website. It has higher accuracy than ASTER GDEM: spatial resolution is 1 arcsec (approximately 30 m) and height accuracy is less than 5 m (RMSE) [37,42]. Its horizontal resolution is the same as ASTER GDEM’s, but this free dataset is a coarser version of the original one, which has 5 m spacing (the original is distributed on a commercial basis). This paper demonstrates that a DSM produced from PRISM images is accurate enough to capture undulating sand-dune topography in a semi-arid region of northeast China. Taking advantage of this new elevation dataset, Figure 2. Subset bird’s-eye view images of the generated digital surface model (DSM) with (a) the our method will become more feasible and of easier apply. digital surface model (DSM) with (a) the Figure 2. Subset bird’s-eye view images the to generated summer PRISM data and (b) topography classification map (green is flat sandy lands; yellow is sand summer PRISM data and (b) topography classification (green is flat sandy lands; yellow is sand dunes). The height in images is exaggerated threefold tomap facilitate visualization. (a) height in images is exaggerated threefold (b)to facilitate visualization. dunes). The 3.3. Depiction of Local Land-Use Types
UntilThe recently, the Advanced Spaceborne Emission and Global local land-use types were extracted byThermal overlaying the results of Reflection object-basedRadiometer and GIS-based Digital Elevation (Figure Model (ASTER version 2, which has 30 mtypes spacing andwe lesshave than 12 m height classification 3). Table 2GDEM) shows that the unrealistic land-use (which classified as “N/A”) rarely on flat sandy land” and “paddyfreely-available on sand dunes”. global elevation dataset accuracy (RMSE) [38],exist: had“paddy been used as the highest-resolution, for the spatial analysis of dune topography [39,40]. In April 2016, ALOS World 3D version 1 was released as a new global elevation dataset without [41]. This dataset is being produced on the basis of the archive data the ALOS PRISM recorded, and the coverage of the dataset is being expanded Figure Subset bird’s-eye viewhigher imagesaccuracy of the generated digital surface model (DSM) with (a) theis 1 arcsec and updated on2.the website. It has than ASTER GDEM: spatial resolution summer PRISM data and (b) topography classification map (green is flat sandy lands; yellow is sand (approximately 30 m) and height accuracy is less than 5 m (RMSE) [37,42]. Its horizontal resolution is dunes). The height in images is exaggerated threefold to facilitate visualization. the same as ASTER GDEM’s, but this free dataset is a coarser version of the original one, which has 5 m spacing (the original is distributed 3.3. Depiction of Local Land-Use Types on a commercial basis). This paper demonstrates that a DSM produced from PRISM images is accurate enough to capture undulating sand-dune topography in a The local land-use types were extracted by overlaying the results of object-based and GIS-based semi-arid region of northeast China. Taking advantage of this new elevation dataset, our method will classification (Figure 3). Table 2 shows that the unrealistic land-use types (which we have classified become more feasible and easier to apply. as “N/A”) rarely exist: “paddy on flat sandy land” and “paddy on sand dunes”.
Figure 3. Local land-use map of the study sites in the Horqin Sandy Land, resulting from the overlay of object-based preliminary land-use classification and GIS-based topography classification. Mongolian people constitute the majority of residents on in area on left, and Han people on right.
Environments 2016, 3, 17
8 of 11
3.3. Depiction of Local Land-Use Types The local land-use types were extracted by overlaying the results of object-based and GIS-based classification (Figure 3). Table 2 shows that the unrealistic land-use types (which we have classified as “N/A”) rarely exist: “paddy on flat sandy land” and “paddy on sand dunes”. Table 2. Cross tabulation of object-based and GIS-based classification categories. Topographic Type
Maize Cropland
Bean-Centered Cropland
Paddy
Tree Plantation
Lowland Flat sandy land Sand dune Total
3.8%
1.1%
1.6%
6.5%
0.3%
0.0%
2.2% 12.5%
1.1% 2.5%
0.0% 1.6%
Pastureland
Unused Land
Total
0.0%
0.6%
0.0%
7.1%
1.0%
14.3%
1.4%
23.4%
3.4% 4.4%
53.6% 68.4%
9.2% 10.6%
69.5% 100.0%
As mentioned in the introduction, detailed land-use maps are still missing in various regions of the world, including the Horqin Sandy Land, but some remote-sensing researchers have recently worked on the classification of agricultural land uses in some areas, such as Mediterranean and savanna regions [29,43–46]. Their research areas and ours share some common land-surface characteristics, e.g., grassland interspersed with trees, shrubs, and crops, which cannot be differentiated by traditional pixel-based classification or vegetation indices [43]. A distinct feature of our research area is topography, which is an important factor for the local land use. Whiteside et al. [46], for instance, reported that the incorporation of elevation data into their object-based classification did not make a significant difference in accuracy. We demonstrated that it is possible to discern the local land use in a semi-arid sand-dune area by merging an object-based preliminary land-use classification and GIS-based topography classification with a sufficiently accurate DSM. Many environmental and resource-management problems can be only dealt with effectively at broad scales [47,48]. In our study area, there has been a gap between broad spatial assessment of land degradation and restoration by remote sensing on one hand, and detailed assessments by field studies of the effects of local land use, on the other. Our research was able to connect the field and broad scales, and contribute to designing future environmental surveys, models, and policies. We have actually developed an integrated agent-based land-use model in the area, embedding a land-use map made by the method presented here as a vital input. Its development would have been impossible without the land-use map because it is the fundamental link between the sub-models of people’s land-use decisions and biophysical dynamics, including land degradation and restoration. A preliminary version of this land-use model is described in Miyasaka et al. [49]. 4. Conclusions Land use is a fundamental parameter for measuring human impacts and for understanding human-environment interactions. The present study depicted the spatial heterogeneity of local land use based on sand-dune topography in the Horqin Sandy Land by combining object-based analysis, digital photogrammetry, and GIS analysis, with high-resolution satellite images. The resultant local land-use map sufficiently distinguishes different land-use types that have similar spectral characteristics, and different topographic types within the same land use. Since such spatial data has never been produced in this area, the map sheds new light on previous field findings, showing where and how land degradation and restoration have occurred, as well as where they are likely to occur, in a broadly and spatially explicit manner. This research can contribute to future environmental surveys and policies to combat desertification, as well as modeling of human-environment interactions—A type of modeling which we have already worked on using the method presented here. Acknowledgments: The authors express their appreciation to all the staff and students of the Naiman Desertification Research Station of the Chinese Academy of Sciences for their kind help with field surveys, and to Hiromichi Fukui at Chubu University and Wanglin Yan at Keio University for letting us use their analysis device and software. This study was supported by a Grant-in-Aid for Japan Society for the Promotion of Science
Environments 2016, 3, 17
9 of 11
(JSPS) fellows (20-7493), with additional support from the Global Environmental Research Fund (G-071) and Environment Research and Technology Development Fund (4-1407) of the Ministry of the Environment, Japan. Author Contributions: Takafumi Miyasaka, Toshiya Okuro, and Xueyong Zhao carried out field surveys. Kazuhiko Takeuchi made valuable comments on the design and results of the study. Takafumi Miyasaka analyzed data and wrote the manuscript, which was reviewed by all of the authors. Conflicts of Interest: The authors declare no conflict of interest. The funding sponsors had no role in the design of the study; in the collection, analyses, or interpretation of data; in the writing of the manuscript; and in the decision to publish the results.
Abbreviations The following abbreviations are used in this manuscript: ALOS ASTER GDEM AVNIR-2 GIS GPS NDVI PRISM RMSE RPC TIN
Advanced Land Observing Satellite Advanced Spaceborne Thermal Emission and Reflection Radiometer Global Digital Elevation Model Advanced Visible and Near Infrared Radiometer type 2 Geographic Information System Global Positioning System Normalized Difference Vegetation Index Panchromatic Remote-sensing Instrument for Stereo Mapping Root Mean Square Error Rational Polynomial Coefficients Triangulated Irregular Network
References 1. 2. 3. 4.
5. 6. 7. 8.
9.
10.
11. 12.
Millennium Ecosystem Assessment. Ecosystems and Human Well-Being: Desertification Synthesis; World Resources Institute: Washington, DC, USA, 2005. McPeak, J.G. Analyzing and addressing localized degradation in the commons. Land Econ. 2003, 79, 515–536. [CrossRef] Lu, D.; Weng, Q. A survey of image classification methods and techniques for improving classification performance. Int. J. Remote Sens. 2007, 28, 823–870. [CrossRef] Lambin, E.F.; Geist, H.J.; Rindfuss, R.R. Introduction: Local processes with global impacts. In Land-Use and Land-Cover Change: Local Processes and Global Impacts; Lambin, E.F., Geist, H.J., Eds.; Springer: Berlin, Germany, 2006; pp. 1–8. Comber, A.J. The separation of land cover from land use using data primitives. J. Land Use Sci. 2008, 4, 215–229. [CrossRef] Beykaei, S.A.; Zhong, M.; Zhang, Y. Development of a land use extraction expert system through morphological and spatial arrangement analysis. Eng. Appl. Artif. Intel. 2015, 37, 221–235. [CrossRef] Kim, J.H. Crossing-over between land cover and land use: Exploring spatially varying relationships in two large US metropolitan areas. Appl. Geogr. 2015, 60, 37–45. [CrossRef] Li, F.R.; Zhang, H.; Zhao, L.Y.; Shirato, Y.; Wang, X.Z. Pedoecological effects of a sand-fixing poplar (Populus simonii Carr.) forest in a desertified sandy land of Inner Mongolia, China. Plant Soil 2003, 256, 431–442. [CrossRef] Okuro, T. Studies on the Influence of Grazing on the Land and Vegetation Degradation and Restoration Process in Grassland Regions in Northeast China. Ph.D. Thesis, The University of Tokyo, Tokyo, 1997. (In Japanese with English summary). Miyasaka, T.; Okuro, T.; Miyamori, E.; Zhao, X.; Takeuchi, K. Effects of different restoration measures and sand dune topography on short- and long-term vegetation restoration in northeast China. J. Arid Environ. 2014, 111, 1–6. [CrossRef] Zuo, X.A.; Zhao, H.L.; Zhao, X.Y.; Guo, Y.R.; Li, Y.L; Luo, Y.Y. Plant distribution at the mobile dune scale and its relevance to soil properties and topographic features. Environ. Geol. 2008, 54, 1111–1120. [CrossRef] Zuo, X.A.; Zhao, H.L.; Zhao, X.Y.; Zhang, T.H.; Guo, Y.R.; Wang, S.K.; Drake, S. Spatial pattern and heterogeneity of soil properties in sand dunes under grazing and restoration in Horqin Sandy Land, Northern China. Soil Till. Res. 2008, 99, 202–212. [CrossRef]
Environments 2016, 3, 17
13.
14.
15.
16. 17. 18.
19. 20.
21. 22. 23. 24. 25. 26. 27. 28.
29.
30. 31. 32. 33. 34.
10 of 11
Zuo, X.A.; Zhao, X.Y.; Zhao, H.L.; Guo, Y.R.; Zhang, T.H.; Cui, J.Y. Spatial pattern and heterogeneity of soil organic carbon and nitrogen in sand dunes related to vegetation change and geomorphic position in Horqin Sandy Land, Northern China. Environ. Monit. Assess. 2010, 164, 29–42. [CrossRef] [PubMed] Zuo, X.A.; Zhao, X.Y.; Zhao, H.L.; Zhang, T.H.; Guo, Y.R.; Li, Y.Q.; Huang, Y.X. Spatial heterogeneity of soil properties and vegetation–soil relationships following vegetation restoration of mobile dunes in Horqin Sandy Land, Northern China. Plant Soil 2008, 318, 153–167. [CrossRef] Miyasaka, T.; Okuro, T.; Zhao, H.; Zhao, X.; Zuo, X.; Takeuchi, K. Impacts of the local land-use system in a semi-arid region of northeastern China on soil properties, crop growth, and weed communities. J. Arid Environ. 2011, 75, 1155–1163. [CrossRef] Duan, H.C.; Wang, T.; Xue, X.; Liu, S.L.; Guo, J. Dynamics of aeolian desertification and its driving forces in the Horqin Sandy Land, Northern China. Environ. Monit. Assess. 2014, 186, 6083–6096. [CrossRef] [PubMed] Han, Z.; Wang, T.; Yan, C.; Liu, Y.; Liu, L.; Li, A.; Du, H. Change trends for desertified lands in the Horqin Sandy Land at the beginning of the twenty-first century. Environ. Earth Sci. 2010, 59, 1749–1757. [CrossRef] Zhou, Y.; Chang, X.; Ye, S.; Zheng, Z.; Lv, S. Analysis on regional vegetation changes in dust and sandstorms source area: A case study of Naiman Banner in the Horqin sandy region of Northern China. Environ. Earth Sci. 2015, 73, 2013–2025. [CrossRef] Bagan, H.; Takeuchi, W.; Kinoshita, T.; Bao, Y.; Yamagata, Y. Land cover classification and change analysis in the Horqin Sandy Land from 1975 to 2007. IEEE J. Sel. Top. Appl. 2010, 3, 168–177. [CrossRef] Zheng, X.; Zhu, J.J.; Yan, Q.L.; Song, L.N. Effects of land use changes on the groundwater table and the decline of Pinus sylvestris var. mongolica plantations in southern Horqin Sandy Land, Northeast China. Agric. Water Manage. 2012, 109, 94–106. [CrossRef] Katoh, K.; Takeuchi, K.; Jiang, D.M.; Nan, Y.H.; Kou, Z.W. Vegetation restoration by seasonal exclosure in the Kerqin Sandy Land, Inner Mongolia. Plant Ecol. 1998, 139, 133–144. [CrossRef] Li, Y.L.; Cui, J.Y.; Zhang, T.H.; Okuro, T.; Drake, S. Effectiveness of sand-fixing measures on desert land restoration in Kerqin Sandy Land, northern China. Ecol. Eng. 2009, 35, 118–127. [CrossRef] Shirato, Y.; Taniyama, I.; Zhang, T.H. Changes in soil properties after afforestation in Horqin Sandy Land, North China. Soil Sci. Plant Nutr. 2004, 50, 537–543. [CrossRef] Su, Y.Z.; Li, Y.L.; Cui, J.Y.; Zhao, W.Z. Influences of continuous grazing and livestock exclusion on soil properties in a degraded sandy grassland, Inner Mongolia, northern China. Catena 2005, 59, 267–278. Zhang, J.; Zhao, H.; Zhang, T.; Zhao, X.; Drake, S. Community succession along a chronosequence of vegetation restoration on sand dunes in Horqin Sandy Land. J. Arid Environ. 2005, 62, 555–566. [CrossRef] Zhao, H.L.; Zhou, R.L.; Su, Y.Z.; Zhang, H.; Zhao, L.Y.; Drake, S. Shrub facilitation of desert land restoration in the Horqin Sand Land of Inner Mongolia. Ecol. Eng. 2007, 31, 1–8. [CrossRef] Tadono, T.; Shimada, M.; Murakami, H.; Takaku, J. Calibration of PRISM and AVNIR-2 onboard ALOS “Daichi”. IEEE Trans. Geosci. Remote 2009, 47, 4042–4050. [CrossRef] Benz, U.C.; Hofmann, P.; Willhauck, G.; Lingenfelder, I.; Heynen, M. Multi-resolution, object-oriented fuzzy analysis of remote sensing data for GIS-ready information. ISPRS J. Photogramm. 2004, 58, 239–258. [CrossRef] Müller, H.; Rufin, P.; Griffiths, P.; Barros Siqueira, A.J.; Hostert, P. Mining dense Landsat time series for separating cropland and pasture in a heterogeneous Brazilian savanna landscape. Remote Sens. Environ. 2015, 156, 490–499. [CrossRef] Baatz, M.; Benz, U.; Dehghani, S.; Heynen, M.; Höltje, A.; Hofmann, P.; Lingenfelder, I.; Mimler, M.; Sohlbach, M.; Weber, M.; et al. eCognition Version 4.0 User Guide; Definiens Imaging: Munich, Germany, 2004. Schiewe, J. Segmentation of high-resolution remotely sensed data-concepts, applications and problems. ISPRS Archives 2002, 34, 380–385. Platt, R.V.; Rapoza, L. An evaluation of an object-oriented paradigm for land use/land cover classification. Prof. Geogr. 2008, 60, 87–100. [CrossRef] Haralick, R.M.; Shanmuga, K.; Dinstein, I. Textural features for image classification. IEEE Trans. Syst. Man Cybern. 1973, 3, 610–621. [CrossRef] Leica Geosystems. Leica Photogrammetry Suite OrthoBASE and OrthoBASE pro User’s Guide; Leica Geosystems GIS and Mapping: Atlanta, GA, USA, 2003.
Environments 2016, 3, 17
35.
36.
37. 38.
39. 40. 41. 42. 43. 44.
45.
46. 47. 48. 49.
11 of 11
Willhauck, G. Comparison of object oriented classification techniques and standard image analysis for the use of change detection between SPOT multispectral satellite images and aerial photos. ISPRS Archives 2000, 33, 214–222. Yu, Q.; Gong, P.; Clinton, N.; Biging, G.; Kelly, M.; Schirokauer, D. Object-based detailed vegetation classification with airborne high spatial resolution remote sensing imagery. Photogramm. Eng. Remote Sens. 2006, 72, 799–811. [CrossRef] Takaku, J.; Tadono, K.; Tsutsui, K. Generation of high resolution global DSM from ALOS PRISM. ISPRS Archives 2014, 40, 243–248. [CrossRef] Tachikawa, T.; Kaku, M.; Iwasaki, A.; Gesch, D.; Oimoen, M.; Zhang, Z.; Danielson, J.; Krieger, T.; Curtis, B.; Haase, J.; et al. ASTER Global Digital Elevation Model. Version 2–Summary of Validation Results; Meyer, D., Ed.; NASA Land Processes Distributed Active Archive Center: Washington, DC, USA, 2011. Telfer, M.W.; Fyfe, R.M.; Lewin, S. Automated mapping of linear dunefield morphometric parameters from remotely-sensed data. Aeolian Res. 2015, 19, 87–95. [CrossRef] White, K.; Bullard, J.; Livingstone, I.; Moran, L. A morphometric comparison of the Namib and southwest Kalahari dunefields using ASTER GDEM data. Aeolian Res. 2015, 19, 215–224. [CrossRef] ALOS Global Digital Surface Model "ALOS World 3D–30m" (AW3D30). Available on line: http://www.eorc. jaxa.jp/ALOS/en/aw3d30/ (accessed on 11 July 2016). Tadono, T.; Ishida, H.; Oda, F.; Naito, S.; Minakawa, K.; Iwamoto, H. Precise global DEM generation by ALOS PRISM. ISPRS Annals 2014, 2, 71–76. [CrossRef] Gibbes, C.; Adhikari, S.; Rostant, L.; Southworth, J.; Qiu, Y. Application of object based classification and high resolution satellite imagery for savanna ecosystem analysis. Remote Sens. 2010, 7, 2748–2772. [CrossRef] Castillejo-González, I.L.; López-Granados, F.; García-Ferrer, A.; Peña-Barragán, J.M.; Jurado-Expósito, M.; de la Orden, M.S.; González-Audicana, M. Object- and pixel-based analysis for mapping crops and their agro-environmental associated measures using QuickBird imagery. Comput. Electron. Agric. 2009, 68, 207–215. [CrossRef] Sweeney, S.; Ruseva, T.; Estes, L.; Evans, T. Mapping cropland in smallholder-dominated savannas: integrating remote sensing techniques and probabilistic modeling. Remote Sens. 2015, 7, 15295–15317. [CrossRef] Whiteside, T.G.; Boggs, G.S.; Maier, S.W. Comparing object-based and pixel-based classifications for mapping savannas. Int. J. Appl. Earth Obs. 2011, 13, 884–893. [CrossRef] Wu, J.G. Hierarchy and Scaling: Extrapolating information along a scaling ladder. Can. J. Remote Sens. 1999, 25, 367–380. [CrossRef] Wu, J.G.; Qi, Y. Dealing with scale in landscape analysis: an overview. Geogr. Inf. Sci. 2000, 6, 1–5. [CrossRef] Miyasaka, T.; Le, Q.B.; Okuro, T.; Zhao, X.; Scholz, R.W.; Takeuchi, K. An Agent-Based Model for Assessing Effects of a Chinese PES Program on Land-Use Change Along with Livelihood Dynamics, and Land Degradation and Restoration. In Managing Resources of a Limited Planet: Pathways and Visions under Uncertainty, Proceedings of the Sixth Biennial Meeting of the International Environmental Modelling and Software Society, Leipzig, Germany, 1–5 July 2012. © 2016 by the authors; licensee MDPI, Basel, Switzerland. This article is an open access article distributed under the terms and conditions of the Creative Commons Attribution (CC-BY) license (http://creativecommons.org/licenses/by/4.0/).