Classifier-Based Capacity Prediction for Desktop Grids
Artur Andrzejak1, Patricio Domingues2, Luis Silva3, 1
Zuse-Institute Berlin Takustr. 7, 14195 Berlin, Germany
[email protected] 2 ESTG-Polytechnic Institute of Leiria 2411-901 Leiria, Portugal
[email protected] 3 CISUC - Centre for Informatics and Systems of the University of Coimbra 3030-290 Coimbra, Portugal
[email protected] ____________________________________________________________________
CoreGRID Technical Report Number TR-0026 January 30, 2006 Institute on System Architecture CoreGRID - Network of Excellence URL: http://www.coregrid.net
CoreGRID is a Network of Excellence funded by the European Commission under the Sixth Framework Programme Project no. FP6-00426
Classifier-Based Capacity Prediction for Desktop Grids
1
Artur Andrzejak1, Patricio Domingues2, Luis Silva3, 1Zuse-Institute Berlin Takustr. 7, 14195 Berlin, Germany
[email protected] 2ESTG-Polytechnic Institute of Leiria 2411-901 Leiria, Portugal
[email protected] 3CISUC - Centre for Informatics and Systems of the University of Coimbra 3030-290 Coimbra, Portugal
[email protected] CoreGRID TR-0026
January 30, 2006 Abstract Availability of resources in desktop grids is characterized by high dynamicity, a consequence of the local (owner) control policies in such systems. The efficient usage of desktop computers can therefore greatly benefit from prediction methodologies, as those help to estimate the short-term behavior of resources and to take the appropriate preventive actions. We present a prediction study performed on institutional desktop pool and discuss a framework for automated behavior prediction. Several classifier-based forecast algorithms are evaluated over two traces collected from 32 machines of two classrooms of an academic environment. Results show that prediction approaches produce meaningful results in the context of desktop grids and can be used for more efficient and dependable computing in these environments. Moreover, the applied prediction methodology - classification algorithms - allow for computationally inexpensive real time predictions.
1 Introduction Grids comprised of networked desktop computers, commonly referred as desktop grids, are becoming increasingly attractive for performing computations. It is well-know that desktop machines used for regular activities, ranging from electronic office actions (text processing, spreadsheets and other document preparation) to communication (e-mail, instant messaging) and information browsing have very low resource usage. Indeed, most computing activities depending on human interactive input barely load the machines yielding high percentage of resource idleness, namely CPU, making these resources attractive for harvesting [1].
1
This research work is carried out under the FP6 Network of Excellence CoreGRID funded by the European Commission (Contract IST-2002004265).
CoreGRID TR-0026
2
Popularity of harvesting desktop resources can be attested by the numerous and popular public computing projects [2], like the well-known SETI@home [3]. The success of desktop grid computing has fostered the development of middleware yielding several frameworks, ranging from academic projects like Condor [4], BOINC [5] and XtremWeb [6], to commercial solutions like United Devices [7], to name just a few. The availability of these platforms has promoted the setup and use of desktop grids, which in turn has fueled further development and refinement of desktop grids middleware. Desktop grids are not restricted to public computing projects. In fact, many institutions like academics or corporate own respectable amount of desktop computers (hundredths or even thousands), therefore holding an impressive computing power if properly harnessed. The availability of desktop grid middleware has made possible the setup and exploitation of institutional desktop grids with reduced effort. These institutional desktop grids can provide demanding users (researchers, staff, etc.) inexpensive computing power. In this study, we focus on institutional desktop grids comprised of resources connected by a local area network, like, for instance, all desktop machines of an academic campus or existing at a company’s facilities. The major drawback of desktop grids lies in the volatility of resources. Indeed, since desktop machines are primarily devoted to their owners, resources might suddenly alter their availability statuses. Thus, efficiency of use of desktop grid environments can greatly benefit with prediction of resources availability. In fact, if a given machine or scheduler knows, with high probability, of a failure in a short timescale future, actions can be taken to eliminate or at least minimize the effects of the predicted failure. For instance, the application can be migrated or replicated to another machine whose prediction indicates higher probability to survive and/or higher amount of resources available for harvesting. Therefore, accurate resource prediction can substantially increase usage efficiency of desktop grid based systems. The main motivation for this work was to assess the feasibility and accuracy of predicting desktop resources availability from academic classrooms based on the resource usage traces collected from desktop machines. The results show that indeed even such a highly volatile environment allows for meaningful and robust prediction results. Moreover, the deployed classification algorithms known from data mining have low computational cost and allow for online usage without significant resource overhead. These results show that prediction methods can provide effective support for better usage of resources in desktop Grids and for improving their dependability. The remainder of this paper is organized as follows. Section 2 describes related work, while section 3 presents the trace collecting utility and the prediction framework. Section 4 details the prediction experiment, with results being discussed in section 5. Finally, section 6 concludes the paper. 2 Related work Work on resource demand prediction includes calendar methods [8]. In these approaches, a fixed period (e.g. 1 day) is assumed, and a probabilistic profile for each chunk of the period is computed. One drawback of these methods is that the period is determined in an arbitrary way. Here the Fast Fourier Transformation can be used to determine the essential periodicities. More advanced approaches to demand prediction stem from econometrics and use time series models based on auto-regression and moving averages such as ARIMA and ARFIMA [9]. Another class of prediction methods (used in this study) deploys classification algorithms known from data mining [10]. Here a set of examples which include some function values (attributes) of past samples together with the correct classification (i.e. prediction value) is first presented to the CoreGRID TR-0026
3
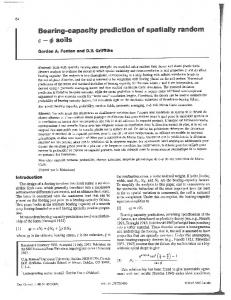
classifier and used to build an internal model. Subsequent requests to the classifier with the values of the analogous attributes yield a prediction as the response. The most advanced framework for resource prediction in computer systems is the Resource Prediction System (RPS) [11]. It is a toolkit for designing, building and evaluating systems that predict dynamic behavior of resources in distributed systems. For analyzing and predicting data series, RPS offers a library and several tools supporting several models like MEAN, NEWTON, ARIMA and wavelet methods. The main disadvantages of RPS are its focus on very short-term predictions, lack of correlation analysis, and high computational demand for ARIMA model creation. The Network Weather Service (NWS) [12] is a distributed framework that aims to provide short-term forecasts of dynamically changing performance characteristics of a distributed set of computing resources. NWS operates through a set of performance sensors (“monitors”) from which it gathers readings of instantaneous conditions. Performance forecasts are drawn from mathematical analysis of collected metrics. A limitation of NWS lies in its support restricted to Unix environments, especially since a high percentage of desktop machines run Windows based operative systems. 3 The collection and prediction frameworks In this section, we briefly introduce the two frameworks employed in our study: Distributed Data Collector (DDC) and OpenSeries. The former is used to collect the resource usage traces while the latter is the framework that offers the data mining capabilities for time series analysis of the resource traces. Thus, roughly put, DDC collects resource usage traces that are then fed into the OpenSeries module for generating resource usage prediction.
Figure 1: Software frameworks and the flow of data It is important to note that DDC and OpenSeries are decoupled systems that can be run independently of each other. In fact, DDC can be used for wider applications than resource usage trace collection, and input traces for OpenSeries only needs to respect the Comma Separated Value (CSV) format or similar, permitting that OpenSeries receives input from other traces collector software. Figure 1 depicts the relationship between the trace collector and the data analyzer and the predictor modules.
3.1 Distributed Data Collector DDC is a framework to automate repetitive executions of console applications (probes) over a set of networked Windows personal computers [13]. DDC schedules the periodic execution of software probes in a given set of machines. The execution of probes is carried out remotely, that is, the probe binary is executed at the remote machine, requiring only the appropriate access credentials. All executions of probes are scheduled by DDC’s central coordinator host, which is a normal PC. A probe is a mere win32 console application that uses its output channels (both stdout CoreGRID TR-0026
4
and stderr) to communicate its results. One of DDC tasks is precisely to capture the output of the probe and to store it at the coordinator machine. Note, that from the perspective of the probe, the execution occurs locally, that is, the probe is unaware of being executed remotely. Additionally, DDC allows the probe’s output to be processed by so-called post-collecting code which is supplied by DDC’s user and specific to a probe. The purpose of the post-collecting code is to permit analysis of probe’s output immediately after its execution, so that relevant data can be extracted. A key feature of DDC is that no software needs to be installed at remote machines. Indeed, the framework uses Windows capabilities for remote execution, requiring solely the credentials to access remote machines. For the purpose of collecting usage traces of desktop resources suitable for time series analysis, DDC was fitted with an appropriate probe that collects, for every execution at a remote machine, the current timestamp, CPU idleness percentage, memory load (percentage of physical memory used), and machine uptime, amongst other metrics. Collected data are appended to the trace file corresponding to the remote machine. At the end of a timestamp, after all remote machines have been probed, an entry is appended to the so-called trace index file, stating which machines responded positively to the probe and which ones were not probed, because of being not accessible (powered off or disconnected from the network). The trace index file aggregates, for every timestamp, the list of available machines and can be used for replaying the trace. 3.2 The OpenSeries framework OpenSeries [14] is an extensible framework for time series analysis, modeling, and prediction. It is a collection of packages which provide data structures, persistency layer, and a deployment engine. Currently only off-line analysis and prediction is implemented, but the online (real time) modules are in work. The framework interfaces with the Weka 3.4 data mining library, offering the user access to a variety of classification algorithms, data filters, attribute selection techniques and clustering algorithms. Additionally, OpenSeries currently provides multivariate ARIMA-type algorithms [9] known from econometrics, neuro-fuzzy classifiers, and genetic algorithms which can be used for model fitting or other parameter tuning. OpenSeries can be controlled and configured by MetaLooper [15], a component-based batch experiment configuration and execution framework. It facilitates the configuration of batch experiments, while promoting code reuse. MetaLooper permits to configure user’s Java-code organized in a component-oriented fashion into trees that are orderly executed by the framework. Experiments and associated parameters are defined through XML, freeing MetaLooper’s users from the burden of having to implement configuration related elements in Java. 4 Evaluation Our prediction methodologies were evaluated using two groups of metric traces (henceforth, trace A and trace B). Each trace represents the resource usage of two classrooms with 16 machines each, thus totaling 32 machines. Although the classrooms are primarily devoted to classes, during off-classes any student from the academic institution can access the machines for performing practical assignments (coding, writing report and so on), communicate through e-mail and browse the web. Both traces were collected with a two-minute interval between consecutive samples in a machine. It is important to note that no policy related to the powering off of machines exists. In fact, users are advised but not ordered to power off machines when they leave the machines. On weekdays, CoreGRID TR-0026
5
classrooms remain open 20 hours per day, closing from 4 am to 8 am. On Saturdays, classrooms open at 8 am and close at 9 pm until the next Monday. Trace A represents 39 consecutive days (25/11/2004 to 3/01/2005) and contains 27000 samples, while trace B corresponds to 17 consecutive days (31/01/2005 to 16/02/2005) and has 12700 samples. Contrary to trace A that was collected on a period with classes, trace B corresponds to an exam-period, without classes.
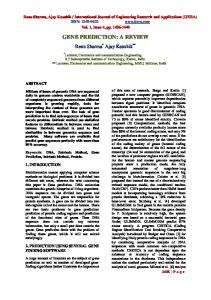
Figure 2: Count of machines over time for trace A (left) and trace B (right). The horizontal line represents the average count of accessible machines (17.42 for trace A, 13.94 for trace B)
Figure 2 shows the count of alive machines over time for trace A (left) and trace B (right). The weekday/weekend periods are distinguishable, with weekends exhibiting a stable number of accessible machines, identifiable by the flat sections of the plots. Also visible in the plot is that trace A presents a higher number of accessible machines than trace B. In fact, accordingly to the average count of accessible machines, trace A has 3.48 more powered on machines than trace B (17.42 versus 13.94). 4.1 Prediction methodologies In our study we deployed the classification algorithms known from data mining instead of the typically used ARIMA-based methods. This approach turned out to be successful in this setting, and features the following advantages: -
discretized numerical prediction (such as expected CPU load) can be combined with binarytype predictions (such as intrusion alert). the inter-trace correlations can be easily exploited without excessive increase of computational cost contrary to the case of multivariate ARIMA predictions. the computational cost for training of the predictor is considerably lower than for the ARIMA method (even without using inter-trace correlations). a variety of algorithms can be used, including “lazy” methods which incur little computational effort during the training phase yet more during the prediction, or “non-lazy” which are more computationally demanding during training yet fast during prediction (useful for repetitive predictions based on the same model).
4.1.1 Prediction through classification To predict continuous signal using classifiers, signal value for a given sample has to be discretized into a fixed number of levels. For example, if the CPU usage signal ranges from 0% and 100%, and the sufficient prediction accuracy is on the order of 20%, than five levels with intervals [0%-20%[, .., [80%-100%] should be used. A classifier returns the index of one these levels as the prediction value. In general, a classifier requires a set of training examples to build a prediction model. Each such training example consists of a tuple of attribute values and the correct class (signal level in our setting) to be predicted. Each attribute is either a raw input data (past sample value), or some function thereof, such as a moving average or first derivative. For exploiting inter-trace CoreGRID TR-0026
6
correlations, the attributes may be also based on traces which are different from the target trace. For example, when predicting the availability of machine X (target), we could use the moving averages of the CPU load of other machines as the attributes. 4.1.2 Attribute selection It is known that a too large number of attributes as classifier input decreases the prediction accuracy [10] due to the over fitting phenomena. Especially when using inter-trace correlations and functions of raw data, the number of potential attributes could very large (on the order of few thousands in the case of our study). To reduce the number of the attributes, attribute selection methods are used. However, in the case of using inter-trace correlations, the initial number of attributes to select from is so large that it incurs too heavy computational costs (some attribute selection algorithms are quadratic in the number of initial attributes). Therefore, we have developed a two-stage process which first selects the relevant (correlated) machines (phase A), then computes a pool of functions on traces of these machines (phase f), and finally selects the final attributes from the pool of functions (phase B). Since phase A is essentially a trace correlation analysis with low running time, we can specify a large set of machines (on the order of 100) as a potential input. 4.1.3 Walk-forward evaluation The prediction testing is performed in a walk-forward mode. A fitting interval of size F is used for training the models (building the classifier models). An adjacent test interval of size T is used for the out-of-sample evaluation of the model. Subsequently, both intervals are moved forward by F, and the process is repeated. This procedure allows for change-adaptive model selection yet avoids any over fitting problems. 4.2 Experiments In our study we used three prediction targets: • percentage of machine idleness (idle percentage) • percentage of free virtual memory (memory load) • machine availability, i.e. whether it was switched on or off (availability). The first target had original value range [0,..,100] and has been discretized into five levels. The second target had also values between 0 and 100, and four discretization levels have been used. Machine availability was either 0 or 1, and consequently has been assigned two levels. The attributes used in the attribute selection and prediction included the raw data and simple moving averages (SMA) thereof, with length from 5 to 60 samples. Also calendar functions of the timestamps such as hour of the day, day of the week etc. were included. As the lead time (the offset of the future time instant for which prediction is made) we have chosen 30 minutes as a reasonable time to perform management actions in a desktop grid. We also tested other lead times (from 15 to 120 minutes) which yielded similar accuracies. At the end of the preliminary attribute selection phase A (resource selection) we have taken the 5 most relevant “sources” (pairs machine/metric) and used the functions thereof as input for the final selection phase. At the end of this second phase, 10 most relevant attributes have been used for the prediction. All targets have been predicted using the following five classification algorithms, with algorithm parameters having the default values in the Weka 3.4 library: • Naive Bayes (Bayes) CoreGRID TR-0026
7
• • • •
complement class Naive Bayes classifier (CompBayes) John Platt's sequential minimal optimization algorithm for training a support vector classifier (SMO) k-nearest neighbors classifier (IBk) C4.5 decision tree classifier (treesJ48).
The evaluation of the prediction was performed in the walk-forward mode, with 1 week as the fitting time interval F, and 3 days as the test time interval T. Within each test interval, the predictions have been performed for each of the 2160 samples. 5 Results In the following we state the results of our study and interpret them. All running times have been measured on a 3 GHz Pentium 4 machine with hyperthreading and 1.5 GByte RAM. We used the Java 1.5 client VM under Suse Linux. 5.1 Attribute selection results The attribute selection phase has been performed for each of the 32 machines and each of the 3 targets, in total 96 times (for each of the traces A and B). The resulting attributes showed very little inter-machine correlations, probably due to the fact that there is no strict power on/off policy. That is, users are free to choose the machine they want to work at and are not obliged to power off the machine they worked at. Moreover, when a class starts, some of machines will be already powered on, while others need to be switched on. The computing time for the attribute selection is non-negligible, however the relevant attributes need to be computed only once and recomputed only if the usage patterns significantly change. For example, for the (longer) trace A the total selection time for all 96 targets was below 4 hours, or 2.5 minutes per target. 5.2 Prediction results As noted above, five different classification algorithms have been used. Overall, the Support Vector Machines classifier (SMO) has performed best. In some cases the simple Naive Bayes algorithm could achieve only slightly lower accuracy, but required significantly less computation time. We have used for evaluation the Mean Squared Error (MSE) of the prediction, comparing it to the variance of the original signal. In Figure 3 we compare the classifier accuracy in terms of the sum of MSEs over all machines in a trace.
Figure 3: Comparison of the classifier accuracy: trace A (left), trace B (right)
The results of predictions using SMO for the memory load are shown in Figure 4, those for percentage of CPU idleness in Figure 5, and those for the machine availability in Figure 6. In the CoreGRID TR-0026
8
whole study, there is only one (non-zero) case where the MSE is higher than the signal variance. This indicates high robustness of the prediction and reliability of the method. In general, the prediction results for trace A are better. As visible in Figure 2, some machines in trace B have not been used frequently during the data collection period. This yields low signal variances for those machines, which makes the MSE to appear large in comparison.
Figure 4: Prediction results for memory load for traces A and B
Figure 5: Prediction results for CPU idleness percentage for traces A and B
The cumulative running time for trace A was below 9 hours for all 32x3x5 = 480 prediction cases. Each case included 11 times the creation of the classifier model (there are (39-7)/3= 11 phases in walk-forward test) and approximately 22000 predictions. On average, a single case required 67.5 seconds, or 3 msec per prediction (amortized). This is the average time over all 5 classifiers; specific classifiers can incur larger computational cost (SMO is likely to need more time than Naive Bayes). However, since a new prediction would be required at most every 2 minutes in the real-time case, our approach overall incurs negligible computational overhead.
Figure 6: Prediction results for machine availability for traces A and B
6 Conclusions This study has shown that even highly dynamic environments such as desktop pools allow for meaningful predictions of a variety of metrics. Primary applications of this technique are in the domain of desktop grid schedulers and resource managers. Those can use predictions for job placements which require least migration, provide highest failure or interruption resilience, or are least intrusive for resource owners.
The prediction results achieved in the study are robust and significant. There are consistent differences in the accuracy of different classification algorithms, with SMO (Support Vector CoreGRID TR-0026
9
Machines) performing best. Inexistence of correlation is possibly due to the lack of a strict power off/on policy. Acknowledgements This research work is carried out in part under the FP6 Network of Excellence CoreGRID funded by the European Commission (Contract IST-2002-004265). Artur Andrzejak would like to thank Mehmet Ceyran and Ulf Hermann for part of the implementation work.
References [1] [2] [3] [4] [5] [6] [7] [8] [9] [10] [11] [12] [13] [14] [15]
P. Domingues, P. Marques, and L. Silva, "Resource Usage of Windows Computer Laboratories," ICPP Workshops 2005, Oslo, Norway, 2005. J. Bohannon, "Grassroots supercomputing," Science, pp. 810-813, 2005. Seti@Home, "Seti@Home (http://setiathome.ssl.berkeley.edu/)," 2005. Condor, "Condor Project Homepage (http://www.cs.wisc.edu/condor/),". D. Anderson, "BOINC: A System for Public-Resource Computing and Storage,", 5th IEEE/ACM Workshop on Grid Computing, Pittsburgh, USA, 2004. G. Fedak, C. Germain, V. Neri, and F. Cappello, "XtremWeb: A Generic Global Computing System," 1st CCGRID'01, Brisbane, 2001. UnitedDevices, "United Devices, Inc. (http://www.ud.com)." J. Hollingsworth and S. Maneewongvatana, "Imprecise Calendars: An Approach to Scheduling Computational Grids.," Int. Conf. on Distributed Comp. Systems, 1999. W. Enders, Applied Econometric Time Series, 2nd ed: Wiley Canada, 2003. I. H. Witten and F. Eibe, Data mining: practical machine learning tools and techniques with Java implementations: Morgan Kaufmann Publishers, 2000. P. Dinda and D. O'Hallaron, "An extensible toolkit for resource prediction in distributed systems," Carnegie Mellon University CMU-CS-99-138, 1999. R. Wolski, N. Spring, and J. Hayes, "The Network Weather Service: A Distributed Resource Performance Forecasting Service for Metacomputing," Future Generation Computing Systems, vol. 15, pp. 757-768, 1999. P. Domingues, P. Marques, and L. Silva, "Distributed Data Collection through Remote Probing in Windows Environments," 13th Euromicro Parallel, Distributed and Network-Based Processing, Lugano, Switzerland, 2005. A. Andrzejak, M. Ceyran, and U. Hermann, "OpenSeries - a Time Series Analysis Library," (unpublished) 2005. A. Andrzejak and M. Ceyran, "MetaLooper - a framework for configuration and execution of batch experiments with Java (http://www.zib.de/andrzejak/ml/text.en.html)," 2005.
CoreGRID TR-0026
10