primarily by geographyâ (Nerbonne and Kretzschmar 2003:245). ..... Hans Bennis, Sjef Barbiers, John Nerbonne and an anonymous reviewer for their helpful.
Classifying Dutch dialects using a syntactic measure The perceptual Daan and Blok dialect map revisited* Marco René Spruit Meertens Instituut, Amsterdam
In this dialectometric research a quantitative measure of syntactic distance is developed and applied to Dutch dialects. It will be shown that a quantitative perspective on syntactic variation provides new insights in the degree of geographic coherence in syntactic variation, using the perceptual Daan and Blok map of the Dutch dialects from a comparative perspective.
1.
Introducing the dialect classification problem
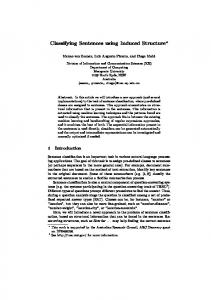
Dialect speakers are aware of the existence of borders in the dialect landscape. The Daan and Blok (1969) map shown in Figure 1 classifies the Dutch dialects using subjective judgements from local dialect speakers to reflect this fact. However, dialects also seem to be organised in a continuum with gradual transitions which are sometimes larger and sometimes smaller. Although the existence of dialect borders does not necessarily exclude the presence of dialect continua, a measure of dialect differences is required to objectively differentiate them (Heeringa 2004). This article describes a computational method to objectively classify the Dutch dialects using a syntactic measure. First, the Daan and Blok dialect map based on subjective judgements is discussed in Section 2. Then, after introducing the research area in Section 3, the measurement method and the analysis technique are described in Sections 4 and 5. The resulting Dutch dialect maps are discussed in Section 6. Section 7 concludes with a comparison of the computational dialect map based on syntactic variation with the perceptual dialect map based on subjective judgements.
2 Marco Rene Spruit 2.
Classifying Dutch dialects using subjective judgements
The Daan and Blok dialect map uses subjective judgements from about 1500 local dialect speakers in the Netherlands, collected in 1939, to establish a classification of dialect areas in the Dutch language area. Dialect borders in the Netherlandic part of this map are found using the arrow method. In this method neighbouring dialects which speakers judge to be similar are connected by arrows. This results in clusters of localities bound by arrows and separated by empty spaces that form perceptual dialect area boundaries. The arrow method could not be applied in Flanders because the Belgian dialectologists did not have a sufficiently large group of correspondents at their disposal. Therefore, Belgian language geographers, who often belonged to dialect-speaking groups themselves, were consulted. Also, some of the results were corrected afterwards in case of a very low response of correspondents for an area or contradictory responses, leading to consulting expert opinion rather than subjective judgements (Heeringa 2004). Furthermore, the colours used in the Daan and Blok dialect map were chosen more or less intuitively, although corresponding to a gradually increasing divergence from Standard Dutch. “This rank order does not follow from the judgements themselves, but was imposed by Daan on the speakers’ classification on the basis of expert knowledge of internal linguistic dialect structure” (Goeman 2000:139). To summarise, the classification of the Dutch dialects in the Daan and Blok map is the result of subjective judgements from local speakers, local experts and the map designers. Also, there is no differentiation within dialect areas, which contradicts the intuition that dialects are also organised in a continuum without sharp boundaries. The remainder of this article provides a computational method to objectively classify the Dutch dialects using a syntactic measure.
3.
Combining dialectometry and syntactic variation
This research combines and extends work from two different research areas: dialectometry and syntactic variation. “Dialectometry is the measurement of dialect differences, i.e. linguistic differences whose distribution is determined primarily by geography” (Nerbonne and Kretzschmar 2003:245). The key step in dialectometry is from the measurement of individual linguistic variables to the measurement of aggregate differences of varieties. Dialectometric methods were first described in Seguy (1971) and further investigated in Goebl (1982) and Heeringa (2004), among others. However, until recently no extensive collection
Classifying Dutch dialects using a syntactic measure 3 of syntactic data was available, limiting dialectometric research mainly to lexical and phonological data. With the arrival of the first part of the Syntactic Atlas of the Netherlandic Dialects (SAND1, Barbiers et al. 2005), the first compendium of Dutch syntactic variation has become available. It is also one of the earliest syntactic atlases anywhere. SAND1 contains 145 maps showing the geographic distribution of syntactic phenomena in 267 Dutch dialects Figure 1: The Daan and Blok dialect map with respect to the following (reprinted from Daan and Blok 1969). domains related to the left periphery of the clause and/or pronominal reference: complementisers, subject pronouns, expletives, subject doubling, subject clitisation following yes/no, reflexive and reciprocal pronouns, and fronting. The SAND data were collected using various elicitation techniques (Cornips and Jongenburger 2001), including the use of questions such as “Does this sentence occur in your dialect?” and “How common is this sentence in your dialect?”. Therefore, multiple variants may occur for an elicited syntactic feature at a given dialect location. To illustrate the syntactic variation data and the feature/variant terminology used throughout this article, an example of an elicited syntactic feature and its recorded feature variants is given in Table 1.1 Table 1: Example of a syntactic feature and its recorded variants. Map 68a in SAND1 shows the geographic distribution of the syntactic feature weak reflexive pronoun as object of inherently reflexive verb. Five feature variants have been recorded for this phenomenon throughout the Dutch language area: zich, hem, zijn eigen, zichzelf, hemzelf. Feature: Variants:
Weak reflexive pronoun as object of inherently reflexive verb {zich, hem, zijn eigen, zichzelf, hemzelf}
Example:
Jan herinnert zich dat verhaal John remembers himself that story "John certainly remembers that story."
wel. AFFIRMATIVE
To summarise, the feature-oriented SAND project has provided a database of observed variants per syntactic feature per geographic location. For this locationoriented dialectometric research, these lists of locations per feature have been
4 Marco Rene Spruit transformed into lists of occurring feature variants per location. Using this representation the number of variant differences between pairs of locations can be measured.
4.
Measuring syntactic variation using Hamming distance
The Hamming distance is calculated between each pair of dialect locations to obtain a measurement based on binary comparisons between feature variants. In this straightforward procedure the distance between dialect A and dialect B is increased by 1 for each variant that is observed in dialect A but not in dialect B, and vice versa. An outline of the Hamming distance algorithm is shown in Table 2. Table 2: Hamming distance algorithm applied to measure syntactic variation in dialects. for each pair of dialects A and B; for each variant of all syntactic features; if it does occur in dialect A, but does not occur in dialect B or if it does not occur in dialect A, but does occur in dialect B; increment the distance between dialect A and B by 1.
(level 1) (level 2) (level 3) (level 4)
Calculating the Hamming distances between all dialect pairs results in a table of differences. In this distance matrix each distance value represents the total number of different feature variant realisations between one pair of dialects. Note that a distance matrix is always symmetric because the distance from dialect A to dialect B is always identical to the distance from dialect B to dialect A. A small fragment of the SAND1 distance matrix is shown in Table 3. To illustrate the measurement procedure described in Table 2, consider the dialects Lunteren and Veldhoven from Table 3 and the feature weak reflexive pronoun as object of inherently reflexive verb with associated variants as listed in Table 1. The variants zich and zijn eigen were recorded in Lunteren and the variant zich was registered in Veldhoven. During the calculation of the Hamming distance between this pair of dialects (level 1), the number of differences for the feature weak reflexive pronoun as object of inherently reflexive verb needs to be determined (level 2). The variant zich is available in both dialects, therefore the dialect distance is not increased. Also, since the variants hem, zichzelf and hemzelf in the context of this feature do not occur in either of these two dialects, they have no effect on the distance value either. The variant zijn eigen, however, occurs in Lunteren but not in Veldhoven (level 3). Therefore, the dialect distance between Lunteren and Veldhoven is incremented by 1 (level 4). Thus, after this
Classifying Dutch dialects using a syntactic measure 5 series of comparisons 5 out of 510 feature variants have been measured in order to determine the Hamming distance between this pair of dialects. This procedure is executed for all 266 dialect pairs and results in the distance matrix a part of which is shown in Table 3.
118 63 59 75
122 137 118 117 113 123
Sint-Truiden 79 82 63 117 72 74
Houthalen
57 137 82 52 70
54 57
Veldhoven
69
Doel
69 54 122 79 49 75
Hollum
Lunteren Bellingwolde Hollum Doel Sint-Truiden Veldhoven Houthalen
Bellingwolde
Dialect
Lunteren
Table 3: Fragment of the SAND1 Hamming distance matrix. Each dialect pair distance is an integer between 0 and 510 which represents the total number of different feature variant realisations.
49 52 59 113 72
75 70 75 123 74 58
58
Finally, note that this measuring method does not yet take syntactic information into account. For example, the measurement could assign a distance value < 1 when the reflexive feature variants zich and zichzelf are compared and a distance value > 1 when the distance between the variants zich and zijn eigen is determined. An even greater distance value might be assigned when one of the two dialects under comparison is lacking reflexive feature variants altogether. In its current form the distance value is incremented by 1 for all differing variant pairs. This is a generally applicable method that measures the number of differences between two sets of syntactic variants. Therefore, it is also useful as a reference measure for more advanced measurements that do take into account syntactic properties. In addition, the measurement could be refined by taking into account statistical information such as the number of variant occurrences and the number of alternative variants per feature.
6 Marco Rene Spruit 5.
Analysing dialect distances using multidimensional scaling
Multidimensional scaling (MDS) is applied to analyse the dialect relationships in the distance matrix. The goal of this procedure in this context is to optimally represent the most differentiating feature variants for each dialect in relation to all other dialects. The results are visualised with dialect colour maps. First described in Torgerson (1952), MDS is a statistical technique for producing a lower-dimensional data set suitable for visualisation from a highdimensional data set, while preserving the distance relationships of the highdimensional data set as faithfully as possible. Applied to the visualisation of the syntactic distance matrix in Table 3, the set of 510 variant dimensions for each dialect is first scaled down to a coordinate in a three-dimensional space which represents an optimal interpolation of the most differentiating dialect variants. The coordinates do not directly correspond to actual variant values. Then, the three-dimensional coordinates are used as values between light and dark of the three colour components red, green and blue to give each dialect location a unique composite colour. Neighbouring dialect locations will have corresponding colours if there is a correlation between geographic distance and syntactic distance. In other words, a perfect correlation will result in a colour continuum, whereas a low correlation will result in a mosaic-like map.2 Note that in this application of MDS only the relations among the colour components are fixed. The assignment of the colour components to the variant dimensions is arbitrary in itself. Therefore, swapping colour components may have a substantial effect on the visual result, especially for people with red/green colour blindness. Also, the three colour components contribute differently to the brightness of a map when viewed on a computer screen than when viewed on paper. Therefore, MDS map regions might deviate to an extent depending on viewer perception and communication medium. Finally, although several MDS methods are available for reducing the set of 510 feature variant dimensions, only the Classical MDS procedure is used in this work. This method is known as a metric MDS procedure because it uses the actual distance values. In non-metric procedures like Kruskal's Non-metric MDS and Sammon's Non-linear Mapping, the ranks of the distance values are used instead.
Classifying Dutch dialects using a syntactic measure 7 6.
Classifying Dutch dialects using a syntactic measure
In this section, the results of the application of the MDS procedure to the syntactic distance matrix are presented. First, an overview of the results is given. Then, the results for each of the seven SAND1 domains are reviewed. Finally, the aggregate SAND1 MDS dialect map is presented in Figure 6. Table 4: Correlation between the original sets of SAND1 feature variants and the corresponding representation after reducing each set to three dimensions via MDS. Syntactic domain Complementisers Subject pronouns Expletives Subject doubling Subject clitisation following yes/no Reflexive and reciprocal pronouns Fronting SAND1
# variants 101 172 13 54 30 78 62 510
% variants 19.8 33.7 2.5 10.6 5.9 15.3 12.2 100.0
Correlation (r) 0.94660937 0.88065714 0.87393870 0.95438211 0.99025193 0.93453301 0.77975377 0.95905712
The correlation between the original set of feature variants for each syntactic domain and the corresponding representation after reducing each set to three dimensions via MDS is shown in Table 4. In most applications correlations below 0.8 tend to be too inaccurate to be interpreted meaningfully, whereas results between 0.9 and 1 are generally considered to be high. Therefore, based on the values in Table 4, the MDS dialect maps can be expected to visualise the actual dialect classification quite accurately. A general impression of the effect of each syntactic domain on the aggregate SAND1 correlation value in the last row of Table 4 can be obtained by combining the correlation value with the relative number of feature variants that were included in the measurement in relation to the total number of variants in SAND1 as listed in column 3. Figure 2 visualises the syntactic distances between the Dutch dialects with respect to complementisers based on 101 variant comparisons for each dialect pair. This is almost 20% of 510, the total number of available SAND1 variants. The correlation value of 0.94 means that this map visualises the geographic distribution of complementisers quite accurately. Figure 2 shows a distinct correlation between geographic distance and variation with respect to complementisers, since neighbouring dialect locations have corresponding colours. The result is a colour continuum with more or less clustered dialect areas.
8 Marco Rene Spruit
Figure 2: MDS map visualising syntactic distances with respect to complementisers.
Figure 3: MDS map visualising syntactic distances with respect to subject pronouns.
Figure 3 visualises the syntactic distances with respect to subject pronouns, based on 172 variant comparisons per dialect pair. This syntactic domain comprises about one-third of the total number of available variants in SAND1. Therefore, it has a substantial effect on the aggregate SAND1 dialect map. The correlation value of 0.88 between the original data and the dimension-reduced data is rather high, meaning that this map visualises the geographic distribution of subject pronouns quite well. Furthermore, note that most borders of the colour-clustered areas in Figure 3 are almost identical to the discernable regions in Figure 2. Only a description of the MDS dialect map is provided for the data with respect to expletives, which is based on merely 13 variant comparisons per dialect pair. This is only 2.5 percent of the total number of available variants in SAND1. The resulting map is a mosaic of dialect colours which indicates a weak correlation between geographic distance and syntactic distance, since neighbouring dialect locations do not have corresponding colours. But, even though the map does not show a colour continuum, the correlation value of 0.87 is still quite high. However, this can be explained by the fact that only 13 feature variant dimensions were used, which is not enough data for the MDS procedure to be reliably represented in three dimensions.
Classifying Dutch dialects using a syntactic measure 9
Figure 4: MDS map visualising syntactic distances with respect to reflexive and reciprocal pronouns.
Figure 5: MDS map visualising syntactic distances with respect to fronting.
Figure 4 visualises the syntactic distances with respect to reflexive and reciprocal pronouns based on 78 variants. This is 15 percent of the total number of available SAND1 feature variants. Again, the correlation value of 0.93 is quite high. Interestingly, the map in Figure 4 significantly resembles the descriptive Dutch dialect area classification with respect to reflexives in Barbiers and Bennis (2004). In this description, which is also based on SAND1, five main dialect areas are distinguished: an eastern group, a Frisian area, a West- and EastFlemish region, a Flemish Limburg group and an Antwerp and south-west and central Dutch area. Contours of these generalisations can also be found on the map in Figure 4. Figure 5 shows the correlation between geographic and syntactic distance with respect to fronting, based on 62 variants per dialect pair. This is about 12 percent of the total number of SAND1 variants. This mosaic-like map clearly illustrates that there is little significant correlation between geographic distance and syntactic distance because many neighbouring dialect locations do not have corresponding colours. This may indicate that the SAND1 fronting data is actually made up of several fronting subdomains which do not have corresponding geographic distributions. This analysis would explain the low correlation value of 0.78 as an indication that the fronting data is of a too heterogeneous nature to be accurately displayed in one three-dimensional MDS map. In other words, at least four dimensions would be required in order to adequately represent the fronting data. This observation makes the aggregate SAND1 dialect map even more interesting.
10 Marco Rene Spruit
Figure 6: The SAND1 MDS dialect map based on a syntactic Hamming distance measure.
Figure 7: The Daan and Blok dialect map based on subjective judgements (see also Figure 1).
The SAND1 MDS dialect map is shown in Figure 6. This map visualises the correlation between geographic distance and syntactic variation in Dutch dialects. As can be seen in Figure 6, aggregating all these different distribution patterns in the SAND1 domains, including the heterogeneous fronting data, results in a remarkably homogeneous colour continuum with easily discernable dialect regions. Also note the strikingly high correlation value of 0.96, considering the diversity of the SAND1 data domains. This means that only few of the most differentiating distance relationships were lost during the MDS procedure. Therefore, the SAND1 MDS dialect map in Figure 6 can be considered a reliable visualisation of syntactic variation in Dutch dialects.
7.
Comparing the computational and perceptual dialect classifications
In Figures 6 and 7 the computational MDS dialect map based on a syntactic measure is shown next to the perceptual Daan and Blok dialect map based on subjective judgements. The correspondence between the objective and the subjective classification of Dutch dialect varieties is quite remarkable. The classification of the Dutch dialects in the bottom half of both maps is nearly identical, although significant differences are visible as well in the central eastern and central western regions. The MDS dialect map only reveals a few
Classifying Dutch dialects using a syntactic measure 11 relatively subtle dialect area borders in the top half of the map, whereas the Daan and Blok dialect map shows many dialect area borders within this region. These discrepancies might indicate that these distinct dialect borders do not exist on a syntactic level or that these borders have been fading during the last century. However, considering the resemblance between the Flemish area on the Daan and Blok dialect map as classified by Belgian dialectologists and the Flemish region on the MDS dialect map, it seems that local dialect speakers' prejudice might also play a significant differentiating role in perception of syntactic variation between neighbouring dialects in the Netherlandic part of the Daan and Blok dialect map. Furthermore, non-expert dialect speakers tend to be more sensitive to lexical and phonological differences than to variation on a syntactic level. The correspondence between the Frisian area and the Limburg region with respect to subject pronouns in Figure 3 is still visible in Figure 6 as shades of purple. Although this might indicate a SAND1 data bias with respect to subject pronouns, it also shows a non-local dialect area relation that could never have been derived using Daan and Blok's arrow method. To conclude, a few notable highlights of this dialectometric perspective on syntactic variation are provided. First, the objective classification of Dutch dialect varieties based on a syntactic measure highly resembles the classification based on subjective judgements on the Daan and Blok dialect map. Second, the Belgian dialect classification on the Daan and Blok map based on more objective expert judgements corresponds to a higher degree with the classification based on the objective syntactic measure than with the Netherlandic dialect classification based on intuitive judgements. These two points confirm and validate the syntactic measurement method. Third, although syntactic variation appears in many feature dimensions, its aggregate geographic distributions can be represented accurately in merely three dimensions after reduction via MDS. This is a computational confirmation of the intuition that syntactic variation is organised in groups of related patterns. Additional research will include refinements of the syntactic measure and analysis of feature dependencies for further exploration.
Notes * This research is being carried out in the context of the NWO project The Determinants of Dialectal Variation, number 360-70-120, P.I. J. Nerbonne. Please visit http://dialectometry.net for more information and relevant software. I would like to thank Hans Bennis, Sjef Barbiers, John Nerbonne and an anonymous reviewer for their helpful comments on an earlier version of this paper.
12 Marco Rene Spruit 1. 135 out of 145 maps in SAND1 contain unique geographic distributions of syntactic phenomena. Each of these 135 maps represents one syntactic feature and each map symbol represents one feature variant in the context of this work. 2. The space between dialect locations on the MDS maps is partitioned by using the Delaunay triangulation to obtain a pattern of polygons known as Voronoi polygons or Dirichlet tessalation. This technique for determining dialect areas is also used in Goebl (1982) and Heeringa (2004). Alternatively, an interpolation procedure could be applied to colour the space between dialect locations.
References Barbiers, S., H. Bennis, M. Devos, G. de Vogelaer, M. van der Ham, eds., (2005). Syntactic Atlas of the Netherlandic Dialects, volume 1. Amsterdam University Press, Amsterdam. Barbiers, S. and H. Bennis (2004). 'Reflexieven in dialecten van het Nederlands. Chaos of structuur?' In J. de Caluwe & G. de Schutter & M. Devos et al., eds., Schatbewaarder van de taal. Johan Taeldeman. Liber Amicorum. Academia Press Gent en Vakgroep Nederlandse Taalkunde Universiteit Gent, Gent, 43-58. Cornips, L. and W. Jongenburger (2001). 'Elicitation techniques in a Dutch syntactic dialect atlas project'. In H. Broekhuizen and T. van der Wouden, eds., Linguistics in the Netherlands 2001, John Benjamins, 53-63. Daan, J. and D.P. Blok (1969). Van Randstad tot Landrand; toelichting bij de kaart: Dialecten en Naamkunde, volume XXXVII of Bijdragen en mededelingen der Dialectencommissie van de Koninklijke Nederlandse Akademie van Wetenschappen te Amsterdam. Noord-Hollandsche Uitgevers Maatschappij, Amsterdam. Goebl, H. (1982). Dialektometrie; Prinzipien und Methoden des Einsatzes der numerischen Taxonomie im Bereich der Dialektgeographie, volume 157 of Philosophisch-Historische Klasse Denkschriften. Verlag der Österreichischen Akademie der Wissenschaften, Vienna. With assistance of W.-D. Rase and H. Pudlatz. Goeman, T. (2000) 'Perception of Dialect Distance: Standard and Dialect in Relation to New Data on Dutch Varieties '. In D. Long and D. Preston, eds., Handbook of perceptual dialectology Volume II 2000, John Benjamins, 137-151. Heeringa, W. J. (2004). Measuring Dialect Pronunciation Differences using Levenshtein Distance, PhD thesis Rijksuniversiteit Groningen, Groningen. Nerbonne, J. and W. Kretzschmar (2003). 'Introducing Computational Methods in Dialectometry'. In J. Nerbonne and W. Kretzschmar, eds., Computational Methods in Dialectometry, Special issue of Computers and the Humanities 37(3), 245-255. Séguy, J. (1971). La relation entre la distance spatiale et la distance lexicale, Revue de Linguistique Romane 35, 335–357. Torgerson, W. S. (1952). Multidimensional scaling: I. Theory and method. Psychometrika 17, 401-419.