Australasian Physical & Engineering Sciences in Medicine https://doi.org/10.1007/s13246-018-0643-x
SCIENTIFIC PAPER
Classifying dysmorphic syndromes by using artificial neural network based hierarchical decision tree Merve Erkınay Özdemir1 · Ziya Telatar2 · Osman Eroğul3 · Yusuf Tunca4 Received: 4 December 2017 / Accepted: 23 April 2018 © Australasian College of Physical Scientists and Engineers in Medicine 2018
Abstract Dysmorphic syndromes have different facial malformations. These malformations are significant to an early diagnosis of dysmorphic syndromes and contain distinctive information for face recognition. In this study we define the certain features of each syndrome by considering facial malformations and classify Fragile X, Hurler, Prader Willi, Down, Wolf Hirschhorn syndromes and healthy groups automatically. The reference points are marked on the face images and ratios between the points’ distances are taken into consideration as features. We suggest a neural network based hierarchical decision tree structure in order to classify the syndrome types. We also implement k-nearest neighbor (k-NN) and artificial neural network (ANN) classifiers to compare classification accuracy with our hierarchical decision tree. The classification accuracy is 50, 73 and 86.7% with k-NN, ANN and hierarchical decision tree methods, respectively. Then, the same images are shown to a clinical expert who achieve a recognition rate of 46.7%. We develop an efficient system to recognize different syndrome types automatically in a simple, non-invasive imaging data, which is independent from the patient’s age, sex and race at high accuracy. The promising results indicate that our method can be used for pre-diagnosis of the dysmorphic syndromes by clinical experts. Keywords Dysmorphic syndrome · Classification · Artificial neural network · Hierarchical decision tree · Pre diagnosis
Introduction
* Merve Erkınay Özdemir
[email protected] Ziya Telatar
[email protected] Osman Eroğul
[email protected] Yusuf Tunca
[email protected] 1
Department of Electrical‑Electronics Engineering, Faculty of Engineering and Natural Sciences, Iskenderun Technical University, Iskenderun, Turkey
2
Department of Electrical‑Electronics Engineering, Faculty of Engineering, Ankara University, Ankara, Turkey
3
Department of Biomedical Engineering, Faculty of Engineering, TOBB University of Economics and Technology, Ankara, Turkey
4
Department of Medical Genetics, Gülhane Training and Research Hospital, Ankara, Turkey
Dysmorphic syndromes cause distinctive abnormalities of both the body and the face and each syndrome can be recognized by its own characteristics. The presence of a specific facial pattern in patients with a genetic syndrome indicates that there is consistency in the phenotypic expression of the affected genes [1]. Patients with the same syndrome have similar malformations, where the facial patterns provide important clues for diagnosing syndrome types. Generally, in the current applications, the experts compare the clues of face appearances of patients with the face appearances of the definite diagnosed patients by using their previous experience and knowledge provided in the reference books [1] and in the other sources [2]. This application is subjective and takes longer time also requiring a high degree of experience and expertise. So, the diagnostic accuracy is highly dependent on the experts’ experience. To speed up pre-diagnosis and eliminate subjectivity, computer-assisted objective methods are needed. The fast development of image processing and machine learning techniques facilitates the detection of facial dysmorphic features.
13
Vol.:(0123456789)
There is a limited number of computer based studies in literature on discriminating and recognizing dysmorphic syndromes. The authors in [3] detect down syndrome using independent component analysis for feature extraction. For classification k-NN, SVM, random forest and LDA was used. The classification accuracy with LDA was 96.7%. In [4], 14 different syndromes was classified using Gabor Wavelet features and 21% accuracy was obtained. The authors developed an automatic method for Down syndrome detection in [5]. Their method based on local binary patterns for feature extraction and changed Manhattan distance for classification and with overall classification accuracy was 95.3%. Five different syndrome types were classified in [6]. In this study, 55 photographs of patients were preprocessed by using Gabor wavelet transformation. By comparing the feature vectors (jet voting technique) syndromes were classified with a 76% of an accuracy rate. The study in [7] was conducted by analysing various pictures of patients, each being affected with one of 10 dysmorphic syndromes. A Gabor wavelet transformation was applied to each picture. Three different techniques, including Linear Discriminant Analysis (LDA), Support Vector Machines (SVM) and k-Nearest Neighbours (k-NN) were applied for classification. The classification accuracy rate was varies from 52.1 to 75.7%. The authors of [8] increased the number of syndromes from 10 in their previous study to 14, and they included a side view pose for their analysis and they scrutinized the effect of geometrical information. They used Gabor wavelet transform for the feature extraction and LDA, SVM and k-NN techniques for classification. The classification accuracy varied from 52.5 to 76.1%. In the same study, classification accuracy rate with LDA technique was obtained as 93.1% when they examined wavelets for feature extraction with combined poses (frontal and side view). The other study [9] used the Elastic Bunch Graph and neural network to differentiate the Down syndrome and healthy individuals. Classification accuracy was 68.7%. The authors in [10] used a dense surface model (DSM) method in their database of 3-D face images with the individuals of 2 syndromes types and healthy, and they applied nearest mean technique for classification. They obtained 95% classification accuracy. In other study of the authors [11], they also used DSM method for 4 syndromes types by extending the technique for complete face, and they applied closest mean, LDA, SVM methods for classification. They separated the syndromes into two different groups and for each group they classified two syndromes. The classification accuracy varied from 76 to 100%. Kurt and Nabiyev [12] recognized Down syndrome using local binary patterns method for feature extraction. The authors used the euclidean distance and the changed Manhattan distance methods comparatively. The classification accuracy was 95.3%. In [13], authors classified two dysmorphic syndromes and a healthy group. They examined semi-automatic method for
13
Australasian Physical & Engineering Sciences in Medicine
the feature extraction and used artificial neural network to classify them. The classification accuracy was obtained up to 86% for single network. In the other study [14], the authors also extended their study by classifying 3 dysmorphic syndromes and a healthy group. In this extended study, the classification accuracy decreased to 76.3% because of the increasing number of groups classified. Kuru et al. [15] developed a visual diagnostic decision support system employing machine learning algorithms and digital image processing techniques for automated diagnosis in medical genetics. This approach uses facial features in reference images of disorders to identify visual genotype–phenotype interrelationships. They tested their algorithm with 92 subjects of 15 different syndromes. Their overall classification performance was reported as 83%, while the overall average success rate in syndrome recognition of five specialists was about 50.6%. Authors of [16] proposed a study for classification of Down syndrome in ultrasound images. They extracted the features using Haralick features and classified them using SVM classifier. They reported 94.4% of accuracy for overall Nuchal Translucency (NT) image classification. In [17], authors used principal component analysis (PCA) and linear discriminant analysis (LDA) for feature extraction and classification of three dysmorphic syndrome. They obtained eigenfaces from the images and classified the input face images by neural network. Their diagnosis success rate is proposed as 87%. Zhao et al. [18] proposed a method for Down syndrome detection based on disease-specific facial patterns. They obtained geometric and local texture features to describe facial morphology and structure. They also used independent component analysis technique to accurately locate the anatomical facial landmarks. They obtained the best performance as 96.7% in discriminating between Down syndrome and healthy populations. Rai et al. [19] collected the limited studies in this area in a survey paper. They gave current state of the arts of the studies about genetic syndrome classification based on 2D and 3D imaging. The success rates in classification of different dysmorphic syndromes are reported between 70 and 99.5% depending on the number of syndrome types used in the studies. As seen from the previous studies in literature, Neural Network based classifiers have been preferred as their performances in discriminating limited number of syndrome types. Unfortunately, the recognition rate decreases when the syndrome types increased [13, 14]. For that reason, new expert structures are required. In this paper, we introduced a new decision tree based classification method to recognize five different type dysmorphic syndromes and healthy children. We extracted 18 descriptive features from five different syndrome types and healthy. Based on the related studies given in our reference list, feature extraction and classification methods are entirely different than our feature extraction and classification
Australasian Physical & Engineering Sciences in Medicine
method. For our technique presented in this study, the photographs were initially preprocessed to obtain same parametric space by considering malformations of each syndrome mentioned and then the reference points were marked on the face images. The distances between the marked points were measured and ratios of the related distances were calculated. Then, an artificial neural networks based Hierarchical Decision Tree structure was implemented for classification process. The paper is organized as follows: in “Materials and methods” section, materials and method used in this study is introduced. “Experimental results” section presents some results of the experiments. Finally, some concluding remarks are given in “Conclusions” section.
Materials and methods Patients and image database A total of 160 face images of five different dysmorphic syndromes (Fragile X, Hurler, Prader Willi, Down, Wolf Hirschhorn syndromes) and healthy children are used in this study. The ages are in the range of 1–12 years old. Table 1 gives the breakup for individual syndromes. The image database of healthy children is created by us, while the image database of the children who have the syndromes was collected from the internet which are freely available on the Web pages [20–22]. Table 1 Syndrome types and the number of images for each group Groups
Number of images
Healthy Fragile X syndrome Hurler syndrome Prader Willi syndrome Down syndrome Wolf Hirschhorn syndrome
37 48 30 12 22 11
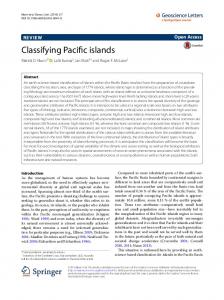
The resolutions, illumination and poses of the images are different, they are not the same standard because of the image database of the children who have the syndromes are obtained from the internet. A sample image defining for each syndrome can be seen in Fig. 1.
Pre‑processing of images The sizes of images in the database are different and each photograph should be scaled at the same dimensions to achieve the best feature extraction. For this purpose, unnecessary parts of whole image are carefully removed in order to focus only on the face region. In order to focus only region of facial features, all images are cropped by an optimum size of 155 × 172 pixels. The cropped face images are then examined by image enhancement techniques (histogram equalization), in order to remove illumination variations. Thus, dark or low contrast images are enhanced and better features can be obtained.
Feature extraction from marked points on the face Malformations of the face images are the signs of different type of dysmorphic syndromes. These malformations can be marked as reference points of healthy and dysmorphic childrens’ face images. The distinct signs of malformations on the face for Fragile X syndrome are defined with long and wide forehead, long face, large and prominent ears; patients with Hurler syndrome are recognized with large head, thick lips, short upturned nose, thick eyebrows; Prader Willi syndrome is defined with almond-shaped eyes, thin upper lip, small mouth, distinct and narrow facial features; Down syndrome is defined with ears lower than normal levels, separated and almond-eyes and small mouth; Wolf Hirschhorn syndrome is given with prominent forehead, flat nasal bridge, small upper lip, and separated eyes [1, 2, 13, 14]. These signs on the face images can be used to define the malformations as feature references. On the other hand, the features are extracted from the patients’ face images by measuring the distances between the marked points for each syndrome. Then syndrome group and healthy group of feature points
Fig. 1 Face appearance samples of five dysmorphic syndromes. a Fragile X, b Hurler, c Prader Willi, d Down syndrome, e Wolf Hirschhorn
13
Australasian Physical & Engineering Sciences in Medicine
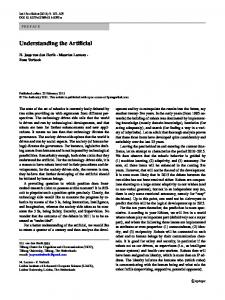
database. All features are made of considering to the malformations after examining a number of experiments on the sample face images. Totally, 18 features are examined defining 5 syndrome types for each face image. Table 4. gives the standard and mean absolute deviations of each syndrome types and healthy group features and Fig. 3. shows Boxplot figures of each syndrome types and healthy group.
Preparation of training and test samples
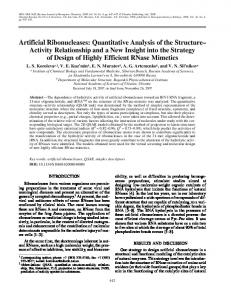
Fig. 2 The marked and labeled points for feature extraction
are marked and enumerated as shown in Fig. 2. Table 2 gives the definitions and the distances between the marked points. Table 3 shows the descriptive features computed from the distance measurements for all syndrome types in our
From our database 30 face images out of 160 is selected for testing the classifiers. These 30 images were randomly selected through 160 images in our database. These 30 images weren’t used in training of any of the classifier structure. 8 of these images belong to Healthy samples, 8 of them belong to Fragile X syndrome, 5 of them belong to Hurler syndrome, 2 of them belong to Prader Willi syndrome, 4 of them belong to Down syndrome, and 3 of them belong to Wolf Hirschhorn syndrome. For classifiers’ training were used 130 face images.
Table 2 Definition of features on face image in Fig. 2
Lengths
Explanation
Face length, dYU Face width, dYE Ear length, dKU Ear width, dKE Nose length (nose peak point), dBUU Nose length (nose end point), dBUA Upper lip length, dDÜU Eyebrow thickness (its center), dKKO Eyebrow thickness (its end), dKKU Eye length, dGU Eye width, dGE Eyebrow length, dKU Mouth length, dAU Mouth width, dAE Distance between two eyes, dGAU Nose width, dBKU Nasal root length,dBK-U
The distance between the points 1 and 7 The distance between the points 5 and 8 The distance between the points 3 and 6 The distance between the points 4 and 5 The distance between the points 22 and 14 The distance between the points 22 and 15 The distance between the points 15 and 16 The distance between the points 10 and 11 The distance between the points 12 and 13 The distance between the points 23 and 24 The distance between the points 27 and 26 The distance between the points 28 and 29 The distance between the points 18 and 19 The distance between the points 16 and 17 The distance between the points 23 and 25 The distance between the points 20 and 21 The distance between the points 2 and 22
Table 3 Descriptive features set obtained from face image in Fig. 3
Lengths and ratios
13
FYU,AU = dYU/dAU FYU,KKU = dYU/dKKU FYU,DÜZ = dYU/dDÜU FKU,KKU = dKU/dKKU FBUU,BKU = dBUU/dBKU
FYU,KU = dYU/dKU FYU,KKO = dYU/dKKO FBUU,DÜU = dBUU/dDÜU FKU,KKO= dKU/dKKO FBUA,BKU = dBUA/dBKU
FKU,KE = dKU/dKE FYU,BUA = dYU/dBUA FBUA,DÜU = dBUA/dDÜU FAU,AE = dAU/dAE
FYU,YE =dYU/dYE FYU,BUU = dYU/dBUU FGU,GE = dGU/dGE FGAU,BK-U = dGAU/dBK-U
Australasian Physical & Engineering Sciences in Medicine
a
b
60
80 50
70 60
40
50 30
40 30
20
20 10 10 0
0 1
2
4
3
5
6
7
8
9
10 11 12 13 14 15 16 17 18
1
2
4
3
5
7
6
8
Features
c
10 11 12 13 14 15 16 17 18
9
Features
d 80
60
70
50 60
40
50 40
30
30
20
20
10
10 0
0 1
2
4
3
5
6
7
8
9
1
10 11 12 13 14 15 16 17 18
2
4
3
5
7
6
8
e
9
10 11 12 13 14 15 16 17 18
Features
Features
f
80
50 70
45
60
40 35
50
30 40
25
30
20 15
20
10 10
5
0
0 1
2
3
4
5
6
7
8
9
10 11 12 13 14 15 16 17 18
Features
1
2
3
4
5
6
7
8
9
10 11 12 13 14 15 16 17 18
Features
Fig. 3 Boxplot figures of each syndrome types and healthy group a Fragile X, b Hurler, c Prader Willi, d Down, e Wolf Hirschhorn and f healthy
13
Table 4 Standard and mean absolute deviations of each syndrome types and healthy group features (FYU,KU, FKU,KE, FYU,YE, FYU,KKU, FYU,KKO, FYU,BUA, FYU,BUU, FYU,DÜU, FBUU,DÜU, FBUA,DÜU, FGU,GE, FKU,KKU, FKU,KKO, FAU,AE, FGAU,BKU, FBUU,BKU, FBUA,BKU respectively)
Australasian Physical & Engineering Sciences in Medicine Groups
Standard deviations
Fragile X
0.3295 12.1301 2.6911 2.4920 0.1736 0.3513 9.0427 2.3158 2.0170 0.1046 0.3132 19.5547 3.1272 4.6310 0.1399 0.2970 10.1788 3.4715 2.2916 0.2268 0.3896 9.7107 4.4913 2.6393 0.1123 0.2718 14.6595 2.9548 2.8634 0.1412
Hurler
Prader Willi
Down
Wolf Hirschhorn
Healthy
Classification k‑Nearest neighbor and artificial neural network Initially k-nearest neighbor (k-NN) and artificial neural network (AAN) methods are used in classification process. They are commonly used in pattern recognition applications [23, 24]. Euclidean distance metric is used for the k-NN method. The k values are implemented which are varied as 1, 2, 4, 5, and 9 respectively. The best results after trying the k values are obtained for k = 4. Then, a multi layered feed forward ANN structure is established. In this ANN structure, there are 4 hidden layers: in the first, 17 neurons; in the second, 15 neurons; in the third, 18 neurons; and in the fourth hidden layer 20 neurons included. The number of hidden layers and the number of neurons in the hidden layers were decided
13
0.2961 7.7951 0.7056 1.6636 0.1682 0.5042 8.9247 0.3840 1.8861 0.1139 0.2870 10.2031 0.8005 2.4046 0.1132 0.3077 9.0344 0.9106 2.4037 0.2106 0.7092 10.1312 1.3412 2.6914 0.1072 0.3669 6.8279 0.6229 1.6504 0.1484
Mean absolute deviations 0.7312 0.8076 0.7138 0.5844
0.1066 1.3566 1.0476 0.4070
1.5508 0.7126 0.4486 0.7279
0.1237 1.4712 1.1882 0.5619
0.7679 0.6739 0.8001 1.4795
0.0670 1.5346 0.5880 0.5758
1.5720 0.7924 0.9374 0.7419
0.1007 1.4896 0.7965 0.5806
0.8961 0.5397 1.4290 1.3955
0.1098 0.7653 0.3943 0.9800
2.2575 0.6679 0.6926 1.3236
0.1038 1.0515 1.1577 0.5441
0.2582 7.7838 2.1235 1.6596 0.1390 0.2819 6.4615 1.6097 1.6231 0.0866 0.2238 15.0585 1.8699 3.5922 0.0998 0.2299 8.2609 2.6975 1.7354 0.1852 0.2636 8.1116 3.4213 1.9722 0.0932 0.2118 10.0566 2.2588 2.0777 0.1086
0.2393 5.8320 0.5875 1.2948 0.1305 0.4049 6.0482 0.3166 1.3973 0.0923 0.2497 8.0873 0.5541 1.8717 0.0783 0.2564 7.3310 0.6530 1.7461 0.1721 0.3857 8.6860 1.1247 2.0782 0.0859 0.2932 4.6029 0.4690 1.2202 0.1198
0.5497 0.6403 0.5840 0.3995
0.0799 1.0511 0.8023 0.3215
1.0984 0.5548 0.3543 0.5822
0.1003 1.2048 0.7447 0.4118
0.5854 0.3951 0.5359 0.9467
0.0600 0.9435 0.4061 0.4198
1.1901 0.6394 0.6941 0.6018
0.0671 1.1977 0.6278 0.4694
0.7487 0.4566 1.1591 0.9220
0.0912 0.6250 0.3163 0.5557
1.5585 0.4828 0.5278 0.8392
0.0790 0.8118 0.7309 0.4080
after making a number of experiments. Hyperbolic tangent sigmoid transfer function is used this ANN. Both k-NN and ANN are tested by using the 30 test samples including all syndrome types which never used in training phase. The test results for k-NN and ANN are given in Table 5. Overall accuracy is obtained as 50 and 70% for test samples k-NN and ANN respectively. Although the higher recognition rate is obtained with ANN against to the k-NN classifier we also investigate the impact of increasing the number of syndromes as compared to our earlier studies [13, 14]. The number of syndrome types is defined as 5 for this study and classification accuracies showed that, the ANN classification performances gradually decrease when the number of syndrome types is increased by using the same amount of samples in experiments. In order to increase the recognition rate, we changed our classifier structure and developed a new hierarchical neural network structure with a decision tree system.
Australasian Physical & Engineering Sciences in Medicine Table 5 k-NN and ANN classification results
Healthy Fragile X Hurler S Prader Willi S Down S Wolf Hirschhorn Overall
Number of test
Number of correct rec- Accuracy % ognition k-NN/ANN k-NN/ANN
8 8 5 2 4 3 30
4/6 6/6 1/2 0/2 2/2 2/3 15/21
50/75 75/75 20/40 0/100 50/50 66.6/100 50/70
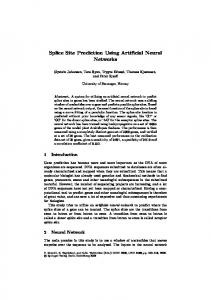
Neural network based hierarchical decision tree Figure 4 shows neural network hierarchical decision tree structure developed in this study. In this tree system, each network or branch represents a different ANN structure which recognizes one of the mentioned syndrome type. By combining these networks, a hierarchical decision tree is established. This system has six network to define all groups: Fragile X, Hurler, Prader Willi, Down, Wolf Hirschhorn and Healthy samples. Each branch of tree represents a specific ANN system which is trained to classifies one syndrome type. For testing any image, 18 facial features obtained from the test image and computations in Eq. 2 is applied to the image. After these process test image tested step by step for each network in Fig. 4. The algorithm ends when the image is recognized as one of syndrome types. This process continues until the test image is recognized. Based on the decisions of the current network, the algorithm ends or passes to the next steps. This process continuous in a same manner until it reaches to the last step. If the pattern cannot be recognized by the system for all networks, then the algorithm ends and classifies the pattern as ‘unknown’.
Accuracy =
In the decision tree classifier for each ANN structure performances, sensitivity and specificity measures were used. Sensitivity measures the proportion of actual positives (patients with disease) which are correctly identified. Specificity measures the proportion of negatives (healthy) which are correctly identified. Table 6 gives the confusion results to show the calculated values. Confusion matrix has two rows and two columns, which demonstrate the number of true positives (TP), false negatives (FN), false positives (FP), and true negatives (TN). Definitions of the terms in the Table 5 are given as, True positive; the patients are correctly diagnosed as patient, False positive; the non patients are incorrectly identified as patients, False negative; the patients are incorrectly identified as non patients, True negative; the non patients are correctly identified as non patients. Sensitivity is defined by Eq. (1) and specificity is defined by Eq. (2), F measure is defined by Eq. (3):
Sensitivity = True Positive Rate True Positive × 100 = True Positive + False Negative Specificity = True Negative Rate True Negative × 100 = True Negative + False Positive F Measure =
For all the networks in hierarchical decision tree, leave one out method is used for the training and testing because of the limited number of the facial images in our database. In the leave one out procedure, one image is left out as a test image and the ANN is trained by using the remaining images. This process is repeated many times by trying all the images in the database, so every image is examined as a test sample to evaluate the similarities to the others. For all the networks in hierarchical decision tree hyperbolic tangent sigmoid transfer function is used.
(2)
2 × True Positive 2 × True Positive + False Negative + False Positive × 100
(3)
Accuracy value was also used to show the classification performance. The accuracy is the rate of true results in the population. The formula of accuracy for classification is defined by Eq. (4).
True Positive + True Negative × 100 True Positive + False Negative + False Positive + True Negative
Training and test for each ANN in decision tree
(1)
(4)
Every ANN dedicated to recognize a unique syndrome in Fig. 4 has been trained and tested total 130 out of 160 face samples in our database. The training and the testing ANN structures in decision tree system is realized step by step as explained below for every network. Network 1 In this step of Hierarchical Decision Tree structure, an ANN structure decides the input pattern as healthy or not healthy. In the ANN structure, there are 3 hidden layers. In the first hidden layer, there are 27, followed by the second hidden layer of 15 and the third hidden layer of 5 neurons. In the train-
13
Australasian Physical & Engineering Sciences in Medicine
Fig. 4 Neural network based hierarchical decision tree classification system
Image
Feature Vector (1x18)
Network 1
Healty
Other
Network 2
Fragile X
Other
Network 3
Hurler
Other
Network 4
Prader Willi
Other
Network 5
Down
Other
Network 6
Wolf Hirschhorn
Table 6 Confusion matrix used for networks
Test positive Test negative
13
Disease present
Disease absent
True positives (TP) False negatives (FN)
False positives (FP) True negatives (TN)
Other
ing set of the healthy group, there are 29, while the other groups have 101 images (40 Fragile X, 25 Hurler, 10 Prader Willi, 18 Down, 8 Wolf Hirschhorn syndromes). Table 7 gives a confusion matrix in the sense of disease present or absent. NN outputs for Network 1 produce true result as 97 out of 101 samples.
Australasian Physical & Engineering Sciences in Medicine Table 7 Confusion matrix for the results of ANN outputs used in networks in hierarchical decision tree Networks
Disease present
Network 1 Test positive Test negative Network 2 Test positive Test negative Network 3 Test positive Test negative Network 4 Test positive Test negative Network 5 Test positive Test negative Network 6 Test positive Test negative
Disease absent
97 4
3 26
38 2
2 88
20 5
4 101
9 1
8 112
17 1
4 108
7 1
2 120
Table 8 Classification performances of ANN used for networks Networks
Sensitivity (%)
Specificity (%)
Accuracy (%)
F measure (%)
Network 1 Network 2 Network 3 Network 4 Network 5 Network 6
96 95 80 90 94 88
89 98 96 93 96 98
95 97 93 93 96 98
97 95 82 67 87 82
The test results for this step as given in Table 8 demonstrate that this structure has a high classification performance to distinct healthy or non-healthy sample. If the pattern is recognized as healthy in this step the algorithms ends, otherwise, the algorithm passes to the Network 2. Network 2 In this step, an ANN structure is established to classify and recognize the pattern as Fragile X or not. For this ANN structure, there are 3 hidden layers. In the first hidden layer 16, in the second layer 15, in the third layer 6 neurons are included. In the training set for Fragile X syndrome, there are 40, for other groups 90 (29 Healthy, 25 Hurler, 10 Prader Willi, 18 Down, 8 Wolf Hirscorn syndromes) images. Table 7 gives a confusion matrix in the sense of disease present or absent. ANN outputs for Network 2 produce correct result as 38 out of 2 samples.
The performance results for this step as given in Table 8 demonstrate that this NN structure has a high classification performance to identify the Fragile X and the others. If the pattern is recognized as Fragile X syndrome, the algorithm ends, otherwise the algorithm passes to the Network 3. Network 3 The ANN structure in this step, recognizes the pattern as Hurler or not. For the ANN structure, there are 5 hidden layers. The first hidden layer includes 25, the second hidden layer has 15, third hidden layer has 15, the fourth hidden layer has 14 and the fifth hidden layer has 5 neurons. For Hurler syndrome, 25 samples are used in the training set and for other group 105 (29 Healthy, 40 Fragile X, 10 Prader Willi, 18 Down, 8 Wolf Hirscorn syndromes) images are used. Table 7 gives a confusion matrix in the sense of disease present or absent. ANN outputs for Network 3 produce correct result as 20 out of 5 samples. The performance results for this step as given in Table 8 demonstrate that this ANN structure has a high classification performance to identify the Hurler syndrome and the others. If the pattern is recognized as Hurler syndrome, the algorithm ends, otherwise the algorithm continues and passes to the Network 4. Network 4 The ANN structure recognizes the pattern as Prader Willi or not for this Network. For this ANN structure, there are 4 hidden layers. In the first hidden layer 27, in the second hidden layer 15, in the third hidden layer 25, in the fourth hidden layer 15 neurons are included. In the training set for Prader Willi syndrome, there are 10 images and for the other group has 120 (29 Healthy, 40 Fragile X, 25 Hurler, 18 Down, 8 Wolf Hirschhorn syndromes) images. Table 7 gives a confusion matrix in the sense of disease present or absent. ANN outputs for Network 4 produce correct result as 9 out of 1 sample. Results given in Table 8 indicates that this ANN structure has successfully separated the Prader Willi syndrome from the other groups. If the pattern is recognized as Prader Willi syndrome, the algorithm ends, otherwise the algorithm continues and passes to the Network 5. Network 5 The ANN structure is used to recognize the pattern if that is Down syndrome or not. The ANN structure has three hidden layers. The first, the second and the third hidden layers include 24, 15 and 5 neurons, respectively. In this structure, 18 images for Down syndrome and for the other group has 112 (29 Healthy, 40 Fragile X, 25 Hurler, 10 Prader Willi, 8 Wolf Hirschhorn syndromes) images. Table 7 shows confusion matrix related to the test results obtained from outputs of the network. The system recognizes the Down syndrome as 17 out of 1 samples. The classification performance results given in Table 8 show that this ANN structure has successfully separated the
13
Australasian Physical & Engineering Sciences in Medicine
Down syndrome from the others. If the pattern is recognized as Down syndrome, the algorithm ends, otherwise the algorithm passes to the Network 6. Network 6 In this last network, ANN system decides to the pattern as Wolf Hirschhorn syndrome or not. For this ANN structure, there are three hidden layers. The first, the second and the third hidden layers consist of 25, 16, and 6 neurons respectively. In the training set of Wolf Hirschhorn syndrome 8 images and for the other group has 122 images (29 Healthy, 40 Fragile X, 25 Hurler, 10 Prader Willi, 18 Down) have been utilized. Table 7 shows confusion matrix related to the test results obtained from outputs of the network. The system recognizes the Wolf Hirschhom as 7 of 1 samples. The classification performance results given in Table 8 show that this ANN structure has separated the Wolf Hirschhorn syndrome from the others with a high success rate. If the pattern is recognized as Wolf Hirschhorn syndrome in the last step, the algorithm ends, if not the pattern cannot belong to any group and the system recognizes this pattern as ‘unknown’ and the algorithm completes entire process.
Experimental results The system developed in this study accurately classifies healthy and five different dysmorphic syndromes. Hierarchical decision tree based pre-diagnosis system automatically examines the different dysmorphic syndromes and decides the highly possible syndrome type from the face features of the patient. 30 face images which was mentioned before in “Preparation of training and test samples” section was used for testing the ANNs in the decision tree structure. Tests are conducted by using 18 features obtained from the books and expert physician definitions on face images as given in Table 2. Each feature was computed individually by our feature extraction algorithm and six classes were considered for the system output as Healthy, Fragile X, Hurler, Prader Wlli, Down, Wolf Hirschhom. Each test data mentioned above
Table 9 Classification test results of hierarchical decision tree and clinical experts Healthy Fragile X Hurler S Prader Willi S Down S Wolf Hirschhorn Overall
13
was applied to our decision tree based classifier and an output for each input was produced by the system in order to decide possible syndrome. All test results from the tests are presented in Table 9. The number of true recognition rate for ‘‘Healthy” case is computed by the system as 7 out of 8 samples. The correct recognition rate for this case is calculated as 87.5%. In the same way excluding the healthy case, the system found 19 true-pre-diagnostic results out of remaining 22 data marked again by expert physician for ‘‘Possible Pathologic” case. The performance of the algorithm for this class is computed as 86.3%. The success rate computed for this case lower than ‘‘Healthy” case, as this case can be defined either in ‘‘Healthy” or in ‘‘Pathologic cases”. The expert physician also defines this case as suspicious state. In order to test our Hierarchical Decision Tree algorithm, we randomly selected face images and were applied to the system one by one, and the system recognized these patterns. Overall recognition performance of the system was obtained as 86.7%. The result demonstrate that the system has separated the dysmorphic syndromes with a high accuracy. The same 30 images were shown to a clinical expert to see his evaluation and recognition performance on the syndromes. Information about syndrome types did not given to the expert. Only images were shown one by one and was questioned from him to recognize them without any time limitation. Expert recognized the same images with overall 46.7%. Syndrome recognition numbers for the expert and our system are shown Table 9.
Conclusions In this study, we developed a hierarchical decision tree structure capable of separating and recognizing five different dysmorphic syndromes and healthy groups accurately. We tried a new features set obtained from our face model and applied them to our ANN based decision tree structure in training and test phase. Our face model covers all the distinct points identifying syndrome types as similar to the expert
Number of test samples
Number of correct recognition our system/clinical expert
Accuracy (%) our system/clinical expert
8 8 5 2 4 3 30
7/6 6/5 4/1 2/0 4/2 3/0 26/14
87.5/75 75/63 80/20 100/0 100/50 100/0 86.7/46.7
Australasian Physical & Engineering Sciences in Medicine
physicians’ recognition. The test results also show that, our system provides a high performance in syndrome classification and recognition. The most important advantage of our decision tree system is to classify the dysmorphic syndromes with high accuracy independent from the increasing in syndrome types or branches in the tree. So, the new branches can be added to the system without affecting the current performances of the classifiers in the structure. The other advantage of the system is that it does not require a specific equipment, so only the face images are used for decision making and the system is free of change in image’s pose, size and illumination. Also, the system is independent from patient’s age, sex and race because of the selected feature set. This system can be used in pre-diagnosing and recognizing of the dysmorphic syndromes by the experts easily, or in the education of new experts in clinical studies. As a future study, new classifiers for different syndrome types can be added easily in the branches of hierarchical decision tree.
Compliance with ethical standards Conflict of interest Merve Erkınay Özdemir, Ziya Telatar, Osman Eroğul and Yusuf Tunca declares that they have no conflict of interest. Ethical approval This article does not contain any studies with human participants or animals performed by any of the authors.
References 1. Aase JM (1990) Diagnostic dysmorphology. Plenum Medical Book Company, New York 2. Shaner DJ, Peterson AE, Beattie OB, Bamforth JS (2001) Soft tissue facial resemblance in families and syndrome affected individuals. Am J Med Genet 102(4):330–341 3. Zhao Q, Okada K, Rosenbaum K, Kehoe L, Zand DJ, Sze R et al (2014) Digital facial dysmorphology for genetic screening: hierarchical constrained local model using ICA. Med Image Anal 18:699–710 4. Boehringer S, Guenther M, Sinigerova S, Wurtz RP, Horsthemke B, Wieczorek D (2011) Automated syndrome detection in a set of clinical facial photographs. Am J Med Genet A 155A(9):2161–2169 5. Burcin K, Vasif NV (2011) Down syndrome recognition using local binary patterns and statistical evaluation of the system. Expert Syst Appl 38:8690–8695. https : //doi.org/10.1016/j. eswa.2011.01.076 6. Loos HS, Wieczorek D, Wurtz RP, von der Malsburg C, Horsthemke B (2003) Computer-based recognition of dysmorphic faces. Eur J Hum Genet 11(8):555–560 7. Boehringer S, Vollmar T, Tasse C, Wurtz RP, Gillessen-Kaesbach G, Horsthemke B, Wieczorek D (2006) Syndrome identification based on 2D analysis software. Eur J Hum Genet 14(10):1082–1089
8. Vollmar T, Maus B, Wurtz RP, Gillessen-Kaesbach G, Horsthemke B, Wieczorek D, Boehringer S (2008) Impact of geometry and viewing angle on classification accuracy of 2D based analysis of dysmorphic faces. Eur J Med Genet 51(1):44–53 9. Erogul O, Sipahi ME, Tunca Y, Vurucu S (2009) Recognition of down syndromes using image analysis. In: National biomedical engineering meeting (BIYOMUT 2009), pp 1–4 10. Hammond P, Hutton TJ, Allanson JE, Campbell LE, Hennekam RC, Holden S et al (2004) 3D analysis of facial morphology. Am J Med Genet 126A(4):339–348 11. Hammond P, Hutton TJ, Judith E, Allanson JE, Buxton B, Campbell LE et al (2005) Discriminating power of localized threedimensional facial morphology. Am J Med Genet 77(6):999–1010 12. Kurt B, Nabiyev VV (2011) Down syndrome recognition using local binary patterns and statistical evaluation of the system. Expert Syst Appl 38(7):8690–8695 13. Erkınay M, Telatar Z, Eroğul O, Tunca Y (2011) Morphological features extracted from face images for diagnosis of dysmorphic syndromes and classification of dysmorphic syndromes. In: National conference on medical technologies (TIPTEKNO11), pp 80–83 14. Erkınay M, Telatar Z, Eroğul O, Tunca Y (2012) Dysmorphic syndromes classification and recognition with computer assisted system. In: The ninth IASTED international conference on biomedical engineering (BioMed 2012). https: //doi.org/10.231 6/P.2012.764-073 15. Kuru K, Niranjanb M, Tunca Y, Osvankd E, Azim T (2014) Biomedical visual data analysis to build an intelligent diagnostic decision support system in medical genetics. Artif Intell Med 62(2):105–118 16. Sonia R, Shanthi V (2014) Ultrasound image classification for Down syndrome during first trimester using Haralick features. Int J Eng Technol 6(2):781–788 17. Pandit D, Dhodiya J (2015) PCA and LDA method with neural network for primary diagnosis of genetic syndrome. Int Adv Res J Sci Eng Technol 2(10):124–128 18. Zhao Q, Okada K, Rosenbaum K, Kehoe L, Zand DJ, Sze R, Summar M, Linguraru MG (2014) Digital facial dysmorphology for genetic screening: hierarchical constrained local model using ICA. Med Image Anal 18(5):699–710 19. Rai MCEL, Werghi N, Muhairi HA, Alsafar H (2015) Using facial images for the diagnosis of genetic syndromes: a survey. In: International conference on communications, signal processing, and their applications (ICCSPA15), 17–19 February; Sharjah, UAE 20. Down Syndrome samples (2008) http://www.gunbil gin.com/searc h/label/ Down Sendro mu,www.gunosb orn.blogsp ot.com. Accessed May 2011 21. MPS Australia Mucopolysaccharide & Related Diseases Society Aust. Ltd (1983) http://www.mpssociety.org.au/gallery. Accessed May 2011 22. The Fragile X, Socaity UK (1990) http://www.fragilex.org. Accessed Sept 2011 23. Bijalwan V, Kumar V, Kumari P, Pascual J (2014) KNN based machine learning approach for text and document mining. Int J Database Theory Appl 7(1):61–70 24. Al-Allaf O (2014) Revıew of face detection systems based artificial neural networks algorithms. Int J Multimed Appl. https://doi. org/10.5121/ijma.2013.6101
13