Available online at www.sciencedirect.com
ScienceDirect Procedia Economics and Finance 23 (2015) 313 – 320
2nd GLOBAL CONFERENCE on BUSINESS, ECONOMICS, MANAGEMENT and TOURISM, 30-31 October 2014, Prague, Czech Republic
Classifying The EU Competitiveness Factors using Multivariate Statistical Methods Michaela Stanickova a* a
Faculty of Economics, VŠB-Technical University of Ostrava, Sokolská třída 33, 701 21 Ostrava, Czech Republic
Abstract Although the EU is one of the most developed parts of the world with high living standards, there exist huge disparities having a negative impact on the balanced development across the EU and weaken thus its competitiveness in the global context The aim of the paper is to define factors of socioeconomic development of the EU by application of factor analysis based on Country/Regional competitiveness index. The results of the analysis are factors that determine socioeconomic environment of the EU. Based on factor analysis results, it is possible to classify EU territories through cluster analysis in distinct group. © 2015 2014The TheAuthors. Authors.Published PublishedbybyElsevier Elsevier B.V. © B.V. This is an open access article under the CC BY-NC-ND license (http://creativecommons.org/licenses/by-nc-nd/4.0/). Selection and/ peer-review under responsibility of Academic World Research and Education Center. Selection and/ peer-review under responsibility of Academic World Research and Education Center Keywords: Cluster analysis, CCI, competitiveness, EU, factor analysis.
1. Introduction The economy’s entry into globalization phase has radically altered the nature of competition. Numerous new actors from every market in the world are simultaneously in competition on every market. This new competition has accentuated the interdependence of the different levels of globalization. Globalization has obliged all countries to raise their standards of economic efficiency, whence the growing interest in and concern about competitiveness: nations, regions and cities have no option but to strive to be competitive in order to survive in the new global market place and the ‘new competition’ being forged by the new information or knowledge driven economy (Gardiner Martin & Tyler, 2004). Policy-makers at all levels have been swept up in this competitiveness fever. This growing interest may perhaps be partly attributable to their awareness of the fact that all countries are having to contend with
* Michaela Stanickova. Tel.: + 420-597-322-230. E-mail address:
[email protected]
2212-5671 © 2015 The Authors. Published by Elsevier B.V. This is an open access article under the CC BY-NC-ND license (http://creativecommons.org/licenses/by-nc-nd/4.0/).
Selection and/ peer-review under responsibility of Academic World Research and Education Center doi:10.1016/S2212-5671(15)00508-0
314
Michaela Stanickova / Procedia Economics and Finance 23 (2015) 313 – 320
raised standards of economic efficiency as a result of the globalisation of goods and factor markets. The economy may be competitive but if the society and the environment suffer too much the country will face major difficulties, and vice versa. Therefore governments in the long run cannot focus alone on the economic competitiveness of their country; instead they need an integrated approach to govern the country. The complexity of competitiveness, decomposed by (Esser Hillebrand, Messner & Meyer-Stamer, 1995), is used in this paper – every country has common features which affect and drive the competitiveness of all the entities located there, even if the variability of competitiveness level of the entities within the country may be very high. In the European Union (EU), the process of achieving an increasing level of competitiveness is significantly difficult by the heterogeneity of countries and regions in many areas. Although the EU is one of the most developed parts of the world with high living standards, there exist significant disparities influencing a level of EU competitiveness in global context. From this point of view, the aim of the paper is to define the main factors of socioeconomic development determining competitiveness level of EU countries and to classify the EU Member States to homogenous groups based on their competitive factor endowment. 2. Data and methodology The empirical analysis starts from building database of indicators that are part of Country Competitiveness Index (CCI) approach – national level. Pillars of index are grouped according to the different dimensions (input versus output aspects) of national competitiveness they describe. The terms ‘inputs’ and ‘outputs’ are meant to classify pillars into those which describe driving forces of competitiveness, also in terms of long-term potentiality, and those which are direct or indirect outcomes of a competitive society and economy (Annoni & Kozovska, 2010). CCI data file consists of 66 CCI indicators – 38 inputs and 28 outputs. All CCI indicators are not used in the paper, because all indicators were not available for the whole reference period for each country – evaluated countries are EU27 (from analysis is excluded Croatia because of data no availability for many of indicators and being non EU Member or Candidate States for most of reference years). In this paper, only 61 indicators are used – 37 for inputs and 24 for outputs. Reference period (years 2004, 2007, 2008 and 2011) is determined by indicators availability at national level. Years 2004 and 2007 characterize a growth period; years 2008 and 2011 characterize a crisis, resp. post-crisis period. Competitiveness measurement have a significant position in most of empirical studies, e.g. (Melecký, 2013; Staníčková & Melecký, 2014). The most common quantitative methods convenient for a high number of multivariate measured variables can be identified as multivariate statistical methods. Multivariate analysis is an ever-expanding set of techniques for data analysis that encompasses a wide range of possible research situation. Factor analysis (FA) is a statistical procedure used to identify a small number of factors that can be used to represent relationship among sets of interrelated variables. In this paper, FA is applied as structure detection method (all indicators are relevant to FA after correlation). Cluster analysis (CA) classifies objects that are very similar to others in the cluster based on a set of selected characteristics-in the case of paper based on competitiveness factorsindicators. The resulting cluster of objects should exhibit high internal (within-cluster) homogeneity and high external (between-cluster) heterogeneity. Because CCI is constructed for ‘inputs’ – driving forces of competitiveness and ‘outputs’ – direct or indirect outcomes of a competitive society and economy, policy and activities; also empirical analysis by FA and CA is calculated separately for ‘inputs’ and ‘outputs’ aspects. For empirical analysis, software IBM SPSS Statistics 22 was used. 3. Results of analysis What is the background of national competitiveness? What are the crucial factors behind competitive differences and gap among countries? Policy makers need a clear sense of its current competitive position and its functioning and latent factors of competitiveness: the starting point. By understanding both its position and factors of competitiveness, the policy makers can better understand the potential development options and limitations for countries and plot a development trajectory towards a desired end state (Martin, 2003).
Michaela Stanickova / Procedia Economics and Finance 23 (2015) 313 – 320
315
3.1. Factors of competitiveness Output factors represent direct or indirect outcomes of a competitive society and economy. In this paper, three dominating factors for outputs explained 74,846 % of total variability in reference period (see Table 1), what can be considered as very satisfactory result. For calculation of output factors by FA is used: Principal Component Analysis as extraction method; Varimax with Kaiser Normalization as rotation method; Rotation was converged in 5 iterations. Table 1 shows 24 number indicators and their belonging to relevant output factors of competitiveness. Table 1. Total variance explained – case of output factors. Rotation Sums of Squared Loadings Total % of Variance Cumulative % 1 8,127 32,509 32,509 2 5,557 22,228 54,738 3 5,027 20,108 74,846 Rotated component matrix – output factors Component Indicators 1 2 3 (EPO) Patent applications to the EPO (1) ,871 (DI) Disposable income (2) ,821 ,305 (HTI) High-tech patent applications to the EPO (1) ,803 Factor 1 (ICT) ICT patent applications to the EPO (1) ,802 Economic (HRSTcore) Human resources in Science and Technology - core sectors (1) ,801 performance (GDP) Gross domestic product (2) ,778 and (HRST) Human resources in Science and Technology (1) ,776 innovative (PEoLMP) Public expenditure on Labour Market Policies (3) ,734 potential (LP) Labour productivity (3) ,726 (BioT) Biotechnology patent applications to the EPO (1) ,683 (FE) Female employment (3) ,578 ,382 (GVA) Gross Value Added (GVA) in sophisticated sectors (4) ,519 (ETKIedu) Employment in technology and knowledge - by education (1) ,982 Factor 2 (EiSS) Employment in sophisticated sectors (2) ,982 Knowledge (ETKIocc) Employment in technology and knowledge - by occupation (1) ,982 based (ETKIgen) Employment in technology and knowledge - by gender (1) ,982 economy (TPAp) Total patent applications (1) ,852 (CoE) Compensation of employees (3) ,843 (UR) Unemployment rate (1) -,966 (MU) Male unemployment (1) -,937 Factor 3 (LtUR) Long-term unemployment in % of active population (1) -,898 Labour (FU) Female unemployment (1) -,890 market (ME) Male employment (1) ,392 ,760 (ER15to64) Employment rate (15 to 64 years) (1) ,578 ,617 Component
Factor 1 – Economic performance and innovative potential is composed of indicators in groups: (1) innovation, (2) Market size, (3) labour market efficiency and (4) business sophistication. Factor 2 – Knowledge based economy is composed of indicators in category: (1) innovation, (2) business sophistication and (3) market size. Factor 3 – Labour market is composed of indicators: (1) labour market efficiency. Based on output factors on competitiveness is clear, that the most economically advanced countries in the world offer excellent conditions for business, longterm focus on supporting research and development. Substantial funding from both public budgets and business budgets, are oriented to promote new ideas and creative approach to economic activities. Domestic companies know that the future belong to prepared companies offering something extra to their customers, i.e. the added value. In the coming years, economic growth belong to countries experiencing "creative" companies. Profitability of large and small companies mainly depends on new ideas and thoughts. Promoting education and learning of residents is very important for the future of countries. Innovative employees determine the success of companies. The driving force are the ideas. The greatest asset of prosperous companies are not material things, but employees who are able to create new values, to respond flexibly on changing market needs and to bring constantly new ideas.
316
Michaela Stanickova / Procedia Economics and Finance 23 (2015) 313 – 320 Table 2. Total variance explained – case of input factors. Initial Eigenvalues Rotation Sums of Squared Loadings % of Cumulative % of Cumulative Total Variance % Variance % 1 11,491 31,057 31,057 10,259 27,728 27,728 … … … … … … … 6 1,694 4,579 68,659 2,240 6,054 68,659 Rotated component matrix – input factors Component Indicators 1 2 3 4 5 6 (VA) Voice and Accountability (1) ,922 (RL) Rule of Law (1) ,917 (CC) Control of Corruption (1) ,915 (GE) Government Effectiveness (1) ,913 (GERD) Gross R&D Expenditure (2) ,873 (LPPE) Labour Productivity per Person Employed (2) ,863 (RQ) Regulatory Quality (1) ,851 (PS) Political Stability (1) ,765 (GFCF) Gross Fixed Capital Formation (2) ,742 -,347 (LIA) Level of Internet Access (3) ,735 -,431 (CDDR) Cancer Disease Death Rate (4) -,696 -,315 ,470 (IMR) Infant Mortality Rate (4) -,695 ,311 (RF) Road Fatalities (4) -,672 ,306 (LLPET) Lifelong Learning - Participation in Education ,645 ,373 and Training (5) (TPETLE) Total Public Exp.at Tertiary Education (5) ,553 ,318 ,521 (VFT) Volume of Freight Transport (6) -,444 -,392 (ISLB) Income, Saving, Net Lending/Net Borrowing (1) ,951 (AU) Accessibility to Universities (2) ,914 (ATP) Air Transport of Passengers (3) ,879 (MTLM) Motorway transport - Length of Motorways (3) ,862 (ATF) Air Transport of Freight (3) ,816 (RTLT) Railway transport - Length of Tracks (3) ,735 (HP) Hospital Beds (1) ,852 (SDR) Suicide Death Rate (1) ,530 ,392 (TPEPLE) Total Public Exp. at Primary of Education (2) -,505 (PTR) Pupils to Teachers Ratio (3) ,399 ,445 (HICP) Harmonised Index of Consumer Prices (1) -,312 -,732 (VPT) Volume of Passenger Transport (2) ,665 (HLE) Healthy Life Expectancy (3) ,511 (ELET) Early Leavers from Education and Training (4) ,509 -,433 (FAS) Financial Aid to Students (4) -,457 ,334 (EA) E-government Availability (5) ,369 ,423 (PEE) Participants in Early Education (1) ,350 -,663 (PHE) Participation in Higher Education (1) -,326 ,627 (MSTEG) Maths, Science and Technology Graduates (1) ,330 ,614 Component
Factor 1 Economic growth and development
Factor 2 Level of infrastructure Factor 3 Health phenomena in human life and cultivation Factor 4 Inflation trends, transport, healthy lifestyle, performance of educational institutions and public administration Factor 5 Participation in education
Total
Factor 6 Expenditure on education (TPESLE) Total Public Exp. at Secondary Education (1) and civilization diseases (HDDR) Heart Disease Death Rate (2)
-,308
,811 -,466
Driven forces of competitiveness are divided into factors that are crucial for EU economies. In this paper, six dominating factors for inputs explained 68,659 % of total variability in reference period (see Table 2), what can be considered as satisfactory result. For calculation of input factors by FA is used: Principal Component Analysis as extraction method; Varimax with Kaiser Normalization as rotation method; Rotation was converged in 8 iterations. Table 2 shows 37 number indicators and their belonging to relevant input factors of competitiveness. EU competitiveness factors are divided into several areas of national economy, which are nowadays key and necessary for economy based on knowledge and innovation. Factor 1 – Economic growth and development is composed of indicators in groups: (1) institutional environment, (2) macroeconomic stability, (3) technological readiness, (4) health, (5) education and (6) infrastructure. Factor 2 – Level of infrastructure is composed of indicators in category: (1) macroeconomic stability, (2) training, (3) infrastructure. Factor 3 – Health phenomena in human life and cultivation is composed by category: (1) health, (2) education and (3) training. Factor 4 – Inflation
Michaela Stanickova / Procedia Economics and Finance 23 (2015) 313 – 320
317
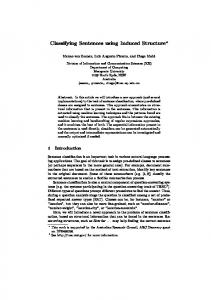
trends, transport, healthy lifestyle, performance of educational institutions and public administration is composed by groups: (1) macroeconomic stability, (2) infrastructure, (3) health, (4) education and (5) technological readiness. Factor 5 – Participation in education is composed of indicators in category: (1) education. Factor 6 – Expenditure on education and civilization diseases is composed by groups: (1) education and (2) health. 3.2. Cluster profile of EU countries Based on results of FA, it is possible to create cluster profile of EU Member States. CA is used for defining country cluster profile based on the value of individual factors. For the final matrix to CA, it was used 6 factors of inputs and 3 factors of outputs that represent the most frequently indicators of competitiveness. In this paper, the best interpretation of data ensures five-cluster solution for inputs across the reference period. The best interpretation of data ensures also five-cluster solution for outputs across the reference period. The number of inputs/outputs clusters has been set, based on previous analysis, thus at 5, as shows Figure 1 – Rescaled Distance Cluster Combine. In the case of inputs factors, i.e. driven forces of competitiveness, Cluster I is created by less mature countries: old EU Member States such as Greece (EL), Portugal (PT), Italy (IT) and Spain (ES); and new EU Member States such as Malta (MT), Latvia (LV), Lithuania (LT), Romania (RO), Slovenia (SI), Slovakia (SK) and Hungary (HU). These countries are characterized with one the lowest level of indicators represent forces driven of competitiveness. The worst results of all countries in the case of internal requirements for competitiveness shows Cluster 3 created by Bulgaria. Cluster 2 represent Estonia (EE), Netherlands (NT), Czech Republic (CZ), Belgium (BE) and Cyprus (CY), thus countries with average level of driven indicators as aspects for competitiveness. Cluster 4 is created by countries such as Germany (DE) and Finland (FI), thus the most economic powerful countries with good conditions and facilities for competitiveness, resp. with best factor endowment. Cluster 5 represent also advanced old EU Member States such as Denmark (DE), Sweden (SE), United Kingdom (UK), Austria (AT), France (FR), Luxembourg (LU) and Ireland (IE) – thus countries with very similar levels of factor endowment as countries in Cluster 4. Then, to Cluster 5 belongs Poland (PL), whose economy facility is very favorable. To very close intent, results of input-profile indicate results of output-profile. Affiliation of most countries within a group factor endowment determines its inclusion within the results of economic activities. In the case of outputs factors of competitiveness, i.e. direct/indirect outcomes of economic activities, Cluster I is represented by IE, ES, PT and BE from old EU countries, but BE is on boundary of belonging to Cluster 3; and CY, MT, CZ, SI, PL, EE, RO from new EU countries. These countries are characterized with lower economic efficiency, especially as a result of crisis. Cluster 2 is created by EL, HU, LV, LT, BG and SK. These countries have the worst economic prosperity and level of performance. LU, FI, AT, IT belong to Cluster 3 – these are countries with satisfactory result in their economic activity, but IT is country on prosperity boundary and belonging to Cluster I. Cluster 4 represent countries such as NL, UK, DK, FR and SE, which are distinguished by the high level of efficiency and performance trend. Last, Cluster 5 is created by DE – by country reflecting stable and good economic results. 4. Conclusion The main aim of this paper was to define the main factors of socioeconomic development that determine competitiveness level of EU countries. Based on empirical analysis is possible to say, that in most of cases, the old EU countries reflect best results in driven forces of competitiveness as assumption for better outcomes of economic activities and functioning of society. The competitiveness of territory resides not only in the competitiveness of its constituent individual entities and their interactions, but also in the wider assets and social, economic, institutional and public attributes of the country itself. The notion of competitiveness is as much about qualitative factors and conditions (e.g. untraded networks of informal knowledge, trust, social capital, etc.) as it is about quantifiable attributes and processes (e.g. inter-firm trading, patenting rates, labour supply, etc.). The causes of competitiveness are usually attributed to the effects of an aggregate of factors rather than the impact of any individual factor. The sources of competitiveness may also originate at a variety of geographical scales, from the local, through regional, to national and even international (Martin, 2003). The emergence of new perspectives in creating competitive advantages at national level clearly emphasizes the role of local factors and initiative in the general economic
318
Michaela Stanickova / Procedia Economics and Finance 23 (2015) 313 – 320
development of a country. This has major implications for the empirical analysis of regional competitiveness for further research.
(a)
Michaela Stanickova / Procedia Economics and Finance 23 (2015) 313 – 320
(b) Fig. 1. Dendogram using Ward linkage – Clusters of EU Member States (a) input factors; (b) output factors
319
320
Michaela Stanickova / Procedia Economics and Finance 23 (2015) 313 – 320
Acknowledgements This paper was created under SGS project (SP2014/111) of Faculty of Economics, VŠB-Technical University of Ostrava and Operational Programme Education for Competitiveness – Project CZ.1.07/2.3.00/20.0296. References Annoni A & Kozovska K.(2010). EU Regional Competitiveness Index 2010. Luxembourg: Publication Office of the European Union; 2010. Esser K., Hillebrand,W, Messner D & Meyer-Stamer J. (1995). Systemic Competitiveness. New Governance Patterns for Industrial Development. London: Frank Cass; 1995. Gardiner B, Martin R & Tyler P. (2004). Competitiveness, Productivity and Economic Growth across the European Regions. Retrieved from http://www-sre.wu-wien.ac.at/ersa/ersaconfs/ersa04/PDF/333.pdf; 2004. Study on the Factors of Regional Competitiveness. Retrieved from Martin R. (2003). A http://ec.europa.eu/regional_policy/sources/docgener/studies/pdf/3cr/competitiveness.pdf; 2003. Melecký L.(2013). Comparing of EU15 and EU12 Countries Efficiency by Application of DEA Approach. In H. Vojáčková (ed.), International Conference Mathematical Methods in Economics 2013. Part II (pp. 618-623). Jihlava: The College of Polytechnics Jihlava; 2013. Staníčková M & Melecký L. (2014). Factors Determining Driving Forces of Competitiveness in EU Countries. In International Conference Hradec Economic Days 2014 (pp. 338-348). Hradec Králové: University of Hradec Králové; 2014.