Logistic regression analysis can also be used in text mining ... measures of predictive accuracy. ..... presented at Predictive Analytics World, Oct. 2011.
(IJACSA) International Journal of Advanced Computer Science and Applications, Vol. 6, No. 10, 2015
Classifying three Communities of Assam Based on Anthropometric Characteristics using R Programming Sadiq Hussain
Runjun Patir
Prof. Jiten Hazarika
System Administrator Examination Branch Dibrugarh University
Department of Anthropology Dibrugarh University Dibrugarh
Department of Statistics Dibrugarh University Dibrugarh
Dali Dutta
Prof. Sarthak Sengupta
Prof. G.C. Hazarika
Department of Anthropology Dibrugarh University Dibrugarh
Department of Anthropology Dibrugarh University Dibrugarh
Department of Mathematics Dibrugarh University Dibrugarh
Abstract—The study of anthropometric characteristics of different communities plays an important role in design, ergonomics and architecture. As the change of life style, nutrition and ethnic composition of different communities leads to obesity epidemic etc. The authors performed two experiments. In the first experiment, the authors tried to classify three communities of Assam, India based on anthropometric characteristics using R Programming. The authors mined out the statistically significant anthropometric characteristics among the Chutia, Mising and Deori communities of Assam. In the second experiment, the authors performed the Cochran Mantel Haenszel test to find out the association between the communities and BMI based nutritional status stratified by the age of the people studied. Keywords—Data Mining; Classification; R Programming; Logistic Regression; Cochran Mantel Haenszel Test
I.
INTRODUCTION
The measurement of human individual termed as anthropometry plays a crucial role in designs and architecture where the statistical data about the anthropometric characteristics are used to optimize products. The need of regular updating of anthropometric characteristics increases because of the changes in life style, nutrition etc. among different communities lead to changes in distribution in body dimensions. Physical Anthropology is mostly concerned with the taxonomic classification of human population at both micro and macro level to understand the process of human evolution in space and time. As such it deals with the phylogenetic position of human populations in terms of their differences and similarities mainly in respect of morphological and anthropometric characters. One of the natural assets of peoples belonging to different population groups is their body build or physique. This can be measured and varied. The difference or dissimilarities between generations within a population or between population within a major ethnic groups in respect of anthropometric and genetic traits are considered as the ongoing process of human evolution and is subject to a number of evolutionary forces which act differently in different population.
This work attempts to classify three communities –Chutiya, Deori and Mising of Assam based on anthropometric characteristics. The Chutiya, one of the numerically dominant Other Backward Communities (OBC) of Assam, form one of the old populations of Assam. The Chutiyas are confined to Dibrugarh, Sibsagar, Jorhat, Golaghat, Lakhimpur and Dhemaji districts of Assam. These districts are called upper Assam districts. The Chutiyas had their own kingdom in upper Assam region. The Ahom, a Tai Mongoloid population came to Assam in the 13th Century and the Chutiyas tried to resist their aggression. In the long run, the Ahom overrun the Chutiya kingdom. Linguistically, the Chutiyas belong to Tibeto-Burman family. However, they accepted Assamese Language and they are Indo Mongoloid. The Chutiyas may be subdivided into several groups like Hindu-Chutiya, AhomChutiya, Deori-Chutiya, Borahi-Chutiya etc. The Chutiyas are by religion Hindu. The Deori were traditionally engaged in priestly activities of the Chutiyas. They were one of the major sub-divisions of the Chutiya [3]. The word Deori means in-charge of a temple or the priest. Nowadays, they however like to identify themselves as ‘Gimasaya’,meaning ‘the children of the Sun and Moon’.The Deori are the Tibeto-Mongoloid tribal groups of Assam. They are recognized as one of the plain scheduled tribes of Assam. According to 2001 Census, the total population of Deori is 41,161 in Assam. The original habitat of the Deori was in the Lohit district of Arunachal Pradesh. They migrated to Brahmaputra valley, Assam to escape from frequent troubles created by the Mishmis and the Adis. The Mising are another Indo-Mongoloid Schedule Tribe of Assam. The Mising is synonymous with Miri, which means mediator, intermediary, interpreter.[3]. According to Census of 2001, the population of Mising is estimated at 5,87,310. The Misings were inhabitants of the hilly ranges that lie between the Subansiri and the Siyang districts of Arunachal Pradesh. They migrated down to the plains of Assam from an area upstream of the Dihong river in search of better economic life before the advent of the Ahom rules in Assam. Since then the Misings have been living mostly along banks of Brahmaputra
64 | P a g e www.ijacsa.thesai.org
(IJACSA) International Journal of Advanced Computer Science and Applications, Vol. 6, No. 10, 2015
River and its tributaries. The Mising still speak their own dialect, which is akin to that of Adis of Arunachal Pradesh and possess their traditional ways of living. Originally, they were worshiper of Donyi (Sun) and Polo (Moon), but at present some of them are followers of Mahapurushia Vaishnav Dharma propounded by Srimanta Sankardeva during 15th and 16th centuries A.D. In the present study, the authors made an attempt to understand the phylogenetic position of the populations under investigation. All the populations considered represent numerically small endogamous Mendelian population. In the present day context, however, due to globalization there are possibilities of bio-cultural disintegration in these populations due to increasing contact with relatively advanced neighbouring peoples.The authors analyzed anthropometric characteristics of above three communities viz. Chutia, Mising, and Deori of Assam and tried to classify them using the Logistic Regression Model. The Mantel-Haenszel odds ratio was also calculated to find out the association between the communities and BMI based nutritional status stratified by the age of the people studied. II.
LITERATURE REVIEW
In this section, some of the important literatures related to present study particularly related to methodological aspects, are briefly discussed. Cancer classification and prediction is an important research area and it is one of the most important applications of DNA microarray due to its potentials in cancer diagnostic. The logistic regression model is used successfully for cancer classification and prediction. [14] Logistic regression analysis can also be used in text mining poses computational and statistical challenges. Genkin et. al. [4] used Bayesian logistic regression approach that uses a Laplace prior to avoid over fitting and produces sparse predictive models for text data. They used it for document classification problems. Using microarray data, Logistic regression may also be used for disease classification. Liao et. al. [3] proposed a parametric bootstrap model for more accurate estimation of the prediction error that is tailored to the microarray data by borrowing from the extensive research in identifying differentially expressed genes. A comparative study between the linear discriminant analysis and logistic regression may also be found in [10]. They consider the problem of choosing between the two methods, and set some guidelines for proper choice. The comparison between the methods was based on several measures of predictive accuracy. The performance of the methods was studied by simulations. Another comparison of discriminant analysis and logistic regression were made in [9] using two data sets from a study on predictors of coliform mastitis in dairy cows. Both techniques selected the same set of variables as important predictors and were of nearly equal value in classifying cows as having, or not having mastitis. The logistic regression model
made fewer classification errors. The magnitudes of the effects were considerably different for some variables. Logistic regression may also be used for classification of community based on Anthropometric predictors. In [12], it was aimed to examine the associations of anthropometric indices with gestational hypertensive disorders (GHD), and to determine the index that can best predict the risk of this condition occurring during pregnancy among Australian aboriginal women. The associations of the baseline anthropometric measurements with GHD were assessed using conditional logistic regression. Kitamura et al. [6] used Hierarchical logistic regression to find out association between delayed bedtime and sleep-related problems among community dwelling 2-year-old children in Japan. It was carried out with the incidence of each sleeprelated problem (present two or more times per week) as the dependent variable and bed time as the independent variables in model. Cephalic Index (CI) is used in classifying the racial and gender differences. Lobo et al. [8] used CI for classifying Gurung Community of Nepal based on anthropometric indices. III.
ANTHROPOMETRIC CHARACTERISTICS
There are various anthropometric characteristics based on which different communities can be classified. In this section, the anthropometric characteristics considered in our present study are briefly discussed. Weight: It is taken by means of standard portable calibrated spring weighing machine. The individual is asked to stand at the centre of weighing machine with minimal clothing, looking straight and breathing normally. Body weight of each subject measured to the nearest 0.1 kg on the weighing machine with minimum cloths adjustment. The weighing machine is checked from time to time with a known standard weight. No deduction is made for the weight of light apparel while taking the final reading. Stature: It measures the vertical distance between the floor and the vertex. While taking the stature, the subject is asked to remove shoes and stand erect against a wall with the heels, buttocks and shoulders and back of the head touching the wall and the head resting on the Frankfurt Horizontal Plane. The anthropometer is placed at the back and between the heels of the subject, taking care that it is kept vertical. The sliding sleeve of the anthropometer is then lowered down towards the middle of the head so that it could touch the vertex. Reading in centimeter and its fraction were recorded. Blood pressure: Blood pressure or arterial blood pressure is the pressure exerted by circulating blood upon the walls of the blood vessels. During each heart-beat, blood pressure varies between a maximum (systolic) and a minimum (diastolic) pressure.
A person’s blood pressure is usually expressed in terms of the systolic pressure over diastolic pressure and is measured millimeters of mercury (mmHg). The subjects were classified following the American Medical Association [1].
65 | P a g e www.ijacsa.thesai.org
(IJACSA) International Journal of Advanced Computer Science and Applications, Vol. 6, No. 10, 2015 TABLE I.
CLASSIFICATION OF BLOOD PRESSURE
NORMOTENSIVE (mmHg) PRE-HYPERTENSIVE (mmHg) HYPERTENSIVE (mmHg)
SBP < 120 and DBP < 80 SBP 120 – 139 ; DBP 80 – 89 SBP > 140 ; DBP > 90 - 99
circumference is taken while the subject sits on a table with the legs hanging freely or the subject stands with the feet separated about 20 cm and body weight distributed equally on both feet. This measurement is taken on supine position or with the knee flexed at 90 degree in case of children.
Sitting height: It measures the vertical distance from the vertex to the sitting surface of the subject. The subject is made to sit on a stool with his/her vertical column as straight as possible, legs hanging freely and head on the Frankfurt Horizontal Plane. The anthropometer is placed at the back and between the two buttocks, taking care that the lumber curve of the subject is not flattened, but concave from behind. The sliding sleeve of the anthropometer is then lowered down towards the middle of the head so that it would touch the vertex. Reading in centimeter and its fraction were recorded.
Skin fold thickness at biceps: It measures the thickness of a vertical fold on the front of the upper left arm, directly above the centre of the cubital fossa, at the same level marked on the skin for the upper arm circumference. The Holtain skin fold caliper is held in the right hand. A vertical fold of skin and subcutaneous tissue is picked up gently with the left thumb and index finger, approximately 1.0 cm proximal to the arced level, and the tips of the calipers are applied perpendicular to the skin fold at the marked level. Measurements are recorded to the nearest 0.2 mm.
Bi-acromial diameter: It measures the straight distance between the two acromia in standing position. The measurement is taken from the back of the subject with the Pelvimeter. The subject is asked to keep his/her shoulders straight. If the hand is given to move downward and upward then we find a point where humerus and scapula is joined. The distance between these two points is known as bi- acromial diameter.
Skin fold thickness at triceps: The triceps skin fold is measured in the mid line of the posterior aspect of the arm, over the triceps muscle, at a level of mid way between the lateral projection of the acromion process at the shoulder and the olecranon process of the ulna. The midpoint is determined as done in mid upper arm circumference.
Bi-iliac diameter: It measures the straight distance between the two illo-cristalia. (the most lateral points on the iliac crests). The measurement is taken from the back of the subject with the Pelvimeter. While taking bi-iliac diameter, the subject is asked to stand in natural position.
It measures the maximum circumference of the head taken in one horizontal plane, that is, from glabella to opisthocranion to glabella. This measurement was taken with a tape (precision – 1mm). Head
circumference:
Mid upper arm circumference: For measurement of mid upper arm circumference, the subject stand erect, with the arms hanging freely at the sides of the trunk and palms towards the thighs. The midpoint between the lateral tip of acromian and most distal point on the olecranon process of the ulna is located and marked. At the marked point, the tape (flexible and nonelastic) is snug to the skin but not compressing soft tissues, the circumference is recorded to the nearest 0.1 cm. Waist circumference: It measures the circumference of the
abdomen at the most lateral contour of the body between the lower margin of ribs and the superior anterior illiac spine. The subject is asked to stand erect and to keep his/her feet close to each other. The measurement is taken with a tape (flexible and non- elastic) at the right angle to the axis of the body when the subject exhaled normally. Hip circumference: It measures the circumference of the hips at their widest position over the greater trochanters. The subject is asked to keep his/her feet close to each other and stand erect. The measurement is taken with a tape (flexible and non- elastic) at the right angle to the axis of the body when the subject exhaled normally. Calf circumference: It measures the circumference of the
calf muscles where it is most developed. The measurement is taken on a plane perpendicular to the long axis of the calf. Calf
Skin fold thickness at sub-scapula: For the measurement of sub-scapula skin fold, the subject stands erect with the upper extremities relaxed. It measures the back beneath the inferior angle of the left scapula with the fold either in a vertical line or slightly inclined downward and laterally in the natural cleavage line of the skin. Skin fold thickness at supra iliac: When the subject stands in an erect posture, this measurement is taken in the mid axillary line immediately superior to the iliac crest. The skin fold is picked up approximately 1 cm above and 2 cm medial to the anterior superior iliac spine. Skin fold thickness at calf: It measures the skin fold at the level of maximum calf circumference parallel to the long axis of the calf on its medial aspect. The subject is asked to sit with the knee flexed on the side, which is to be measured, and sole of the corresponding foot on the floor. The skin fold is picked up vertically at the level of the maximum calf circumference, which is marked. Width of humerus: For this measurement, the subject’s elbow is bent to the right angle and the width across the outermost points of the lower end of the humerus is taken. Width of femur: For this measurement, the subject sits on a table with knees bent to the right angle and the width across the outer most parts of the lower end of the femur is measured. Age: The age of the subject is categorized as given below: TABLE II. Age1 Age2 Age3 Age4
CLASSIFICATION OF AGE 19-28 years 29-38 years 39-48 years 49-58 years
Body mass index: Body mass index is calculated as body weight in kilogram divided by height in meters squired. It is an indicator of overall obesity. The cut off points recommended for Asia Pacific region [13] was followed:
66 | P a g e www.ijacsa.thesai.org
(IJACSA) International Journal of Advanced Computer Science and Applications, Vol. 6, No. 10, 2015 TABLE III.
CLASSIFICATION OF BMI BASED ON ASIA PACIFIC REGION
CED ( Chronic Energy Deficiency) Grade III CED Grade II CED Grade I NORMAL OVERWEIGHT OBESE
IV.
BMI < 16.0 BMI 16.0 – 16.9 BMI 17.0 – 18.4 BMI 18.5 - 22.99 BMI 23.0 - 24.99 BMI > 25.0
it was also a reference to the most widely used coding language at the time, S. R has a command line interface and the user writes the commands and expects R to execute it. Recent Studies and polls also proves that the popularity of R increased substantially. [2][5][11].
METHODOLOGY
Linear discriminant analysis (LDA) and Logistic Regression (LR) are widely used multivariate statistical methods for classification of data having categorical outcome variables. Both of them are appropriate for the development of linear classification models. However, the two methods differ in their basic idea while Logistic Regression (LR) makes no assumptions on the distribution of the explanatory variables, Linear discriminant analysis (LDA) has been developed for normally distributed explanatory variables. Moreover, if any one of the explanatory variables is categorical in nature, no question of checking normality arises. Keeping these points in mind, Logistic Regression (LR) has been used to classify the three communities of Assam based on the information provided by explanatory variables. For the binary valued output the form the regression model is
Where Pi = Probability of a person i belonging to Mising / Deori Community (C=1) 1-Pi = Probability of a person i belonging to Chutia Community (C=0) X is the matrix of the explanatory variables, β is the parameter vector to be stimated. In our present study, two logistic regression models have been fitted separately—one to discriminate between Deori and Chutia and the other to discriminate between Mising and Chutia. The popular and efficient method of estimating the logistic regression model is the maximum likelihood method. Nowadays, using statistical software packages like SPSS, SAS etc. one can estimates the parameters of this model. However, to use the above software data should be as per the particular software requirements. As the R Programming is command driven statistical package, the package may be utilized as per the requirement of the user. R programming is a freeware which is object oriented in nature and similar to S-Plus. It has excellent graphical capabilities and supported by large user networks. It has large number of contributed packages which may be downloaded as and when needed. It is basically used for statistical computations. R is also used by the data miners for data analysis. R may be interfaced with C/C++ and Python for increased speed or functionality. In the 1990s, Ross Ihaka and Robert Gentleman, statisticians at the University of Auckland in New Zealand, had developed the R Programming Language to perform data analysis. R got its name from its developers’ initials, although
R Studio is an Integrated Development Environment for R Programming Language. It is an open source and free. R Studio is available in two editions: R Studio Server and R Studio Desktop. R Studio Desktop is a desktop application and runs locally. R Studio Desktop is available for Linux, Mac OS X and Windows. R Studio Server runs on Linux and it can be accessed through browser remotely. R Studio uses Qt for its GUI and is written in C++ Language. Considering all the above points in mind, the R Programming is used to fit the proposed model. For analysis of stratified categorical data, the Cochran Mantel Haenszel test is used. The test allows the comparison of two groups on a categorical response. When there are three nominal variables, out of them the two variables are of 2x2 contingency table format and the third variable that identifies the repeats. V.
EXPERIMENTS
The two experiments were carried out by using R programming. In the first experiment logistic regression was carried out to find the significance among the anthropometric characteristics of the 3 communities of Assam, India. First, the authors considered the Deori and Chutia communities of Assam. The output of the logistic regression is as follows: Deviance Residuals: Min 1Q Median 3Q Max -2.7121 -0.3556 0.2390 0.5857 2.6311
Coefficients: TABLE IV.
LR RESULTS OF DEORI VERSUS CHUTIA COMMUNITY
(Intercept)
Estimate -3.177670
Std. Error 5.660881
z value -0.561
Pr(>|z|) 0.574567
Age2
-0.367419
0.296367
-1.240
0.215071
Age3
-0.233198
0.313183
-0.745
0.456511
Age4
0.010300
0.420320
0.025
0.980451
Weight
-0.132007
0.039232
-3.365
0.000766 ***
Systolic.BP
0.100352
0.013087
7.668
1.75e-14 ***
Diastolic.BP
0.062551
0.017580
3.558
0.000374 ***
Height
0.122208
0.027227
4.488
7.17e-06 ***
Sit.height
0.073310
0.030248
2.424
0.015368 *
Biacromial diameter
-0.179647
0.048948
-3.67
0 0.000242 ***
Biiliac diameter
-0.020336
0.040413
-0.503
0.614824
Head.cir
-0.304476
0.083361
-3.652
0.000260 ***
MUAC
0.372274
0.089043
4.181
2.90e-05
67 | P a g e www.ijacsa.thesai.org
(IJACSA) International Journal of Advanced Computer Science and Applications, Vol. 6, No. 10, 2015 *** Waist.cir
-0.122558
0.021081
-5.814
6.11e-09 ***
Calf.cir
0.291251
0.068478
4.253
2.11e-05 ***
Skin.calf
-0.057455
0.039546
-1.453
0.146260
Biceps skinfold
0.199083
0.074960
2.656
0.007911 **
Triceps skinfold
-0.181985
0.057537
-3.163
0.001562 **
Subscapula skinfold
0.218092
0.044720
4.877
1.08e-06 ***
Suprailiac skinfold
0.046265
0.040022
1.156
0.247681
Wdth.humerus
-1.392893
0.229518
-6.069
1.29e-09 ***
Wdth.Femur
-0.009992
0.152274
-0.066
0.947681
Triceps skinfold
0.035895
0.041581
0.863
0.387988
Subscapula skinfold
0.082051
0.027760
2.956
0.003120 **
Suprailiac skinfold
-0.082798
0.026020
-3.182
0.001462 **
Wdth.humerus
-1.102172
0.166099
-6.636
3.23e-11 ***
Wdth.Femur
1.411180
0.117651
11.995
< 2e-16 ***
Signif. codes: 0 ‘***’ 0.001 ‘**’ 0.01 ‘*’ 0.05 ‘.’ 0.1 ‘ ’ 1
Signif. codes: 0 ‘***’ 0.001 ‘**’ 0.01 ‘*’ 0.05 ‘.’ 0.1 ‘ ’ 1 (Dispersion parameter for binomial family taken to be 1) The output of the logistic regression when considered the Mising and Chutia communities of Assam. Deviance Residuals: Min 1Q Median 3Q Max -2.9707 -0.7791 0.3423 0.7810 3.5389 Coefficients: TABLE V.
LR RESULTS OF MISING VERSUS CHUTIA COMMUNITY Estimate
Std. Error
z value
Pr(>|z|)
(Intercept)
6.338003
4.295615
1.475
0.140089
Age2
-0.099680
0.206643
-0.482
0.629538
Age3
0.339182
0.229022
1.481
0.138606
Age4
0.575389
0.298972
1.925
0.540285
Weight
-0.008793
0.032861
-0.268
0.789016
Systolic.BP
0.009234
0.007021
1.315
0.188434
Diastolic.BP
-0.011556
0.012501
-0.924
0.355293
Height
0.058925
0.021815
2.701
0.006910 **
Sit.height
-0.084252
0.031854
-2.645
0.008170 **
Biacromial diameter
-0.031969
0.030291
-1.055
0.291235
Biiliac diameter
-0.003929
0.029722
-0.132
0.894840
Head.cir
-0.304744
0.061485
-4.956
7.18e-07 ***
MUAC
-0.104435
0.064561
-1.618
0.105745
Waist.cir
0.004070
0.015706
0.259
0.795539
Calf.cir
0.263649
0.053297
4.947
7.55e-07 ***
Skin.calf
-0.093570
0.024172
-3.871
0.000108 ***
Biceps skinfold
0.044137
0.040627
1.086
0.277300
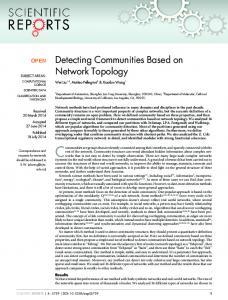
Fig. 1. ROC Curve of Anthropometric Characteristics among Deori and Chutia Community And Mising and Chutia Community respectively
The receiver operating characteristic (ROC) curve is used to measure the performance of classification.The area under the curve as shown figure 1 is 0.9007 for the Deori versus the Chutia communities of Assam. The area under the curve is 0.8409 for the Mising versus the Chutia Communities of Assam. The second experiment is Cochran-Mantel-Haenszel test. The overweight and obese are considered based on the BMI of the persons. The BMI with the normal range are termed as normal in the following matrix. The row may read as there are 36 persons from Mising communities who are overweight and obese and 113 are in normal category according to the BMI chart as described above. The following is the matrix for the persons whose age is less than or equal to 40.
68 | P a g e www.ijacsa.thesai.org
(IJACSA) International Journal of Advanced Computer Science and Applications, Vol. 6, No. 10, 2015 TABLE VI.
MATRIX 1 FOR THE PERSONS OF COMMUNITIESWITH AGE 40 Overweight & Obese
Normal
Mising Deori
39
187
33
81
Chutia
85
148
The result of the Cochran-Mantel-Haenszel test is as follows:CMH statistic = 214.4800, df = 1.0000, p-value = 0.0000, MH Estimate = 2.4808, Pooled Odd Ratio = 2.4975, Odd Ratio of level 1 = 2.3379, Odd Ratio of level 2 = 2.6000 It is observed that the odds ratio for the first stratum (age below or equal to 40) is 2.3379, the odds ratio for the second stratum (age above 40) is 2.3379, and the aggregate odds ratio that we would get if we pooled the data for both the group is 2.4975. The Mantel-Haenszel odds ratio is estimated to be 2.4808. VI.
shown in Table V. The area under the curve for the ROC curve among the communities of Assam also proved it to be good classifiers. Although the Deori were considered as the priestly section and one of the major sub-division of the Chutiyas [3] but the present study reveals marked difference between them. In this regard, the influence of physical environment factors on the present quantitative traits may not be so significant because these populations are by and large living in a similar ecological condition in upper Assam. Therefore, the difference may be owing to the absence of relatively less gene flow due to strict endogamy as the Deori are well known for their religiosity In the second experiment, the authors used CochranMantel-Haenszel test to study the association between communities and nutritional status (obese and overweight and normal) stratified by the age. The finding reveals that there is association between them. [1]
[2] [3] [4]
[5] [6]
DISCUSSION
For classifying the Deori and Chutia communities of Assam, the statistically significant anthropometric characteristics are found to be weight, blood pressure, height, sitting height, bi-acromial diameter, head circumference, mid upper arm circumference, waist circumference, calf circumference, skin fold thickness at biceps, skin fold thickness at triceps, skin fold thickness at sub-scapula and width of humerus. The Table IV reveals that most of the explanatory variables considered in our study can be taken as determinants to discriminate between Chutia and Deori community. It is observed that out of 21 explanatory variables, 14 variables can be used to classify whether a particular person is belonging to Chutia or Deori community. As an illustration, if we consider the parameter weight, it is observed that on average the weight of a Deori community is different from Chutia community. For classifying the Mising and Chutia communities of Assam, the statistically significant anthropometric characteristics are found to be height, sit height, head circumference, calf circumference, skin fold thickness at calf, skin fold thickness at sub-scapula, skin fold thickness at supra iliac, width of humerus and width of femur. Similarly, using logistic regression analysis, to classify between Mising and Chutia Community, out of 21 explanatory variables, 9 variables found to be significant as
[7]
[8]
[9]
[10]
[11] [12]
[13]
[14]
REFERENCES Chobanian, A.V.; Bakris, GL; Black, HR; Cushman, WC; Green, LA; and Izzo, JL (Jr)., The Seventh Report of the Joint National Committee on Prevention, Detection, Evaluation and Treatment of High Blood Pressure: The JNC-VII Report, Journal of American Medical Association, 282, 19:2560-2572, 2003. David Smith, R Tops Data Mining Software Poll, Java Developers Journal, May 31, 2012. Gait, E. A., A History of Assam. Calcutta: Thacker, Spink & Co. , 1905. Genkin Alexander, Lewis David D. and Madigan David, Large-Scale Bayesian Logistic Regression for Text Categorization, Technometrics, August 2007, Vol. 49, No. 3. Karl Rexer, Heather Allen, and Paul Gearan, Data Miner Survey Summary, presented at Predictive Analytics World, Oct. 2011. Kitamura Shingo , Enomoto Minori , Kamei Yuichi , Inada Naoko , Moriwaki Aiko , Kamio Yoko and Mishima Kazuo, Association between delayed bedtime and sleep-related problems among community dwelling 2year-old children in Japan, Journal of Physiological Anthropology (2015) 34:12 Liao J.G. and Chin Khew-Voon, Logistic regression for disease classification using microarray data: model selection in a large p and small n case, BIOINFORMATICS, Vol. 23 no. 15 2007, pages 1945–1951 Lobo SW , Chandrashekhar TS and Kumar S, Cephalic index of Gurung community of Nepal - An anthropometric study, Kathmandu University Medical Journal (2005) Vol. 3, No. 3, Issue 11, 263-265. Montgomery M E, White M E, and Martin S W, A comparison of discriminant analysis and logistic regression for the prediction of coliform mastitis in dairy cows, Can J Vet Res. 1987 Oct; 51(4): 495–498 Pohar Maja , Blas Mateja , and Turk Sandra, Comparison of Logistic Regression and Linear Discriminant Analysis: A Simulation Study, Metodološki zvezki, Vol. 1, No. 1, 2004, 143-161. Robert A. Muenchen ,"The Popularity of Data Analysis Software", 2012 Sina Maryam , Hoy Wendy and Wang Zhiqiang, Anthropometric predictors of gestational hypertensive disorders in a remote aboriginal community: a nested case–control study, BMC Research Notes 2014, 7:122. World Health Organization, Health Situation in South East Asia Region.1998-2000, WHO Regional Office for South East Asia, New York, 2002. Zhou Xiaobo , Liu Kuang-Yu and Wong Stephen T.C. , Cancer classification and prediction using logistic regression with Bayesian gene selection, Journal of Biomedical Informatics, Volume 37, Issue 4, August 2004, Pages 249– 259.
69 | P a g e www.ijacsa.thesai.org