691545
research-article2017
SMSXXX10.1177/2056305117691545Social Media + SocietyHimelboim et al.
Article
Classifying Twitter Topic-Networks Using Social Network Analysis
Social Media + Society January-March 2017: 1–13 © The Author(s) 2017 Reprints and permissions: sagepub.co.uk/journalsPermissions.nav https://doi.org/10.1177/2056305117691545 DOI: 10.1177/2056305117691545 journals.sagepub.com/home/sms
Itai Himelboim1, Marc A. Smith2, Lee Rainie3, Ben Shneiderman4, and Camila Espina1
Abstract As users interact via social media spaces, like Twitter, they form connections that emerge into complex social network structures. These connections are indicators of content sharing, and network structures reflect patterns of information flow. This article proposes a conceptual and practical model for the classification of topical Twitter networks, based on their network-level structures. As current literature focuses on the classification of users to key positions, this study utilizes the overall network structures in order to classify Twitter conversation based on their patterns of information flow. Four network-level metrics, which have established as indicators of information flow characteristics—density, modularity, centralization, and the fraction of isolated users—are utilized in a three-step classification model. This process led us to suggest six structures of information flow: divided, unified, fragmented, clustered, in and out hub-and-spoke networks. We demonstrate the value of these network structures by segmenting 60 Twitter topical social media network datasets into these six distinct patterns of collective connections, illustrating how different topics of conversations exhibit different patterns of information flow. We discuss conceptual and practical implications for each structure. Keywords Twitter, social media, information flow, social network analytics, network structure Engaging with social media, individuals define the channels and the boundaries of information flow. Following, friending, subscribing, sharing, and retweeting are just a few types of practices of engagement with users and content that determine how information flows in social media spaces. Using social media, any individual can subscribe to a wide range of information sources, traditional and others, and can potentially become a source of information for many others. Alternatively, users can also use these social spaces to recreate and reinforce traditional-hierarchical structures by continuing to rely on just a few information sources or by choosing to limit interactions to a select group of similar others. Patterns of connections among users within social media take the form of social networks. The structure of a network is an indicator of its unique patterns of information flow. Current literature often classifies users for understanding information flow. Measurements of centrality, degree, and betweenness have been widely used to capture patterns of information flow in a network (e.g., Borgatti, 2005; Burt, 2005; Freeman, 1979). Ties have also been classified based on their strength, in order to explain the type of information flow—novel or redundant—among users in a network (e.g., Granovetter, 1973). Such approaches, while valuable, capture only the role that individuals play in shaping information
flow in only parts of the network. Network classification at the network level, in contrast, can provide insights for information flow as a whole. Scholars illustrated the value of single network-level measurements, such as density (Carley, 1991; Lerman & Ghosh, 2010) and centralization (Freeman, 1979; Woo-young & Park, 2012), as indicators of information flow. However, the structure of a network encompasses several measurements, which only together can provide a sound understanding of information flow among users in that network. This study proposes a three-step classification of Twitter topic-network, utilizing four social network concepts and their subsequent measurements of connectivity patterns. Density, modularity, and isolates are used to characterize levels of 1
University of Georgia, USA Connected Action Consulting Group, USA 3 Pew Research Center, USA 4 University of Maryland, USA 2
Corresponding Author: Itai Himelboim, Department of Advertising and Public Relations, Grady College of Journalism and Mass Communication, University of Georgia, Athens, GA 30602-3018, USA. Email:
[email protected]
Creative Commons Non Commercial CC-BY-NC: This article is distributed under the terms of the Creative Commons AttributionNonCommercial 3.0 License (http://www.creativecommons.org/licenses/by-nc/3.0/) which permits non-commercial use, reproduction and distribution of the work without further permission provided the original work is attributed as specified on the SAGE and Open Access pages (https://us.sagepub.com/en-us/nam/open-access-at-sage).
2 interconnectedness of users and clusters. Centralization, the degree to which connections are aggregated around just a few actors in the network, is used to depict networks based on the hierarchy of information flow. This classification results in six types of Twitter social media network structures, which are labeled as Polarized Crowds (divided), In-Group (unified), Brand (fragmented), Communities (clustered), Broadcast, and Support (inward and outward hub-and-spoke). For each structure, we discuss the implications of its structure—a unique combination of network measurements—in terms of information flow. We applied the proposed classification steps to 60 Twitter topic-networks, selected from a web repository for social media network data, the NodeXL Graph Gallery,1 capturing activity of 64,445 users, who created 433,937 ties. Each social media network captured interactions among Twitter users talking about a topic, resulting in a set of a wide range of topical conversations, including politics, health, professional organizations, brands, consumer goods, and media figures. A set of measurements were calculated for each dataset, resulting in a classification of social media networks into these distinct types.
Social Networks—Common Structures A social network structure is created when connections (“links,” “ties,” or “edges”) are created among social actors (“nodes” or “vertices”), such as individuals and organizations (Wasserman & Faust, 1994). Social media platforms allow users to form ties or connections among themselves in the process of sharing images, texts, videos, and other digital artifacts. Research on social media from a social network perspective shifts the focus from individual traits to relational ties between social entities (for a discussion on a variety of Twitter-specific metrics, see Bruns & Stieglitz, 2013). Collections of these ties or connections aggregate into emergent patterns or network motifs. On social networking sites, users form networks by interacting with other users when they connect or share information with them. On Twitter, social networks are composed of users and the connections they form with other users when they mention and reply to one another (Hansen, Shneiderman, & Smith, 2011). Network research has consistently found that given the opportunity to interact freely, individuals and other social actors tend to form subgroups of connected individuals who are more interconnected with one another than with other less connected people in their social network (Watts, 1999). A key characteristic of self-organized networks—where nodes are free to create and delete connections—is that they share a common “small world” structure. The social network research literature on small world theory is based on several experiments first conducted by Milgram (1967). Milgram found that regardless of the size of a social network, human society is composed of small clusters of tightly interconnected individuals, which resulted in a short average path length between any two people. Granovetter (1973) noted
Social Media + Society that paths of strong ties tended to close into triangles, creating clusters of highly connected groups, whereas weak ties are less likely to follow such tendency and often connect different clusters. These patterns of interactions allow the formation of shorter connections in a network of otherwise long paths. Watts (1999) found that the reason for the short path length—short global separation—in many large networks is related to high local clustering or subgroups (e.g., churches, Rotary Clubs, or neighborhood watch groups). One of the core findings was that “small world networks” are characterized by a high density of local clusters of individuals in otherwise large and sparse networks. These clusters are interconnected by relatively few ties, which weave the larger network into a more densely connected form. The small world network structure was found in a wide range of scalefree networks, including the power grid of the Western United States, collaborations among film actors, metabolism, sexual contacts, acquaintances “offline,” and connections on Myspace (Browne, Li, Chong, & Littman, 2005; Fell & Wagner, 2000; Moore & Newman, 2000; Offenhuber & Richards, 2007). The short length of connections among individuals within a network—sometimes known as the “six degrees of separation”—is no doubt the most famous conclusion of this body of research. Examining Twitter networks, however, this study begins with questions that have remained open: What are the range of network structures that naturally form in social media networks? What are the defining structural characteristics of these network shapes? What network metrics can be used to effectively categorize social media networks into useful types?
Interconnectedness and Information Flow: Density, Clusters, Modularity, and Isolates The extent to which users are interconnected and the patterns of these connections reflect the intensity and boundaries of information flow. Among tightly interconnected individuals, information is more likely to spread than among the loosely connected (e.g., Zubcsek, Chowdhury, & Katona, 2014). As clusters—subgroups of interconnected individuals—emerge, connectivity across clusters determines information flow across groups and can be an indication of information sharing across dissimilar groups (e.g., Adamic & Glance, 2005). The rate of interconnection among users and clusters, then, characterizes networks and can highlight useful differences among them. Three social network concepts capture these differences and are helpful in characterizing the diversity of network structures: density, modularity, and isolates.
Density Density captures the interconnectivity of individuals in a network. It may vary from low density, where a group of individuals are loosely connected, to high density, where users
Himelboim et al. are highly interlinked (Hansen et al., 2011). The extent to which a network is densely interconnected affects the rate of information flow within it. Carley (1991) showed that interaction between individuals leads to shared knowledge, and shared knowledge leads to even more interaction, a finding that has important implications for the stability of a group and its interactions with individuals outside its boundaries. Granovetter (1973) noticed that tightly interconnected individuals are typically connected by strong and redundant ties. Burt (2005) noted that networks in which people are very highly interconnected are better at transmitting information. Similarly, Coleman (1990) demonstrated that an important outcome of strongly embedded close relationships is an increase in trust between individuals, which can lead to increased information transfer. Zubcsek et al. (2014) demonstrated that the intensity of communication between individuals within information communities is greater than in other areas of the network. Lerman and Ghosh (2010), in a study of the role of social network structures in the spread of information on Digg and Twitter, found that the rate at which information is spread through a network depended on its density.
Clusters and Modularity A common property that many networks have in common is clustering, or network transitivity, where two nodes that are both connected of the same third node have a higher probability of also being connected of one another. Put simply, two of your friends are more likely to know one another, than two people chosen at random from the population. As a network grows, clusters—subsets of nodes within a larger network becomes more interconnected, that is dense—are formed, whereas connections between these clusters are less dense (Newman, 2004). In social media, clusters are created, for example, when hyperlinks are selectively created between blogs, users follow one another on Twitter and friend one another on Facebook. Users create pathways for the flow of information when they create these connections. The resulting groups define the social boundaries of information flow; within these clusters, information flows freely, while across clusters information flow is restricted by the limited connectivity available across clusters. Individuals within interconnected clusters tend to share similar characteristics. This phenomenon is known as homophily and defined as “a basic organizing principle” that “a contact between similar people occurs at a higher rate than among dissimilar people” (McPherson, Smith-Lovin, & Cook, 2001, p. 416). Homophily, known broadly by the phrase “birds of a feather flock together,” captures a key characteristic of naturally occurring social networks and depicts a mechanism through which “distance in terms of social characteristics translates into network distance” (McPherson et al., 2001, p. 416). Put simply, homophily indicates that individuals are more likely to form new social network connections with others who are often very similar to them. Homophily, therefore, suggests that similar individuals will be socially closer to one
3 another than dissimilar people. Researchers, who have documented homophily for almost a century, found that it occurs especially strongly based on demographic characteristics such as age, sex, race, and education (Bott, 1928; Loomis, 1946). Homophily was also found to be based on psychological characteristics, such as intelligence, attitudes, and aspirations (Almack, 1922; Richardson, 1940), and to guide selection of peers, such as friendship (Verbrugge, 1977), career support at work (Ibarra, 1995), and mere contact (Wellman, 1996). Homophily is also found in political behavior and beliefs (Huckfeldt & Sprague, 1995; Knoke, 1990). Redundant information flows within these interconnected social components as users can obtain the same information through a variety of routes and because homogeneous groups of people are also likely to have similar information (Danowski, 1980; Rogers & Kincaid, 1981). Social media network research has also highlighted the importance of network clusters. Conover et al. (2011) found retweeting patterns to form clusters of politically like-minded users. Himelboim, McCreery, and Smith (2013) showed that users within a cluster contributed similar content and web URLs that reflected a shared political attitude. A similar pattern of homophilous polarization was also found in the blogosphere (Adamic & Glance, 2005), Facebook (Robertson, Vatrapu, & Medina, 2009), and in preferences for books bought on Amazon.com (Krebs, 2004). Choi and Park (2013) found similarities in conversation themes within clusters. The role of network clusters in information flow was also illustrated by Gomez-Rodriguez, Leskovec, and Krause (2012) who looked at information diffusion among websites, blogs, and social media for ongoing news events. They found that clusters of news media sites and blogs often emerge in a matter of hours or days, creating increased numbers of information pathways in the network by linking people and content. Clusters on Twitter, then, are generated as people decide for themselves who to reply to, mention, or retweet. Measuring the characteristics of clusters and the network in which they are embedded can improve our understanding of these pathways and, therefore, of information flow in social media. Social media networks vary in terms of the density of connections within them, and dense groups of people who mostly share a belief or orientation are key social features governing the rate and type of information that is distributed through social media. Modularity of network’s structure is a measure of the quality of clustering, a network partitioned into a set of interconnected subgraphs (Newman & Givran, 2004). Modularity captures the extent to which clusters are disconnected from one another (a range of values, from 0 to 1), distinguishing between networks with divided versus unified structures. It also helps distinguishing between two very different types of highly dense networks. High-density networks can be different from one another in terms of their clustering. Networks with one or two (or more) dense clusters can all have high overall network density scores. But networks with two or more dense clusters
4 that lack significant interconnection are very different from those with a single large dense cluster. These divided networks are highly modular. In contrast, a high-density network with low modularity is a single dense group, a unified community. Density alone does not distinguish between these network shapes. When combined with modularity, density can distinguish between unified and divided network patterns. These two distinct network structures, as discussed earlier, are substantially different in terms of information flow. Highly modular networks are characterized by a few highly intraconnected clusters that are loosely interconnected. Networks where users are highly interconnected regardless of cluster affiliation are, therefore, less modular.
Isolates Isolates are individuals with no ties to others in the network, which affect the density of the entire network. In contrast with the high-density networks just described, another class of social media networks are characterized by their lack of connectivity. In such networks, information can flow, but slowly (Burt, 2005; Carley, 1991; Lerman & Ghosh, 2010), and relationships are likely to be weaker (Coleman, 1990; Granovetter, 1973). Two types of low-density networks exist which can be further distinguished by measuring the fraction of people who have zero connections. In some low-density networks, small disconnected groups form alongside a population of isolates. In other low-density networks, the fraction of isolates is much larger. Density alone is often insufficient to distinguish these two types of networks.
Network Centralization and Hierarchical Information Flow Beyond interconnectivity, information flow can be characterized by the extent to which a network structure is hierarchical or egalitarian. A network in which one or a few actors attract a large and disproportionate number of connections depends primarily on these members for information flow and sharing. These few people are hubs as well as the gatekeepers in their networks. A less hierarchical distribution of connections is an indication of more egalitarian patterns of information sharing and flow. In social networks, centralization captures this key structural characteristic. The centralization of any network is a measure of how central its most central node is in relation to how central all the other nodes are (Freeman, 1979). Woo-young and Park (2012) found that the US news blogosphere exhibited a highly centralized structure, where information from the most central bloggers in the network dominated. In contrast, van den Bos (2006) found that the structure of the online community, created by the hyperlinks between websites of Iranians in the Netherlands, showed low centralization, with many focal points existence in that network.
Social Media + Society Two common structures, previously identified in social networking sites, are particularly helpful here (Kumar, Novak, & Tomkins, 2006). One structure is a star-shaped network in which a single charismatic or popular individual is linked to a varying number of other users who have very few connections among themselves. Star-shaped networks are identified by their high levels of network centralization. Park and Thelwall (2008) described this structure as “hub-and-spoke topology” and Hsu and Park (2011) as “hub-spoke network” (see also Jung, No, & Kim, 2014). Ediger, Jiang, Riedy, Bader, and Corley (2010) found that by news dissemination on Twitter, “many relationships fall into tree-like broadcast patterns” (p. 591). Park and Kluver (2009) illustrated the vulnerability of highly centralized networks. In a study of the blogosphere maintained by members of the 17th National Assembly in South Korea, they found sharp changes in centralization resulting from an individual members’ decline in activity. Himelboim and Han (2013) found that over time, star-shaped clusters disappeared as soon as their core actors—often a celebrity—stopped tweeting about the topic. Wang, Jiang, and Ma (2010) examined the network of Chinese scientist bloggers, revealing several loosely connected star-like clusters in the network, indicating the existence of topical subcommunities each centered around different bloggers who are ‘experts’ in particular domains. Social networks are composed of connections that can either have a direction or be mutual in nature. Some network connections are mutual or lack a direction, like the Facebook “Friend” relationship or marriage, which must be jointly accepted to exist. In contrast, in directed networks, the predominant direction of connections determines the nature of the information flow. Mentions and replies on Twitter are sent from one user to another. Star-shaped networks (i.e., highly centralized networks), then, have two forms: in and out directed. These different patterns are generated when a central hub is either the source or focus of attention in relationship with the many spokes. In an in-hub-and-spoke pattern, a central hub receives a large number of connections that start with the spokes and converge on the hub. Kleinberg (1999), studying hyperlink networks, suggested that measuring hubs as nodes with high in-degree, while not perfect, extracted authorities from the overall collection of web pages. In an out-hub-and-spoke pattern, the hub is the source of most of the connections to the many spokes. In both cases, the spokes tend not to connect to one another. Since both in and out hub-and-spoke networks have high levels of centralization, we can distinguish between these two different types of networks by comparing the distribution of in- and outdegree (for further discussion, see White & Borgatti, 1994).
Twitter Social Media Networks: Typology and Measurements Social media networks vary in terms of their patterns of social interactions and emergent structures (Smith, 2015).
Himelboim et al.
5
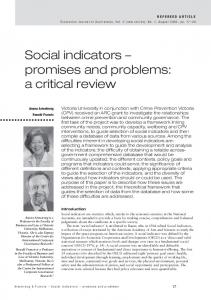
Figure 1. Twitter structure classification process.
Understanding the overall structure of a network is key for understanding how information flows among its users. Current use of social network analysis to understand information flow, while rich and valuable, suffers from two key pitfalls. First, it tends to focus on user-level metrics, such as centrality measurements (see Freeman (1979) and Burt (2005) for early work, and Ahn and Park (2015) for social media–related work). Second, it focuses on a single measurement, such as density (Lerman & Ghosh, 2010) or centralization (Woo-young & Park, 2012), to characterize information flow in the entire network, neglecting the variation within each metric, which can be further captured using multiple network-level measurements. As discussed earlier, a single network-level measurement (e.g., density) may indicate very different patterns of information flow, which cannot be classified, unless integrated with another measurement (e.g., modularity). Network structures, then, are characterized here and distinguished from one another using a combination of a few basic network metrics. The result is a typology of six basic network structures that can be used to distinguish the variety of patterns of information sharing and flow within Twitter. Social network research has established the critical role that patterns of connections play in information flow. We propose an overarching typology of network structures based on
variations in basic network measures. While grounded in the social networks literature, this study has an exploratory component. Stemming from our literature review, we suggest a series of steps in which different network metrics are evaluated as “high” or “low,” which can result in a system for social media network classification (see Figure 1): •• First, networks characterized by hub-and-spoke structures are identified based on their centralization values. Highly centralized networks have distinct patterns centered on a few individuals who attract connections from or to many otherwise loosely connected people. Centralization is the defining characteristic of highly hierarchical networks. Other measures of interconnectivity are defining attributes of networks that do not form such hierarchical structures. •• Second, therefore, networks with low centralization scores are further classified by their network density. High density may ambiguously indicate two qualitatively different structures of information flow: unified or divided clusters. •• Therefore, third, the high-density set of networks is further distinguished in terms of their level of modularity, the measure of the interconnectedness of clusters (in contrast to network density, which measures
6
Social Media + Society the connections among individual users). Low-density networks can also result from two distinct scenarios: a sparse but connected set of users or a network of isolates with a few clustered subgroups of users. •• The fourth and final step, therefore, is to distinguish between low-density topic-networks based on the relative fraction of isolate users (who have mentioned no other users and have not been mentioned by any other user). Modularity is not an effective way to differentiate between low-density networks which are less likely to create large meaningful clusters. These concepts lead to methods that guide our analysis and typology of Twitter topic-networks.
Methods Data This study provides concepts and methods for classifying social media networks based on common network metrics. A social media topic-network is created whenever a keyword or hashtag, or the combination of those, is used to search and select a distinct collection of messages. The complete universe of these networks includes all possible combinations of hashtags and keywords on Twitter. The number of possible topic subgraphs based on a search string (i.e., topic-networks) is, therefore, practically infinite. Therefore, a random or other probability sampling is not practical. Furthermore, the selected datasets were used to illustrate the classification model, rather than to be generalized to the entire Twittersphere. Our approach is based on the observations possible through the public Twitter API by outside researchers without commercial or internal access to data. To create a systematic dataset, we selected social media network data from the NodeXL Graph Gallery, across a variety of topics (including health, politics, leisure, academic, and commercial). NodeXL is a free and open-source network analysis and visualization software package for Microsoft Excel. The NodeXL Graph Gallery hosts an extensive collection of social media network data that were used to identify a variety of Twitter social media topic-networks and structures. This study identifies and quantifies a variety of social media network structures. We selected networks for analysis by searching the NodeXL Graph Gallery to find 60 topicnetworks which displayed distinct patterns of interconnectivity. Each twitter dataset includes lists of users who tweeted about a given hashtag(s), keyword(s), or combinations of these, collected within the limits of the Twitter API. This typically results in collections of several thousands of tweets or about a week of data. The dataset includes Twitter usernames, user statistics, their topic-related tweets, as well as the relationships among these users (created whenever they mention or reply to one another). As users connect to other users, they create networks which can be extensively analyzed using the tools of social network analysis.
Variables and Measurements Social network analysis was applied to selected Twitter datasets, creating a range of measures: density, clustering and modularity, centralization, and proportion of isolates. A network’s density was represented as a ratio of the number of links present to the maximum number of links possible (Wasserman & Faust, 1994). Density values can vary between 0 and 1. If nodes are highly interconnected with one another, the density of that network will be high. If nodes are loosely interconnected, the density value will be low. We identified clusters of relatively more connected groups of users in the topic-networks using the Clauset– Newman–Moore clustering algorithm (Clauset, Newman, & Moore, 2004), which is included in the NodeXL software. We selected this algorithm for its ability to analyze large network datasets and efficiently find subgroups. This algorithm uses edge betweenness as a metric to identify the boundaries of communities. Each user, then, is classified into the best fit group (cluster), based on the level of interconnectivity among users. We use Clauset et al.’s (2004) measurement of modularity to measure the quality of the divisions imposed on the network. Modularity measures the extent to which the division among clusters is a good one, in the sense that there are many links within clusters and only a few between. Modularity values range between 0 and 1. The higher the modularity value, the more distinct or separated the clusters are, that is, the clusters are less interconnected. Centralization measures the dispersion of centrality of nodes throughout the network. “The degree to which the centrality of the most central point exceeds the centrality of all other points” (Freeman, 1979, p. 227). If one node is part of the majority of the links in a network, the centralization score will be high. However, networks with more modestly connected central nodes will have low centralization values. Twitter networks are directed, meaning that each link has a direction (e.g., Jane may mention Jake on Twitter, constituting a link from Jane to Jake). In terms of centralization, therefore, two distinct values were measured: in-degree and out-degree centralization. A high centralization measure means that one or a few actors have many more links than the rest. In-degree centralization means that one or a few nodes have a large and disproportionate number of links directed to them, while high out-degree centralization means that one or a few nodes initiated large proportions of the links. Isolates are defined as users who are not connected to others in the network. In the case of Twitter topic-networks, isolates are users who tweeted about a given topic but did not mention or replied to others who tweeted about the topic and were not mentioned or replied to by others in that topicnetwork. For each network, the portion of isolates of the total number of users in that network was calculated and may vary between 0 and 1.
7
Himelboim et al.
centralization, based on high in-degree and high out-degree centralization values. Although out-degree centralization values ranged widely across datasets (M = 0.26, SD = 0.20; range: 0.09–0.63), in all topic-networks, but one (@delllistens), in-degree centralization (M = 0.70, SD = 0.15; range: 0.50–0.96) was higher than out-degree centralization, regardless of topic.
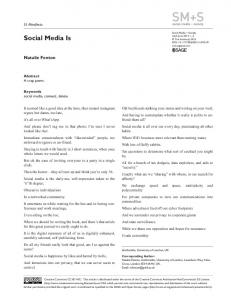
Graph Typology by Density, Modularity, and Isolates Figure 2. Distribution of centralization values.a
a A scree plot was used to identify the point where centralization values dropped as the cutoff point between high and low values. The x-axis is set to logarithmic scale, for clearer determination of the drop point (0.59). Neither mean (0.26) nor median (0.32) captured this point of change in the distribution.
Results Graph Typology by Centralization Centralization values for the 60 network datasets we selected were calculated. The highly skewed distribution of centralization values, posed a challenge for using conventional cutoff values. Mean, first or third quartiles, and median were all calculated, but neither captured the natural drop from high to low in the distribution of centralization values. Himelboim, Gleave, and Smith (2009), confronting a similar issue, used a scree plot method to determine the threshold between low and high values, in highly skewed distribution of social networks values. This approach, which originated as a method to identify key components in factor analysis, has been successfully used to categorize values as low/high. Following this procedure, centralization values were ordered in descending order. A centrality value of 0.59 was found to be the threshold, where values dropped (Figure 2). Topic-networks exhibiting values 0.59 or higher, then, were categorized as high, while others were categorized as low centralization. This resulted in 14 topic-networks of high centralization (M = 0.72, standard deviation [SD] = 0.12; range: 0.59–0.97). Topics included organizations’ support accounts, such as Virgin Airlines, KLM, Dell, Advantage, and Techsoup (technology support organization), and newsrelated accounts, such as Al Jazeera (@AJStream) and SciFri radio programs and HealthRankings (an annual report on US health outcomes). Other network-topics in this category included awscloud (web-based IT service), onecampaign (a charity), bizspark (Microsoft startup support), #JWST and #WWTelescope (observatories), sqlpass (tech support), and sxsw (a marketing conference). In Twitter networks, links are directed; therefore, degree centralization was used only for the initial categorization. We further distinguish networks with high levels of
For the rest of the classification process, the more conventional breakpoint for low and high values, the mean, was successfully applied. The remaining graphs—those classified as low centralization—networks were first classified based on variation in the mean value of density (M = 0.12, SD = 0.02). Within the high-density graphs (n = 12), modularity was used to define the major two categories (M = 0.29; SD = 0.03), breaking the groups of graphs into low modularity (n = 7) and high modularity (n = 5). The low-density group of graphs (n = 34) were divided based on the portion of isolates in them, using its average (M = 0.19, SD = 0.13), resulting in high-isolate (n = 18) and low-isolate (n = 16) groups of low density. Both modularity and the values for the portion of isolates were distributed normally, which suggests means were appropriate to use as threshold values. Topic-networks in the high density and high modularity category included political issues in dispute, such as “#p2” (“Progressives 2.0”), “Sequester,” “Tea Party,” and “State of the Union” (#sotu). Users talking about these issues formed two or three closely knitted clusters, which are very loosely interconnected, resulting in overall high density and high modularity. Topics in the high density and low modularity category, in contrast, were often associated with conferences and professional organizations, such as “#rethink13” (an advertising conference), “#cmgr” (social media “community managers”), “#mrx” (market research exchange), and “NICAR” (National Institute for Computer-Assisted Reporting). Twitter activity surrounding these topics reflected tightly intertwined users, within and across clusters. The low density and high isolates category included very popular topics that did not bring together Twitter users, such as “Gangnam Style,” “Melinda Gates,” “Doula,” “Merck,” “Reproductive health,” and “Immunization.” The last category, low density and low isolates, also had a mix of topics which included conferences such as “ICA13” (the International Communication Association) and “engage2013” (an online marketing conference), social movements such as “#putinout” (protest against President Putin), and hashtags related to topical conversations, such as “globalhealth” (discussion of improving world health) and “#ddj” (data-driven journalism). As discussed later, lowdensity topics did not have a clear thematic characteristic: classification of networks by category (Table 1) and visualizations of structures (Figure 3).
8
Social Media + Society
Table 1. Classification of topic-networks. High Density/ Low Modularity In-Group
High Density/ High Modularity Polarized
#mrx
p2
#G8
NodeXL
nptech
SOTU
Common Core
scio14
cmgr
Hagel
Autism
IR15
#idlenomore
#OHSen
Crawley
opengov
#rethink13
my2k
#CENews
#putinout
nicar
Merck
engage2013
uniteblue
Africa Health
ICTD OR ICT4D
Nutrition
#ddj
#cnn
www2014
Melinda Gates
#globalhealth
Doula
dataviz
#BringBackOurGirls
#ICA13
Gangnam Style
CAADP
Reproductive Health
ibmiod
Immunization
#startup
HIV AIDS
Polio
PeoplePower
Debt Ceiling
(Market Research Exchange)
(Non-profit Technology)
(Community manager) (The First Nations movement in Canada) (Advertising conference)
(Progressives 2.0)
(State of the Union)
(Former Defense Secretary of the U.S.) (used to discuss the Senate Race in Ohio) (Amount a change in US tax policy would impose on households)
(National Institute of Computer Assisted Reporting) (Liberal social movement)
Low Density/ High Isolates Brand Clusters (Leading industrial nations)
(State Education Standards Initiative)
(A character on the TV show Downton Abbey) (Consumer Electronics News)
(Pharmaceutical manufacturer)
(Public interest topic)
(Cable News Network) (Leading philanthropist)
(A birth assistant) (Movement to return the kidnapped Nigerian girls)
(Korean Pop Music Song)
(Safesforce.com conference)
Low Density/ Low Isolates Community Clusters (Popular social network analysis tool) (ScienceOnline Together 2014 conference) (Internet Research Conf’)
(Protest against Russian President Valdimir Putin) (Online marketing conference)
(Information and communication technology for development) (Data driven journalism) (WWW Conference) (Discussion of improving world health) (Data visualization) (Inter’ Communication Association Conference)
Discussion
Hub-and-Spoke: Broadcast and Support
Connections among Twitter users define the boundaries of information flow. As individuals and organizations mention, retweet, and reply, they create networks of information flow. Social network research identifies levels of interconnectivity and centralization as key concepts to categorize Twitter networks. We propose a typology of Twitter topic-networks: broadcast and support, polarized and in-group, and brand and community.
Characterized by high degree of centralization, this group of topical networks forms star-shaped structures, described by others as a “hub-and-spoke topology” (Park & Thelwall, 2008). Individuals in these networks connect to a single or a small number of actors for the majority of the flow of information, resulting in a concentration of power in the hands of very few. Wang et al. (2010) and Welser, Gleave, Fisher, and Smith (2007) identified hubs at the center of
Himelboim et al.
9
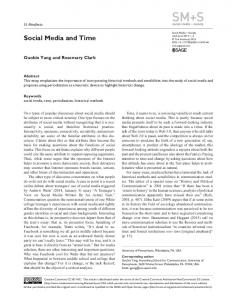
Figure 3. Network visualization by topic-network category.
centralized networks as experts. This structure can result in unstable communication networks since a decline in activity of a single actor can disconnect most users thus interrupting information flow. Himelboim and Han (2013) found that highly centralized clusters in health-related Twitter topic-networks often disappeared over time. In this study, in all but one network in this category, in-degree centralization was higher than out-degree centralization, suggesting that information in these networks is copied or repeated from hubs by fragmented users. Two distinct topics of hub-and-spoke topic-networks emerge: “Broadcast” networks often are centered around well-known media outlets, pundits, and organizations (e.g., @AJStream, an Al Jazeera account; @Onecampaign, an advocacy organization; and @Techsoup, a technology assistance program). All of these networks have a distinctive
hub-and-spoke structure in which many people repeat what a prominent hub account tweets. This is similar to the US news blogosphere: information in the network is greatly concentrated on the most central bloggers (Woo-young & Park, 2012). We categorized these networks as “broadcast” because of the traditional mass communication approach displayed. The nonhub members of a broadcast network are the “audience”—they are often connected only to the hub, without any connections to one another. This pattern resembles the traditional media broadcast model. We categorized a second group of topics, which also had highly centralized structures, as “customer support.” These were often centered on major service industries such as airlines (Virgin America) and consumer electronics companies (Dell Computer). Complaints for major businesses are often handled by a Twitter service account that attempts to resolve
10 and manage customer issues. In the customer support network structure, the hub account replies to many otherwise disconnected users, creating outward spokes. These messages are often retweeted, either by the complaining customer, or by others, creating links that are directed back to the hub. Implications. Many organizations use social media to communicate with their publics. An active Twitter account is often the first step taken when establishing a social media presence. Many news media Twitter accounts attract many followers who retweet them frequently. These accounts often treat social media spaces as a traditional one-to-many communication media, avoiding interacting with users. These structures can be thought of as “audiences.” Contrast this pattern with denser communities, in which users share an interest in a subject exchange information and opinions. Like the “audience,” the service population in a customer support network is not a “community” in the sense of a densely intraconnected group, and information flow in these networks relies almost exclusively on the central user.
Divided: Polarized Clusters Networks that are characterized by high graph density and high modularity are called “Polarized.” Polarized networks are formed from a few large and dense groups with little connection between them. The interconnectedness—density—of the graph is a result of the connectedness within the clusters, rather than the interconnections of all users in the network. The topics being discussed in these networks are often highly divisive and heated political subjects (e.g., sequester, State of the Union and Hagel). These clusters capture the idea of “homophily,” in which individuals seek mostly to interact with others who are similar to themselves (McPherson et al., 2001). Divided network structures reflect the creation of silos of information flow, as illustrated in American political talk on Twitter (Himelboim et al., 2013) and in face-to-face interactions (Knoke, 1990). These users linked to common information sources that corresponded with, rather than challenging, their political ideology. Stronger relationships develop within these dense clusters (Granovetter, 1973) which lead to an increase in trust between individuals that can lead to increased information transfer (Coleman, 1990). Implications. Political and other forms of conflict over issues in dispute can be studied by analyzing the size, content, and connections among polarized clusters. The polarized network structure confirms concerns by Van Alstyne and Brynjolfsson (1996), Sunstein (2006), and others that network mediated interactions would lead to the formation of divided groups that are increasingly homogeneous. Divided network structures provide an opportunity for brokers who occupy structural holes (Burt, 2005) and bridge these divided clusters to play an important role.
Social Media + Society
Unified: In-Group Networks characterized by high graph density and low modularity are considered to have an “in-group structure.” The clusters that emerge in these networks are highly interconnected and essentially overlap one another. High-density networks enable shared knowledge, interaction, and stability (Carley, 1991), as well as strongly embedded close relationships (Coleman, 1990). Granovetter (1973), nonetheless, highlights the limitations of a structure composed mostly of strong ties. Weak ties often characterize relationships among individuals who are dissimilar, allowing information to flow from and to individuals and groups who can provide novel knowledge. Densely interconnected in-group structures of a topic-network are composed of highly redundant connections and information. Many conferences, professional topics, hobby groups, and related subjects create an in-group form (e.g., #rethink13, a market research conference; #idlenomore, the Canadian protest movement; and #uniteblue, a liberal social movement). These findings correspond with an earlier work by Smith’s (2015), who also found that networks surrounding conferences tend to exhibit tight interconnectivity. Implications. In-group Twitter networks formed by communities with an active core of members may lack many new and potentially diverse members. In a community, individuals are heavily interconnected, so information shared is likely to reach the entire group. For conferences, such a structure may serve its purpose, connecting convention participants or members. For grassroots movements such as UniteBlue (#uniteblue), in contrast, forming an in-group network may suggest a failure to grow and diversify beyond their core group of activists. However, some conferences may be more successful attracting different audiences, leading to more distinct clusters.
Fragmented: Brand Clusters Low graph density Twitter topic-networks have a large number of people who lack any connections at all (called “isolates”). These topic-networks are often related to brands, celebrities and other popular subjects, such as Melinda Gates, Gangnam Style, and the G8. Popular topics often attract Tweets that are not part of a conversation; individuals rarely engage with others who tweet about the topic. Tweets from many isolates are often associated with popular subjects and well-known brands. These topics attract large fragmented Twitter populations who tweet about it but not to each other. Implications. Sparse network structures indicate that a group of Twitter users interacted very little with one another and did not share knowledge (Carley, 1991), inhibiting information flow (Lerman & Ghosh, 2010). Organizations often
11
Himelboim et al. rely on Twitter users to pass along information by retweeting and mentioning their messages. In a fragmented brand structure, most users do not share information or interests with others in the topic-network. These topics lack central sources of information (i.e., hubs) and do not form core communities.
Clustered: Community Clusters Networks with low graph density and a low portion of isolates are “community clusters.” These networks are like the fragmented brand networks, but the portion of isolates is lower. Small groups of interconnected users (i.e., clusters) do emerge in community cluster networks, alongside a lower fraction of isolated users than found in a brand network. Conferences, such as #ICA13 (the International Communication Association) or WWW2014 (World Wide Web Conference), and social and cultural initiatives, such as the online marketing conference Engage2013 and #globalhealth (a discussion of improving world health), shared this pattern. The clusters in these networks are mostly disconnected from one another, indicating multiple centers of activity, each with its own audience, influencers, and sources of information. Implications. Clustered community network limits information flow to small silos of individuals, who rely on one or a few connected users for all topic-related content. Multiple smaller clusters characterize the “clustered communities” network pattern, which were found to be stable over time (Himelboim & Han, 2013). Some information sources and subjects ignite multiple conversations, each cultivating its own audience and community, reflecting diverse angles on a subject. These clusters reveal the diversity of opinion and perspective on a social media topic. Clustered communities have no single source of information that dominates what is shared by individuals. Events, like Engage2013, display community clusters, meaning that the topic has attracted spontaneous conversations among different groups of individuals. This is also an indication of the limited social media activity of the official Engage2013 user account.
Conclusion We propose concepts and methods for classifying patterns of information flow on Twitter based on the network structures users collectively create as they post about a given topic. Six categories were identified: “Broadcast” and “Support,” “Polarized” and “In-Group,” and “Brand” and “Clustered Community” networks. Each has unique characteristics in terms of the boundaries of information flow it creates. This classification is also useful for evaluating social media activity and constructing strategies for Twitter and other social media spaces. Organizations and social media managers may
desire to steer their communities toward a certain structure and evaluate their success by measuring change in the proposed key metrics.
Limitations and Future Studies While this study analyzed Twitter networks, future studies may apply this model to other social media networks. For example, Xu, Park, Kim, and Park (2016) examined YouTube networks, which revealed structures that resembled community structures. Xu, Park, and Park (2015) found that network structures varied based on the type of links on YouTube. Future research may also explore the relationship between link type and structure. Furthermore, this study does not claim to capture all possible topic-network structures. Many types of topics were not included, which may form additional structures or refine existing ones, which may lead to a wider variety of categories. A topic-network structure may also change over time, potentially shifting across categories, which has not been examined here. Additionally, the cutoff points are based on this specific set of networks and may vary across other networks. We hope future studies will build on this research, validate, or refine the classification cutoff points, examining new topic-networks and exploring network dynamics over time. Declaration of Conflicting Interests The author(s) declared no potential conflicts of interest with respect to the research, authorship, and/or publication of this article.
Funding The author(s) received no financial support for the research, authorship, and/or publication of this article.
Note 1. www.nodexlgraphgallery.org
References Adamic, L. A., & Glance, N. (2005, August). The political blogosphere and the 2004 US election: Divided they blog. In Proceedings of the 3rd International Workshop on Link Discovery (pp. 36–43). New York, NY: ACM. Retrieved from http://dl.acm.org/citation.cfm?id=1134277 Ahn, H., & Park, J. H. (2015). The structural effects of sharing function on Twitter networks: Focusing on the retweet function. Journal of Information Science, 41, 354–365. Almack, J. C. (1922). The influence of intelligence on the selection of associates. School and Society, 16, 529–530. Borgatti, S. P. (2005). Centrality and network flow. Social Networks, 27, 55–71. Bott, H. (1928). Observation of play activities in a nursery school. Genetic Psychology Monographs, 4, 44–88. Browne, E. P., Li, J., Chong, M., & Littman, D. R. (2005). Virushost interactions: New insights from the small RNA world. Genome Biology, 6(11), 238. doi:10.1186/gb-2005-6-11-238
12 Bruns, A., & Stieglitz, S. (2013). Towards more systematic Twitter analysis: Metrics for tweeting activities. International Journal of Social Research Methodology, 16, 91–108. Burt, R. S. (2005). Brokerage and closure: An introduction to social capital. Oxford, UK: Oxford University Press. Carley, K. (1991). A theory of group stability. American Sociological Review, 56, 331–354. Choi, S., & Park, H. W. (2013). An exploratory approach to a Twitter-based community centered on a political goal in South Korea: Who organized it, what they shared, and how they acted. New Media & Society, 16, 129–148. Clauset, A., Newman, M. E. J., & Moore, C. (2004). Finding community structure in very large networks. Physical Review E, 70, 066111. Coleman, J. S. (1990). Foundations of social theory. New York, NY: Belknap Press. Conover, M., Ratkiewicz, J., Francisco, M. R., Gonçalves, B., Menczer, F., & Flammini, A. (2011). Political polarization on twitter. ICWSM, 133, 89–96. Danowski, J. A. (1980). Group attitude uniformity and connectivity of organizational communication networks for production, innovation, and maintenance content. Human Communication Research, 6, 299–308. Ediger, D., Jiang, K., Riedy, J., Bader, D. A., & Corley, C. (2010, September). Massive social network analysis: Mining twitter for social good. In 2010 39th International Conference on Parallel Processing (pp. 583–593). New York, NY: IEEE. Fell, D. A., & Wagner, A. (2000). The small world of metabolism. Nature Biotechnology, 18, 1121–1122. doi:10.1038/81025 Freeman, L. C. (1979). Centrality in social networks: Conceptual clarification. Social Networks, 1, 215–239. Gomez-Rodriguez, M., Leskovec, J., & Krause, A. (2012). Inferring networks of diffusion and influence. ACM Transactions on Knowledge Discovery from Data (TKDD), 5(4), 21. Granovetter, M. S. (1973). The strength of weak ties. American Journal of Sociology, 78, 1360–1380. Hansen, D. L., Shneiderman, B., & Smith, M. A. (2011). Analyzing social media networks with NodeXL: Insights from a connected world. Burlington, MA: Morgan Kaufmann. Himelboim, I., Gleave, E., & Smith, M. (2009). Discussion catalysts in online political discussions: Content importers and conversation starters. Journal of Computer Mediated Communication, 14, 771–789. doi:10.1111/j.1083-6101.2009.01470.x Himelboim, I., & Han, J. Y. (2013). Cancer talk on Twitter: Patterns of information seeking in breast and prostate cancer networks. Journal of Health Communication, 19, 210–225. doi:10.1080/ 19312458.2013.813922 Himelboim, I., McCreery, S., & Smith, M. (2013). Birds of a feather tweet together: Integrating network and content analyses to examine cross-ideology exposure on Twitter. Journal of Computer-Mediated Communication, 18, 40–60. doi:10.1111/ jcc4.12001 Hsu, C. L., & Park, H. W. (2011). Sociology of hyperlink networks of Web 1.0, Web 2.0, and Twitter: A case study of South Korea. Social Science Computer Review, 29, 354–368. Huckfeldt, R., & Sprague, J. (1995). Citizens, politics, and social communication: Information and influence in an election campaign. Cambridge, UK: Cambridge University Press.
Social Media + Society Ibarra, H. (1995). Race, opportunity, and diversity of social circles in managerial networks. Academy of Management Journal, 38, 673–703. Jung, K., No, W., & Kim, J. W. (2014). Who leads nonprofit advocacy through social media? Some evidence from the Australian Marine Conservation Society’s Twitter networks. Journal of Contemporary Eastern Asia, 13, 69–81. Kleinberg, J. M. (1999). Authoritative sources in a hyperlinked environment. Journal of the ACM, 46, 604–632. Knoke, D. (1990). Networks of political-action: Toward theory construction. Social Forces, 68, 1041–1063. Krebs, V. (2004). The social life of books: Visualizing communities of interest via purchase patterns on the WWW. Retrieved from http://orgnet.com/booknet.html Kumar, R., Novak, J., & Tomkins, A. (2006, August 20-23). Structure and evolution of online social networks. Proceedings of the 12th ACM SIGKDD International Conference on Knowledge Discovery and Data Mining, Philadelphia, PA. Lerman, K., & Ghosh, R. (2010). Information contagion: An empirical study of the spread of news on Digg and Twitter social networks. ICWSM, 10, 90–97. Loomis, C. P. (1946). Political and occupational cleavages in a Hanoverian Village, Germany: A sociometric study. Sociometry, 9, 316–333. McPherson, M., Smith-Lovin, L., & Cook, J. M. (2001). Birds of a feather: Homophily in social networks. Annual Review of Sociology, 27, 415–444. Milgram, S. (1967). The small world problem. Psychology Today, 2, 60–67. Moore, C., & Newman, M. E. J. (2000). Epidemics and percolation in small-world networks. Physical Review E, 61, 5678–5682. doi:10.1103/PhysRevE.61.5678 Newman, M. E., & Girvan, M. (2004). Finding and evaluating community structure in networks. Physical Review E, 69(2), 026113. Newman, M. E. J. (2004). Detecting community structure in networks. The European Physical Journal B-Condensed Matter and Complex Systems, 38(2), 321–330. Offenhuber, D., & Richards, W. (2007). Structure of an on-line community: Bands in MySpace. Retrieved from http://citeseerx.ist. psu.edu/viewdoc/download?doi=10.1.1.149.4640&rep=rep1& type=pdf Park, H. W., & Kluver, R. (2009). Trends in online networking among South Korean politicians: A mixed-method approach. Government Information Quarterly, 26, 505–515. Park, H. W., & Thelwall, M. (2008). Developing network indicators for ideological landscapes from the political blogosphere in South Korea. Journal of Computer-Mediated Communication, 13, 856–879. Richardson, H. M. (1940). Community of values as a factor in friendships of college and adult women. Journal of Social Psychology, 11, 303–312. Robertson, S. P., Vatrapu, R. K., & Medina, R. (2009, May 1721). The social life of social networks: Facebook linkage patterns in the 2008 U.S. presidential election. Proceedings of the 10th Annual International Conference on Digital Government Research, Puebla, Mexico. Rogers, E. M., & Kincaid, D. L. (1981). Communication networks: Toward a new paradigm for research. New York, NY: Free Press.
13
Himelboim et al. Smith, M. A. (2015). Catalyzing social media scholarship with open tools and data. Journal of Contemporary Eastern Asia, 14, 87–96. Sunstein, C. (2006). Republic 2.0. Princeton, NJ: Princeton University Press. Van Alstyne, M., & Brynjolfsson, E. (1996, December). Electronic communities: Global village or cyberbalkans?. In Proceedings of the 17th International Conference on Information Systems. New York: Wiley. van den Bos, M. (2006). Hyperlinked Dutch-Iranian Cyberspace. International Sociology, 21, 83–99. Verbrugge, L. M. (1977). Structure of adult friendship choices. Social Forces, 56, 576–597. Wang, X., Jiang, T., & Ma, F. (2010). Blog-supported scientific communication: An exploratory analysis based on social hyperlinks in a Chinese blog community. Journal of Information Science, 36, 690–704. Wasserman, S., & Faust, K. (1994). Social network analysis: Methods and applications. New York, NY: Cambridge University Press. Watts, D. J. (1999). Small worlds: The dynamics of networks between order and randomness. Princeton, NJ: Princeton University Press. Wellman, B. (1996). Are personal communities local? A Dumptarian reconsideration. Social Networks, 18, 347–354. Welser, H. T., Gleave, E., Fisher, D., & Smith, M. (2007). Visualizing the signatures of social roles in online discussion groups. Journal of Social Structure, 8(2), 1–32. White, D. R., & Borgatti, S. P. (1994). Betweenness centrality measures for directed graphs. Social Networks, 16, 335–346. Woo-young, C., & Park, H. W. (2012). The network structure of the Korean blogosphere. Journal of Computer-Mediated Communication, 17, 216–230. Xu, W. W., Park, J. Y., Kim, J. Y., & Park, H. W. (2016). Networked cultural diffusion and creation on YouTube: An analysis of YouTube memes. Journal of Broadcasting & Electronic Media, 60, 104–122.
Xu, W. W., Park, J. Y., & Park, H. W. (2015). The networked cultural diffusion of Korean wave. Online Information Review, 39, 43–60. Zubcsek, P. P., Chowdhury, I., & Katona, Z. (2014). Information communities: The network structure of communication. Social Networks, 38, 50–62.
Author Biographies Itai Himelboim, PhD, is an Associate Professor of Advertising and the Director of the SEE Suite (http://seesuite.uga.edu/), Social media Engagement & Evaluation laboratory at the University of Georgia. His research (https://www.researchgate.net/profile/Itai_ Himelboim) interests include, social network analysis, social media analytics, patterns of information flow, emerging communities, and influential users. Marc A. Smith, PhD, is the Co-founder and Director of the Social Media Research Foundation where he leads the NodeXL project. His research interests include computer-mediated collective action, social networks, social media, and information visualization. Lee Rainie is the Director of Internet, Science, and Technology research at the Pew Research Center, a nonprofit, nonpartisan “fact tank” that studies the social impact of the Internet. The project has issued more than 600 reports based on its surveys that examine people’s online activities and the Internet’s role in their lives. Ben Shneiderman (PhD, SUNY-Stony Brook) is a Professor of Computer Science at the University of Maryland. His research interests include human–computer interaction, information visualization, and social media analysis. Camila Espina (MA, Syracuse University) is a student of Mass Communication at the University of Georgia. Her research interests include crisis communication, social media, and media effects.