Click Model-Based Information Retrieval Metrics Aleksandr Chuklin
Pavel Serdyukov
Maarten de Rijke
Yandex & ISLA, University of Amsterdam Moscow, Russia
Yandex Moscow, Russia
ISLA, University of Amsterdam Amsterdam, The Netherlands
[email protected]
[email protected]
ABSTRACT In recent years many models have been proposed that are aimed at predicting clicks of web search users. In addition, some information retrieval evaluation metrics have been built on top of a user model. In this paper we bring these two directions together and propose a common approach to converting any click model into an evaluation metric. We then put the resulting model-based metrics as well as traditional metrics (like DCG or Precision) into a common evaluation framework and compare them along a number of dimensions. One of the dimensions we are particularly interested in is the agreement between offline and online experimental outcomes. It is widely believed, especially in an industrial setting, that online A/B-testing and interleaving experiments are generally better at capturing system quality than offline measurements. We show that offline metrics that are based on click models are more strongly correlated with online experimental outcomes than traditional offline metrics, especially in situations when we have incomplete relevance judgements.
Categories and Subject Descriptors H.3.3 [Information Storage and Retrieval]: Information Search and Retrieval
General Terms Human Factors, Verification
Keywords Click models, evaluation, information retrieval measures, user behavior
1.
INTRODUCTION
There are currently two orthogonal approaches to evaluating the quality of ranking systems. The first approach is usually called the Cranfield approach [17] and is done offline. It uses a fixed set of queries and documents judged by Permission to make digital or hard copies of all or part of this work for personal or classroom use is granted without fee provided that copies are not made or distributed for profit or commercial advantage and that copies bear this notice and the full citation on the first page. Copyrights for components of this work owned by others than ACM or the author must be honored. To copy otherwise, or republish, to post on servers or to redistribute to lists, requires prior specific permission and/or a fee. SIGIR’13, July 28–August 1, 2013, Dublin, Ireland. Copyright 2013 ACM 978-1-4503-2034-4/13/07 ...$15.00.
[email protected]
trained people (assessors). Ranking systems are then evaluated by comparing how good their ranked lists are—among other things, a system is expected to place relevant documents higher than irrelevant ones. Another approach described by Kohavi et al. [28] makes use of real online users by assigning some portion of the users to test groups (also called flights). The simplest variant, called A/B-testing, randomly assigns some users to the “control” group (these users are presented with the existing ranking results) and the “treatment” group (these users are presented with the results of an experimental ranking system). Ranking systems are then compared by analysing the clicks of the users in the “control” against those in the “treatment” group. In the interleaving method by Joachims [27] users are presented with a combined list made out of two rankings. Then the system that receives more clicks is assumed to be better. One of the main advantages of online evaluation schemes is that they are user-based and, as a result, often assumed to give us more realistic insights into the real system quality. Interleaving experiments are now widely being used by large commercial search engines like Bing and Yahoo! [11, 31] as well as studied in academia [22, 32]. However, they are harder to reproduce than offline measurements, whereas in the traditional Cranfield approach one can re-use the same set of judged documents to evaluate any ranking. This makes the use of offline editor-based evaluation methods unavoidable during the early development phase of ranking algorithms. One should take care, however, that the resulting editor-based measurements agree with the outcomes of online experiments—online comparison is often used as the final validation step before releasing a new version of a ranking algorithm. In order to bring the two evaluation approaches closer to each other, we propose a method for building an offline information retrieval (IR) metric from a user click model. Click models, probabilistic models of the behavior of web search users, have been studied extensively by the IR community during the last five years. The main purpose of predicting clicks, as seen in previous works, is: (1) modeling user behavior when real users are not available (see, e.g., [23]); (2) improving ranking using relevance inferred from clicks (e.g., [10]). We hypothesize that click models can also be turned into offline metrics and the resulting click modelbased metrics should be closely tied to the user and hence should better correlate with online measurements than traditional offline metrics. In addition, there is a growing trend to ground offline metrics in a user model and that is exactly
what click modeling does—trying to propose a better user model. So, the question is why not use better user models, based on click behavior, as the basis for offline metrics? We put our proposal for transforming click models into metrics to the test through a set of thorough comparisons with online measurements. Our comparison includes an analysis of correlations with the outcomes of interleaving experiments, an analysis of correlations with absolute online metrics, an analysis of correlations between traditional offline metrics and our new click model-based metrics, as well as an analysis of the discriminative power of the various metrics. One dimension to which we devote special attention in our comparison framework concerns unjudged documents. As was shown by Buckley and Voorhees [5], having partially-judged result pages in the evaluation pool may result in biased measurements. We examine how different offline metrics handle this problem. We also show that in situations when we cannot afford to use only fully-judged data, we can still make good use of the available data by making adjustments, by either a technique called condensation [34] or a new threshold method that we propose. The main research questions that we address in this work are: ‚ How do click model-based IR metrics compare to the traditional offline metrics? ‚ How well do different offline IR metrics agree with online experiments? Do click model-based metrics show higher agreement? ‚ How well do different offline metrics perform in the presence of unjudged documents? ‚ How can we modify offline metrics to enhance agreement with online experiments? Our main contributions in this paper are a method for converting click models into click model-based offline metrics. Secondly, we present a thorough analysis and comparison of specific click model-based metrics with online measurements and traditional offline metrics. The rest of the paper is organized as follows. Section 2 presents related work. Section 3 shows how to transform a click model into a model-based offline metric. In Section 4 we examine click model-based and traditional offline metrics and report on their performance. We finish with a conclusion and discussion in Section 5.
2.
RELATED WORK
Determining and comparing the quality of information retrieval systems has always been an important task in IR, both in academic and industrial research. In recent years, competition between large commercial search systems has reached the point where even a small improvement can be of great importance. As a result, a broad range of metrics to assess system performance have been proposed: Discounted Cumulative Gain (DCG) by J¨ arvelin and Kek¨ al¨ ainen [26], Expected Reciprocal Rank (ERR) by Chapelle et al. [10], Expected Browsing Utility (EBU) by Yilmaz et al. [39], to name just a few. They have also been assessed from a variety of angles (see, e.g., [6, 10, 33]). Some IR metrics have an underlying user model (e.g., ERR, EBU) or they can be viewed as such (see [6]). However, there is still a big gap between user models and metrics. For example, some of the widely used click models, such as
the User Browsing Model (UBM) by Dupret and Piwowarski [19] and the Dependent Click Model (DCM) by Guo et al. [21], have so far not been used to develop an offline metric. Moreover, since the introduction of these early click models, many more click models have been developed, not only as improvements to previous models [20, 30], but also to address specific modeling issues, such as click models for diversified search [12, 14], the use of mouse movements along with clicks [24], or to model sessions [41]. We believe that all these models can be converted to evaluation measures. The creation of traditional test collections against reduced costs has received considerable attention. Carterette and Allan [7] and Sanderson and Joho [35] discuss approaches to building test sets for evaluation at low cost. Azzopardi et al. [3], Berendsen et al. [4] go a step further and describe methods for automatically generating test collections and training material for learning-based rankers, respectively. Other works have extensively examined one particular limitation of traditional test collections: the completeness of judgments [5, 34]. Buckley and Voorhees [5] introduce a new metric called bpref to use in a setup where we have missing relevance judgements. Sakai [34] propose an alternative solution that does not require a new metric. We will also consider this problem when analysing metrics. Apart from evaluation metrics, there are other interesting problems arising when dealing with large query sets; these are addressed by the TREC Million Query Track [2] and further studied by Carterette et al. [8]. Another important group of extremely related studies concerns user-based experiments. Introduced by Joachims [27], the interleaving method is now widely used. Since its introduction, several modifications to the original method have been proposed, notably Team-Draft Interleaving [32] and Probabilistic Interleaving [22]. A thorough overview of interleaving methods can be found in [11]. Radlinski and Craswell [31] analyze and compare the sensitivity of both interleaving and traditional offline IR metrics against each other. They find that the outcomes of interleaving experiments generally agree quite well with offline metrics while data can be collected at a much lower cost. Below, we apply the same type of analysis to evaluate click model-based metrics and to compare them against traditional IR metrics. Ali and Chang [1] show that per-query correlation between offline side-by-side comparisons and online interleaving experiments is low even when query filtering is applied. This finding suggests that aggregating results from multiple queries as was done in [31] is less noisy than computing correlations on a per query basis. Yue et al. [40] propose ways to increase the signal of an interleaving experiment; inspired by this idea we propose to tune offline metrics through two techniques referred to as condensation and thresholding below to enhance the agreement with interleaving (see Section 4.1).
3.
CLICK MODEL-BASED METRICS
From an initial focus on precision as a metric, the area of web search evaluation has evolved considerably. An early lesson is that we need to apply some sort of discount to the documents that appear lower in the ranking. One of the first metrics to operationalize this idea was Discounted Cumulative Gain (DCG) [26]. This metric is still widely used in the IR community. However, it has some drawbacks. One is that its discount function is not motivated by a user model. Another important issue with this metric is that it
is a static metric, i.e., its discount values are fixed numbers. As shown in [39], a dynamic metric that dynamically assigns different discount values according to the relevance of the documents appearing higher in the ranking, more accurately represents real user behavior. In this paper we introduce the notion of click model-based metrics. The main constituent of such a model-based metric is a click model —a probabilistic model aimed at predicting user clicks. Apart from click events (Ck ), a click model usually has hidden variables corresponding to events such as “the user examined the snippet of the k-th document” (Ek ). These hidden variables are often used to gain deeper insights into users’ behavior. For example, Chapelle and Zhang [9] used a click model (DBN) to predict relevance and train a ranking function and in [19] the parameters of the click model were analysed to explain how previous user clicks influence future clicks. All click models that we study in this paper assume that users click a document only after examining the document’s snippet, i.e., P pCk “ 1|Ek “ 0q “ 0. Following Carterette [6], we distinguish between utilitybased metrics and effort-based metrics. These give rise to two ways of mapping a click model to a click model-based offline metric. First, a utility-based metric uses a click model only to predict the click probability P pCk “ 1q for the k-th document in the ranking. This probability is then used to calculate the metric value as the expected utility: uM etric “
N ÿ
P pCk “ 1q ¨ Rk ,
(1)
k“1
where Rk is the relevance of the k-th document. It is common to use four or five relevance grades, from Irrelevant to Highly Relevant that are further mapped to numeric values. For example, the TREC 2011 Web Track [16] uses four levels of relevance: from 0 for Irrelevant documents to 3 for Highly Relevant documents. Second, an effort-based metric requires a click model to have a notion of “user satisfaction” (Sk ). A click model must have hidden variables Sk such that P pSk “ 1|Ck “ 0q “ 0 (the user can only be satisfied by the documents she clicked) and P pEj “ 1|Sk “ 1q “ 0 for j ą k (after being satisfied the user stops examining documents). Having this, we can define a metric to be an expected value of some effort function 1 at the stopping position: rrM etric “
N ÿ k“1
P pSk “ 1q ¨
N ÿ 1 1 “ sk P pCk “ 1q ¨ , (2) k k k“1
where sk “ P pSk “ 1|Ck “ 1q is a satisfaction probability. A click model is usually trained using a click log. As a result we get values of the model parameters that can further be used to calculate the probability of clicks or satisfaction events to use in Equations 1 and 2. Some of the parameters are just constants, some depend on the position(s) in the ranking and some depend on the document and/or query. Parameters of the last type are the hardest ones to be used in a metric, as we want our metric to work even for previously unseen documents. But, fortunately, parameters of this type can usually be approximated from the document’s
Table 1: Click model-based metrics and their underlying models. Previously proposed models/metrics are followed by the reference. Derived metric Underlying click model
Utility-based
Effort-based
DBN [9] DBN [9] DCM [21] UBM [19]
uSDBN [10] EBU [39] uDCM uUBM
ERR [10] rrDBN rrDCM –
relevance. In fact, when training a model we assume that these parameters only depend on the document relevance and not on the document itself. We will demonstrate this procedure for the attractiveness parameters in DBN, DCM, UBM and for the satisfaction parameters in DBN. If a model meets the requirements listed above, it can be transformed into a click model-based metric. There is no step-by-step algorithm for such a transformation but only general guidelines. In the following sections we demonstrate the idea, using well-known click models as an example. We want to stress, however, that our framework is general enough to be applied to other click models, including those that use additional sources of information, such as recently studied session-based click models [41] or click models for vertical search [12, 14]. In Table 1 we classify previously studied metrics (ERR by Chapelle et al. [10], EBU by Yilmaz et al. [39]) and propose several new click model-based metrics: rrDBN, uDCM, rrDCM, uUBM. The left most column lists click models, the center and right most column denote derived offline metrics, utility-based and effort-based, respectively. As a recipe for naming a metric, we use the name of the underlying model and prefix it with the type metric that we are defining: u- for utility-based and rr- for reciprocal rank effort-based metrics.
3.1
Previously Studied Metrics
In this section we show how two previously proposed metrics, ERR and EBU, can be viewed as click model-based metrics. Despite the fact that they are different and were not in fact proposed as derivatives of a click model, they can both be viewed as metrics based on special cases of the Dynamic Bayesian Network click model (DBN) by Chapelle et al. [10]. In this model, the user examines document captions one by one and may be attracted by document u with probability au . If the user is attracted by the document, she clicks it and becomes satisfied with probability su . If she is not satisfied by the document she proceeds to the next document with probability γ and stops otherwise. The Expected Reciprocal Rank (ERR) metric uses a simplified version of the DBN model [9] (we will refer to this model as SDBN) in which, as an additional constraint, all attractiveness probabilities are set to 1 (auk “ P pCk “ 1|Ek “ 1q ” 1) and therefore all documents are clicked. This leads to suk ” ruk , i.e., the satisfaction probability is equal to the probability of the document being relevant to the query. By making this assumption we obtain the probability of clicking the k-th document
1
Following [6] we use reciprocal rank k1 as an effort function. While we are not doing it here, it would be interesting to evaluate metrics with different effort functions.
P pCk “ 1q “ γ k´1
k´1 ź i“1
p1 ´ ri q
(3)
and the probability of satisfaction P pSk “ 1q “ rk γ k´1
k´1 ź
p1 ´ ri q,
(4)
i“1
where ri is the probability of relevance of the i-th document and γ is the continuation probability. The probability of being relevant is usually viewed as a mapping R Ñ r from the relevance grades to the segment r0, 1s. In the original ERR paper [10] the authors use a mapping motivated by R ´1 DCG: r “ 22Rmax , where Rmax is the maximum possible relevance grade (Rmax “ 3 in the case of TREC 2011 Web Track), but one may also fit this mapping from a click log. Using probabilities from (3) and (4), we end up with the ERR and uSDBN metrics (cf. Equations (2), (1)): ˜ ¸ k´1 N ÿ ź 1 k´1 ERR “ rk γ p1 ´ ri q ¨ k i“1 k“1 ˜ ¸ k´1 N ÿ ź k´1 uSDBN “ γ p1 ´ ri q ¨ rk k“1
i“1
In the original version of the ERR metric, the continuation probability γ of the DBN model was set to 1.2 Conversely, for uSDBN [10, Section 7.2], we set γ (“one minus the abandonment probability”) to 0.9, as suggested in [9]. The Expected Browsing Utility (EBU) metric by Yilmaz et al. [39] is also based on a variation of the DBN model. Unlike the original DBN model, their modification allows for different continuation probabilities in different situations (pcont|click , pcont|nonrel , pcont|rel ). While these parameters lead to greater flexibility in setting up the metric, they also represent a difficult choice for a practitioner to make. They were all set to 1 in the original paper [39] and here we do the same. By doing so we reduce the EBU model to DBN [9] with continuation probability γ “ 1. One notable difference between the ERR and EBU metrics is that EBU does not set the attractiveness probabilities to 1. Instead, the attractiveness probabilities and satisfaction probabilities are both estimated from a click log using the assumptions that they are determined by the document relevance: auk
« P pCk |Ruk q
suk
« P pLk |Ruk q,
where Ck is the random variable corresponding to a click on the k-th document, Lk is the random variable corresponding to leaving the result page after clicking the k-th document and Ruk is the relevance of the k-th document uk .
3.2
New Click Model-Based Metrics
In this section we propose new offline metrics by introducing an effort-based variant of the EBU metric and also by converting the two popular click models, UBM and DCM, into click model-based metrics. By doing so we show that our framework of click model-based metrics is not only a way of viewing previously studied metrics, but also a way of deriving new metrics in a principled way. The rrDBN metric uses essentially the same user model as the EBU metric. In fact, the parameters for EBU and 2
In the original paper [10, Section 3] an alternative interpretation of the ERR metric as a metric based on the Cascade Model by Craswell et al. [18] was also proposed.
rrDBN are the same. The only difference is that rrDBN is calculated using Equation (2) instead of (1). Next, the uDCM and rrDCM metrics can be derived from the Dependent Click Model (DCM, [21]) in a way similar to how EBU and rrDBN are derived from DBN. The only difference between DCM and DBN is that the satisfaction probability P pSk “ 1q depends not on the document itself but on its position k in a ranked list. Thus, the DCM model can be described with the following equations: P pCk “ 1|Ek “ 0q
“ 0
P pCk “ 1|Ek “ 1q
“ auk
P pSk “ 1|Ck “ 0q P pSk “ 1|Ck “ 1q
“ 0 “ sk
P pE1 “ 1q “ 1 P pEk`1 “ 1|Ek “ 0q “ 0 P pEk`1 “ 1|Ek “ 1, Sk q
“ 1 ´ Sk
As was shown by Turpin et al. [37], the attractiveness of a document’s snippet can be approximated as a function of its relevance grade. A mapping from grades to attractiveness probabilities can be inferred from a click log using the click model (DCM in this case). 3 For this purpose we impose the constraint that documents with the same relevance have the same attractiveness, i.e., the attractiveness of a document is a function of its relevance grade: au “ apRu q. Finally, using the click model and Equations (1), (2), we can define uDCM and rrDCM metrics as follows: uDCM
N ÿ
“ k“1
rrDCM
N ÿ
“ k“1
apRk q
k´1 ź
p1 ´ apRi qsi q ¨ Rk
i“1
sk apRk q
k´1 ź i“1
p1 ´ apRi qsi q ¨
1 k
Chen et al. [12] report that the User Browsing Model (UBM) [19] performs better than DBN in terms of click prediction perplexity. We have also evaluated this model using a Yandex click log. We used a sample of clicks collected in November 2012. We then removed pages without clicks and split the remaining data into training and test set. In total we had 1,191,963 training and 1,292,993 test pages. To compare the models we used the perplexity gain [12, Section 5.2] which is a standard way of comparing perplexity values (see, e.g., [12, 20, 41]). On our data UBM outperforms DBN by 16% which is considered a big difference. This finding motivates the idea of deriving an offline metric from UBM. In the UBM model the click probability is governed by the attraction bias and the examination bias: P pC “ 1|u, q, r, dq “ P pA “ 1|u, qqP pE “ 1|d, rq “ auq γrd , where C stands for click, A for attraction, E for examination; u is the document URL, q is the user query, r is the document rank (position), and d “ r´maxtj ă r|Cj “ 1u is the distance to the previous click.4 For convenience, we write ar instead of auq and γr pjq instead of γrd , where d “ r ´ j. Like for the EBU/rrDBN and uDCM/rrDCM metrics, we assume that the attractiveness probability a is a function of 3 The source code for probabilistic inference is freely available at https://github.com/varepsilon/clickmodels. 4 As in [19] we use a virtual zero position (which is always clicked) to simplify our equations.
the relevance of the document: auq “ apRuq q. The examination probabilities γr pjq can be precomputed from click logs during the same model training process. One important difference from the previously studied models is that the UBM model relies on previous clicks and these are not available offline. To deal with this problem we factorize the probability P pCr “ 1q over the position of previous clicks j: P pCr “ 1q “
r´1 ÿ
P pCj “ 1, Cj`1 “ 0, . . . , Cr´1 “ 0, Cr “ 1q.
j“0
By applying Bayes rule we get P pCr “ 1q “
r´1 ÿ
P pCj “ 1q
j“0 r´1 ź
P pCk “ 0|Cj “ 1, Cj`1 “ 0, . . . , Ck´1 “ 0q
¨ k“j`1
¨ P pCr “ 1|Cj “ 1, Cj`1 “ 0, . . . , Cr´1 “ 0q “ ˜ ¸ r´1 r´1 ÿ ź “ P pCj “ 1q p1 ´ ak γk pjqq ar γr pjq j“0
k“j`1
Finally, the click probability is given by a recursive formula: P pC0 “ 1q P pCr “ 1q
“ 1 ˜ ¸ r´1 r´1 ÿ ź “ P pCj “ 1q p1 ´ ak γk pjqq ar γr pjq j“0
k“j`1
where ar “ apRr q, and ap¨q and γr p¨q are known functions estimated from clicks. It is important to note, that unlike Dupret and Piwowarski [19], we used all queries, not only queries with high clickthrough rate. So our resulting γ function is different from that analysed by Dupret and Piwowarski, and might be interesting on its own. For example, γr pjq is much less than 1 for j ą 0 which corresponds to the fact that most of the users click on only one document. Given the click probability we can define the metric: uU BM “
N ÿ
P pCr “ 1q ¨ Rr
(5)
r“1
The UBM click model does not have a notion of user satisfaction and hence we do not introduce an “rrUBM” metric.
4.
ANALYSIS
In this section we analyze the click model-based metrics previously listed, both old and new, along a number of dimensions. We compare click model-based metrics to traditional offline metrics. As traditional metrics we consider precision, with two possible binarizations of four scale judgments (Precision treats the highest three relevance grades (3, 2, 1) as “relevant,” while Precision2 only treats the highest two relevance grades (3, 2) as “relevant”) as well as DCG. As was shown by Chapelle et al. [10], the NDCG metric is always worse at capturing user satisfaction than DCG. We decided not to include this metric and thus to overcome potential issues with corpus-dependent NDCG normalization. We start by determining correlations of various offline metrics to the outcomes of interleaving experiments in a way proposed by Radlinski and Craswell [31]. These correlations are then used to compare offline metrics to each other. The metric that shows the best correlation with interleaving out-
comes is assumed to better represent real user behavior. We then move to more traditional comparison techniques, such as metric-to-metric correlations and discriminative power.
4.1
Correlation with Interleaving Outcomes
As was shown by Radlinski et al. [32], absolute click metrics are often unable to determine differences in IR systems. Moreover, they are always difficult to interpret and may even be misleading, because we cannot know for sure how these metrics are related to user satisfaction. Fortunately, there is another approach, the pairwise or interleaved comparison techniques mentioned earlier [27, 32]. Following this approach, we compare two ranking systems by presenting a user with an interleaved result page, containing documents from both result lists. The winner is then determined from user clicks. We assess an offline IR metric m in terms of its agreement with the interleaving outcomes. Specifically, we use the Team-Draft Interleaving (TDI) method by Radlinski et al. [32]. In this method each document in the interleaved page is assigned to exactly one of the two ranking systems (“the teams”). We then say that a system wins a comparison if the documents it contributes to the combined list receive more clicks. The system that wins most of the comparisons is assumed to be better. For the current experiment we used a click log of the Yandex search engine collected in October–December 2012. During this period we focus on five revisions of the core ranking functions (A, B, C, D, E), with each revision being compared to the previous one using TDI, that was run for 5-10 days. For each of our ten experiments we had at least 200,000 impressions as in the work by Radlinski and Craswell [31]. Some ranking function revisions influence more than one market (country), so in total we have 10 pairs of algorithms to compare: ∆1 AB, ∆2 AB, ∆1 BC, ∆1 CD, ∆2 CD, ∆3 CD, ∆4 CD, ∆1 DE, ∆2 DE, ∆3 DE. For each algorithm pair we recorded the interleaving signal value, i.e., the deviation from 50% of the number of cases where the newer system was preferred. For instance, if in the experiment labeled ∆i XY system Y was preferred over system X in 51% of all cases, we say that the interleaving signal for the experiment is 1%. Having interleaving signals, we want to compare them to the signals obtained by the offline IR measures, i.e., the average difference of the metric values. Unlike in the traditional Cranfield approach we use queries and documents from the query log. When computing an offline metric signal for a particular experiment ∆i XY , we extract queries issued by the users assigned to the experimental flight. For these queries we also extract the document lists that would have been produced by each of the systems X and Y if they had not been interleaved. By using click-log-based queries when comparing the signal of an offline metric to the interleaving signal we eliminate the effect induced by the choice of a query set that one needs to compile for a Cranfield-style evaluation. Here it also allows us to perform experiments with historical revisions of a ranking algorithm that is no longer running. Although this approach has some advantages for our research problem, it has some disadvantages for everyday usage. One notable drawback is that we use only part of the judgements available because not all the queries that we have judgements for were submitted by the users of the experimental flight. For each experiment and each metric we keep only the queries that have at least one
Simple Metrics
1.0 0.8
Precision Precision2 DCG uSDBN ERR EBU rrDBN uDCM rrDCM uUBM
correlation
0.6 0.4 0.2 0.0 0.2 0.4 0
1
2
3
4
5
6
#unjudged
7
8
9
10
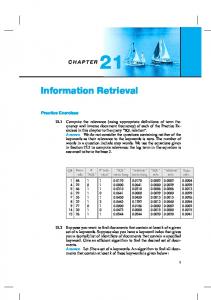
Figure 1: Pearson correlation between offline metrics and interleaving signal. Unjudged documents were treated as irrelevant.
Condensed Metrics
1.0 0.8
Precision Precision2 DCG uSDBN ERR EBU rrDBN uDCM rrDCM uUBM
correlation
0.6 0.4 0.2 0.0 0.2 0.4 0
1
2
3
4
5
6
#unjudged
7
8
9
10
Figure 2: Pearson correlation between offline metrics and interleaving signal. Unjudged documents were skipped (ranked lists were condensed).
Thresholded Metrics
1.0 0.8
Precision Precision2 DCG uSDBN ERR EBU rrDBN uDCM rrDCM uUBM
0.6
correlation
document judged. Depending on the experiment we have from 178 to 5,815 queries per experiment (median 573). As shown in [31], it is usually sufficient to have approximately 100 queries to identify the better system in an offline comparison. The amount of data available to the search engine is usually much larger than a human can handle. Even more important is the fact that the web corpus is constantly changing, so we cannot maintain complete judgements even for a limited set of queries. That is why it seems natural that some documents returned by the system do not have relevance judgements. In order to analyse the tradeoff between adding noise from unjudged documents and reducing the noise by allowing more queries we introduce a parameter #unjudged. We discard queries for which the number of unjudged documents in the top 10 is bigger than this value for either of the two systems taking part in a TDI experiment. Below, we vary this bound and see how it influences the correlation between offline metrics and interleaving. For each offline metric m and each value of #unjudged from 1 to 9 we compute the weighted Pearson correlation (similar to [10]) between the metric signal and the interleaving signal. As a weight we use the number of queries participating in the calculation of the metric signal (this number is different for each experiment). The results are presented in Figure 1. We can see that the effort-based metrics rrDBN and rrDCM are better at dealing with unjudged documents and are remarkably different from their utility-based counterparts; we will confirm this difference in Section 4.3. Another interesting observation can be made about the Precision and Precision2 metrics. Their behavior differs and, moreover, Precision has a negative correlation and this is not the case for Precision2. This seems to be due to the fact that unjudged documents are treated in the same way as the lowest relevance grade 0, whereas in fact they have a higher chance to belong to one of the top relevance grades: 92% of the documents in the top 10 have a relevance grade higher than 0, while only 23% have a relevance grade higher than 1. As we can see from Figure 1, when we increase #unjudged, the maximum number of unjudged documents, to 4 or higher, the correlation drops for all of the metrics studied. This means that adding queries with highly incomplete judgements adds noise to the metric signals. The problem of unjudged documents has previously been studied by Sakai [34], and his proposed solution is to exclude unjudged documents from the ranked list and condense the remaining documents. Despite its heuristic nature, this idea actually leads to an increase in correlation for most of the metrics as shown in Figure 2. The exceptions from this rule are rrDBN and rrDCM that supposedly suffer most from the incorrect effort function values. For example, if we miss a judgement for the first document than for the second document we apply a 11 discount instead of 12 (see Equation (2)).
0.4 0.2 0.0 0.2
Thresholds Even when we apply condensation, we still have a decrease in correlation values for high values of #unjudged. One way of dealing with this problem is to choose an optimal value of #unjudged and use it to get high correlations with interleaving outcomes. We propose a different way of dealing with this noisy data. Comparing systems A and B, we discard all queries with differences in metric values less than a
0.4 0
1
2
3
4
5
6
#unjudged
7
8
9
10
Figure 3: Pearson correlation between offline metrics with thresholds and interleaving signal. Unjudged documents were treated as irrelevant.
Thresholded Condensed Metrics
1.0 0.8
correlation
0.4 0.2 0.0 0.2
0.8 0.6
correlation
Precision Precision2 DCG uSDBN ERR EBU rrDBN uDCM rrDCM uUBM
0.6
0.4 0.2
0.4 0
1
2
3
4
5
6
#unjudged
7
8
uUBM
1.0
9
0.00
10
Figure 4: Pearson correlation between offline metrics with thresholds and interleaving signal. Unjudged documents were skipped (ranked lists were condensed).
threshold δm for each metric m: ÿ 1 pmpB, qq ´ mpA, qqq , MetricSignal “ |Qδm | qPQ δm
where Qδm “ tq P Q | |mpB, qq ´ mpA, qq| ě δm u. This means that we use only some portion of the queries we have (up to 20%), but these are queries that strongly distinguish between systems. The idea is that by choosing an appropriate threshold δm we can tune a ranking system to produce the best correlation with interleaving outcomes. In order to test the idea we split our data (ten TDI experiments) into train and test set: we use the train set to choose the best threshold and the test set to compute the correlation scores. While it would be natural to do a time-based train/test split, it appeared to be impractical with the data we have. Firstly, it was impossible to get training and test sets of reasonable sizes (either the training or the test set would consist of only 3 experiments which might give too noisy correlation values). Secondly, there are only few possible time-based splits so we are not able to assess statistical significance of the results. Instead, we used all possible 5/5 splits for our experiments, i.e., we take a subset of five experiments as a training set and the remaining five experiments as a test 5 set. In total we had C10 “ 252 splits and corresponding correlation values. The correlation values were then averaged and error bars were computed using the bootstrap test at 95% confidence level and 1000 samples. Results are shown in Figures 3 and 4. We can see in Figures 3 and 4 that the confidence intervals are quite narrow and most of the click model-based metrics continue to show high correlation scores when the value #unjudged is large. If we look at one of the best performing metrics, uUBM, we can see that thresholded variants are a bit worse for #unjudged lower than 5, while for #unjudged equal to 5 and higher the thresholded variants start dominating, reaching the highest point for #unjudged “ 9 (see Figure 5). In order to test significance of the differences in correlation values we used the 5/5 split procedure described above. Unlike what we did for thresholded and thresholded condensed, for the simple and condensed variants we only use the test
simple condensed 1
2
thresholded thresholded condensed 3
4
5
#unjudged
6
7
8
9
10
Figure 5: Pearson correlation between uUBM (in different variants) and interleaving signal . set to determine the correlation and just ignored the training set as there is nothing we need to tune. The correlation values are then averaged and confidence intervals are computed using the bootstrap method with 1000 samples and 95% confidence level. Three highest correlation scores were shown by thresholded condensed variant of uUBM metric (for different values of #unjudged), while the correlation score for thresholded condensed uUBM (#unjudged = 9) is significantly higher than any other variant (simple, condensed, thresholded ) of any metric. From Figures 1–4 we can also conclude that click model-based metrics in general show higher correlation values with the outcomes of interleaving experiments than traditional offline metrics, especially when we have many incomplete judgements (#unjudged ą 5), which confirms the hypothesis formulated in the Introduction: click model-based metrics are better correlated with online measurements than traditional metrics. Another interesting observation is that for the simple and condensed variants there exist optimal values of the #unjudged parameter (3 and 5 respectively in our case). Conversely, for the thresholded and thresholded condensed variants it is more important to pick an appropriate metric and then use any value of #unjudged higher than 5.
4.2
Correlation with Absolute Online Metrics
Following the original work on ERR by Chapelle et al. [10] we also compared offline IR metrics by looking at their correlation with absolute click metrics. In our experiments we used the following metrics: ‚ MaxRR, MinRR, MeanRR – maximal, minimal, mean reciprocal ranks of the click. Following the work of Radlinski et al. [32] we exclude pages with no clicks to avoid correlation with UCTR. ‚ UCTR – binary value representing click (the opposite of abandonment). ‚ PLC – number of clicks divided by the position of the lowest click. We did not include the Search Success (SS) metric considered by Chapelle et al. [10] as it uses relevances not only clicks. We also confirmed the findings of [10] that QCTR (clicks per session) has negative or close to zero correlation with all the editorial metrics and skipped it as well.
A configuration is a tuple that consists of a query and ten URLs of the top ranked documents presented to a user. For each configuration in our dataset we computed the values of absolute online and offline metrics. The vectors of these metric values are then used to compute Pearson correlation (unweighted). For our dataset we used clicks collected during a three-month period in 2012. Because we used a long period and hence had a sufficient amount of data, we were able to collect 12,155 configurations (corresponding to 411 unique queries) where all ten documents have relevance judgements. The results are summarized in Table 2. A similar comparison was previously done by Chapelle et al. [10] for ERR and traditional offline metrics. The numbers they obtained are similar to ours. From the table we conclude that click model-based metrics show relatively high correlation scores while traditional offline metrics like DCG or Precision generally have lower correlations, which agrees with the results of the previous section. Using the bootstrap test (95% significance level, 1000 bootstrap samples) we confirmed that all the click model-based metrics show significantly higher correlation with all the online metrics than any of the traditional offline metrics. As to the online metrics, we can see that the reciprocal rank family (MaxRR, MinRR, MeanRR) appears to be better correlated with the effort-based metrics (ERR, rrDBN, rrDCM), because the effort function used by these metrics is the reciprocal rank k1 (see Equation 2). The same holds for PLC as it uses reciprocal rank of the lowest click that could be viewed as “satisfaction position” used by an effortbased metric. The differences between ERR and uSDBN, rrDBN and EBU, rrDCM and uDCM are statistically significant (using the same bootstrap test). Conversely, for the UCTR metric all the utility-based metrics show significantly higher correlation than corresponding effort-based metrics. We also compared newly introduced click model-based metrics with older metrics: ERR (effort-based) and EBU (utility-based). The result of the comparison is marked as superscripts in the Table 2: the first superscript corresponds to ERR, the second one corresponds to EBU. The first (second) IJ means that the metric is statistically significantly higher than ERR (EBU), İ — significantly lower, “´” — no statistical difference can be found (95% signifi-
Table 2: Pearson correlation between offline and absolute online metrics. Superscripts represent statistically significant difference from ERR and EBU. -RR MaxPrecision ´0.117 Precision2 0.026 DCG 0.178 ERR EBU rrDBN rrDCM uSDBN uDCM uUBM
0.378 0.374 0.384IJIJ 0.387IJIJ 0.322İİ 0.374İİ 0.377´IJ
Min-
Mean-
´0.163 ´0.155 0.093 0.075 0.243 0.237 0.471 0.467 0.475IJIJ 0.478IJIJ 0.412İİ 0.466İİ 0.469İIJ
0.469 0.464 0.473IJIJ 0.476IJIJ 0.407İİ 0.463İİ 0.467İIJ
UCTR 0.042 0.092 0.163 0.199 0.198 0.194İİ 0.194İİ 0.206IJIJ 0.198´´ 0.198´´
PLC ´0.027 0.094 0.245 0.399 0.397 0.399´IJ 0.400´IJ 0.370İİ 0.396İİ 0.398´IJ
cance level, bootstrap test). As we see, in most cases our new click metrics appear to be significantly better than the previously known ERR and EBU metrics, expect for UCTR measure, which does not account for clicks (rather for their absence) and hence obviously lacks the source of correlation with click-model based metrics. According to other metrics, rrDBN and rrDCM are better than ERR in 3 of 4 cases and better than EBU in all 4 cases, while uUBM is better than EBU in 4 of 4 cases. In general, all the absolute click metrics are poorly correlated with offline metrics—the correlation values are much lower than correlation with interleaving outcomes. As was shown by Radlinski et al. [32], absolute click metrics are worse at capturing user satisfaction than interleaving. That is why we propose to use the results of Section 4.1 as the main way to compare offline metrics with user behavior.
4.3
Correlation Between Offline Metrics
In order to compare offline metrics to each other in terms of ranking IR systems we used data from the TREC 2011 Web Track [16]. Participants of the TREC competition were offered a set of queries (“topics” in TREC parlance) and a set of documents for each query to rank. Each document was judged using a 4-grade scale.5 For each metric we can build a list of system runs6 ordered by the metric value averaged over queries. We then compute Kendall tau correlation scores between these ordered lists; they are summarized in Table 3. As was shown by Voorhees [38], metrics with correlation scores around 0.9 can be treated as very similar because this is the level of correlation one achieves when using the same metric but different judges. This level of correlation to distinguish equivalent metrics was also used in subsequent papers, for example [5, 7, 35, 37]. In Table 3 such metric pairs are marked in boldface. We see that all click model-based metrics are highly correlated within their group, utility-based or effort-based, while correlations of the two metrics based on the same model (uSDBN and ERR, EBU and rrDBN, uDCM and rrDCM) are lower.
4.4
Discriminative Power
Another measure frequently used for comparing metrics is the discriminative power by Sakai [33]. This measure is a bit controversial, because high values of discriminative power do not imply a good metric. Nevertheless, extremely low values of discriminative power can serve as an indication of a metric’s poor ability to distinguish different rankings. As was shown in previous work (e.g., [15, 36]) discriminative power is highly consistent with respect to statistical test choice. Given this fact we focus on a bootstrap test as it makes fewer assumptions about the underlying distribution. Results based on the same TREC 2011 Web Track data as used in the previous section are summarized in Table 4. As expected, highly correlated metric pairs (e.g., (rrDBN, rrDCM) and (EBU, uDCM)) have similar discriminative power. Another observation to be made is that the effort-based metrics ERR, rrDBN and rrDCM have a lower discriminative power than the utility-based metrics uSDBN, EBU and 5 Initially, a 5-grade scale was listed on a TREC 2011 description page, but in the end a 4-grade scale was used for evaluation. As in the trec_eval evaluation tool we do not distinguish between Irrelevant and Spam documents. 6 In total we have 62 runs submitted by 16 teams.
Table 3: Correlation between offline metrics (using the TREC 2011 runs). Values higher than 0.9 are marked in boldface. Precision2
DCG
ERR
uSDBN
EBU
rrDBN
uDCM
rrDCM
uUBM
Precision Precision2 DCG
0.649 – –
0.841 0.785 –
0.597 0.663 0.740
0.730 0.780 0.857
0.568 0.675 0.711
0.397 0.526 0.530
0.562 0.693 0.704
0.442 0.551 0.592
0.537 0.681 0.685
ERR uSDBN EBU rrDBN uDCM rrDCM
– – – – – –
– – – – – –
– – – – – –
0.807 – – – – –
0.919 0.792 – – – –
0.754 0.585 0.788 – – –
0.902 0.794 0.970 0.786 – –
0.826 0.638 0.822 0.917 0.813 –
0.888 0.754 0.930 0.807 0.947 0.841
Table 4: Discriminative power of different metrics according to the bootstrap test (confidence level 95%). Metric
Discriminative Power
Precision Precision2 DCG
50.1 % 30.8 % 48.6 %
ERR uSDBN EBU rrDBN uDCM rrDCM uUBM
39.3 51.1 35.1 21.1 34.7 26.0 33.3
% % % % % % %
uDCM, respectively. This is probably due to the fact that “position discount” for the effort-based metrics goes to zero faster than for the utility-based metrics and hence they are less sensitive to changes in the bottom of the ranked list.
5.
CONCLUSION AND FUTURE WORK
In this paper we proposed a framework of click modelbased metrics to build an offline evaluation measure on top of any click model. Answering the research questions outlined in the introduction we can say that ‚ Click model-based metrics generally differ from traditional offline metrics, while they are quite similar to each other. Moreover, utility-based metrics are significantly different from effort-based metrics in terms of system ranking. ‚ All click model-based metrics generally show high agreement with the outcomes of online interleaving experiments and relatively high agreement with absolute click measures. However, correlation with absolute metrics is low for all offline metrics (both traditional and click model-based) compared to the correlation with interleaving outcomes. ‚ Unjudged documents may decrease correlation with interleaving outcomes but by using thresholds we can overcome this issue for click model-based metrics. ‚ Condensation and thresholding of offline metrics are effective ways of stabilizing correlations with interleaving outcomes in the presence of unjudged documents. One natural extension of our framework of click model-based
metrics can be adding more signals from the assessors. For example, we can ask assessors to judge not only documents, but their snippets as well (a practice already in place at commercial search engines). By using this we can drop the assumption that snippet attractiveness is a function of document relevance as was assumed by the click model-based metrics. While attractiveness is highly correlated with document relevance [37], it is essential to use real attractiveness judgements when we need to evaluate a snippet algorithm, not only ranking. It might be interesting to incorporate attractiveness judgements into metrics and re-evaluate our click model-based metrics using proposed modifications. Another interesting direction is the area of good abandonments. Li et al. [29] report that some snippets might be good enough to answer the user query directly on a search engine result page. As was shown in [13], one can ask human judges to indicate whether a snippet contains an answer to the user query (fully or partially). That task appeared to be relatively easy for assessors. Given such judgements, one can modify any evaluation metric by adding additional gain from the snippets that contain an answer to the user’s information need. To convert this into a metric, we assign some gain to the documents that were clicked (Ck “ 1) and some gain to the documents that were only examined, but did not attract the user (Ei “ 1, Ak “ 0). Adapting click models for the unjudged/unknown documents is also an interesting direction. For example, we could modify a click model by adding probability of a document being skipped because it is unjudged. This question requires further investigation and we leave it as future work. In our work we argued that offline metrics should be better correlated with interleaving outcomes. However, we might want to have a metric that correlates with user satisfaction. Some steps towards this problem have been taken in early work by Huffman and Hochster [25] where user studies were performed to analyse the meaning of editorial relevance for real users. It would be interesting to perform a study of this type to compare offline metrics.
Acknowledgements We would like to thank Katja Hofmann, Maria-Hendrike Peetz and our anonymous reviewers for reading the paper and making useful comments and suggestions. This research was partially supported by the European Community’s Seventh Framework Programme (FP7/20072013) under grant agreements nr 258191 (PROMISE Network of Excellence) and 288024 (LiMoSINe project), the Netherlands Organisation for Scientific Research (NWO) un-
der project nrs 640.004.802, 727.011.005, 612.001.116, HOR11-10, the Center for Creation, Content and Technology (CCCT), the BILAND project funded by the CLARIN-nl program, the Dutch national program COMMIT, the ESF Research Network Program ELIAS, the Elite Network Shifts project funded by the Royal Dutch Academy of Sciences (KNAW), and the Netherlands eScience Center under project number 027.012.105.
REFERENCES [1] K. Ali and C. Chang. On the relationship between click-rate and relevance for search engines. WIT Trans. on Inform. and Comm. Technol., 1, June 2006. [2] J. Allan, B. Carterette, J. Aslam, and V. Pavlu. Million Query Track 2007 Overview. Technical report, DTIC Document, 2007. [3] L. Azzopardi, M. de Rijke, and K. Balog. Building simulated queries for known-item topics: an analysis using six european languages. In SIGIR, 2007. [4] R. Berendsen, E. Tsagkias, M. de Rijke, and E. Meij. Generating pseudo test collections for learning to rank scientific articles. In CLEF, 2012. [5] C. Buckley and E. M. Voorhees. Retrieval evaluation with incomplete information. In SIGIR, 2004. [6] B. Carterette. System effectiveness, user models, and user utility: a conceptual framework for investigation. In SIGIR, 2011. [7] B. Carterette and J. Allan. Incremental test collections. In CIKM, 2005. [8] B. Carterette, V. Pavlu, and E. Kanoulas. If I had a million queries. In Advances in Information Retrieval, 2009. [9] O. Chapelle and Y. Zhang. A dynamic bayesian network click model for web search ranking. In WWW. ACM, 2009. [10] O. Chapelle, D. Metzler, Y. Zhang, and P. Grinspan. Expected reciprocal rank for graded relevance. In CIKM. ACM, 2009. [11] O. Chapelle, T. Joachims, F. Radlinski, and Y. Yue. Large-scale validation and analysis of interleaved search evaluation. ACM Trans. Inform. Systems, 2012. [12] D. Chen, W. Chen, and H. Wang. Beyond ten blue links: enabling user click modeling in federated web search. In WSDM. ACM, 2012. [13] A. Chuklin and P. Serdyukov. Good abandonments in factoid queries. In WWW, 2012. [14] A. Chuklin, P. Serdyukov, and M. de Rijke. Using Intent Information to Model User Behavior in Diversified Search. In ECIR, 2013. [15] C. L. A. Clarke, N. Craswell, and I. Soboroff. A comparative analysis of cascade measures for novelty and diversity. In WSDM. ACM, 2011. [16] C. L. A. Clarke, N. Craswell, I. Soboroff, and E. M. Voorhees. Overview of the TREC 2011 Web Track. In TREC 2011. NIST, 2012. [17] C. W. Cleverdon, J. Mills, and M. Keen. Factors determining the performance of indexing systems. In ASLIB Cranfield project. 1966. [18] N. Craswell, O. Zoeter, M. Taylor, and B. Ramsey. An experimental comparison of click position-bias models. In WSDM. ACM, 2008.
[19] G. Dupret and B. Piwowarski. A user browsing model to predict search engine click data from past observations. In SIGIR. ACM, 2008. [20] F. Guo, C. Liu, A. Kannan, T. Minka, M. Taylor, Y.-M. Wang, and C. Faloutsos. Click chain model in web search. In WWW. ACM, 2009. [21] F. Guo, C. Liu, and Y. Wang. Efficient multiple-click models in web search. In WSDM. ACM, 2009. [22] K. Hofmann, S. Whiteson, and M. de Rijke. A probabilistic method for inferring preferences from clicks. In CIKM. ACM, 2011. [23] K. Hofmann, A. Schuth, S. Whiteson, and M. de Rijke. Reusing Historical Interaction Data for Faster Online Learning to Rank for IR. In WSDM, 2013. [24] J. Huang, R. W. White, G. Buscher, and K. Wang. Improving searcher models using mouse cursor activity. In SIGIR. ACM, 2012. [25] S. B. Huffman and M. Hochster. How well does result relevance predict session satisfaction? In SIGIR, 2007. [26] K. J¨ arvelin and J. Kek¨ al¨ ainen. Cumulated gain-based evaluation of IR techniques. ACM Trans. Inform. Systems, 20(4), 2002. [27] T. Joachims. Optimizing search engines using clickthrough data. In KDD. ACM, 2002. [28] R. Kohavi, R. Longbotham, D. Sommerfield, and R. M. Henne. Controlled experiments on the web: survey and practical guide. Data Mining and Knowledge Discovery, 18(1), July 2008. [29] J. Li, S. Huffman, and A. Tokuda. Good abandonment in mobile and PC internet search. In SIGIR, 2009. [30] C. Liu, F. Guo, and C. Faloutsos. BBM. In KDD. ACM, June 2009. [31] F. Radlinski and N. Craswell. Comparing the sensitivity of information retrieval metrics. In SIGIR. ACM, 2010. [32] F. Radlinski, M. Kurup, and T. Joachims. How does clickthrough data reflect retrieval quality? In CIKM’08. ACM, 2008. [33] T. Sakai. Evaluating evaluation metrics based on the bootstrap. In SIGIR, 2006. [34] T. Sakai. Alternatives to Bpref. In SIGIR. ACM, 2007. [35] M. Sanderson and H. Joho. Forming test collections with no system pooling. In SIGIR, 2004. [36] M. D. Smucker and C. L. A. Clarke. Time-Based Calibration of Effectiveness Measures. In SIGIR, 2012. [37] A. Turpin, F. Scholer, K. Jarvelin, M. Wu, and J. S. Culpepper. Including summaries in system evaluation. In SIGIR, 2009. [38] E. M. Voorhees. Variations in relevance judgments and the measurement of retrieval effectiveness. Information processing & management, 36, 2000. [39] E. Yilmaz, M. Shokouhi, N. Craswell, and S. Robertson. Expected browsing utility for web search evaluation. In CIKM. ACM, 2010. [40] Y. Yue, Y. Gao, O. Chapelle, Y. Zhang, and T. Joachims. Learning more powerful test statistics for click-based retrieval evaluation. In SIGIR, 2010. [41] Y. Zhang, W. Chen, D. Wang, and Q. Yang. User-click modeling for understanding and predicting search-behavior. In KDD. ACM, 2011.