Agricultural and Forest Entomology (2010), 12, 213–221
DOI: 10.1111/j.1461-9563.2009.00464.x
Climate change scenarios and models yield conflicting predictions about the future risk of an invasive species in North America Anna M. Mika and Jonathan A. Newman1 School of Environmental Sciences, University of Guelph, Guelph, Ontario N1G 2W1, Canada
Abstract
1 The pea leafminer Liriomyza huidobrensis (Blanchard) (Diptera: Agromyzidae) is an invasive species in North America and a serious economic pest on a wide variety of crops. We developed a bioclimatic envelope model (BEM) for this species and examined the envelope’s potential location in North America under various future climates. 2 We compared the future bioclimatic envelopes for L. huidobrensis using either simple scenarios comprising uniform changes in temperature/precipitation or climate projections from general circulation models (GCMs). Our simple scenarios were: (i) an increase of 0.1◦ C per degree in latitude with a 20% increase in summer precipitation and a 20% decrease in winter precipitation and (ii) an overall increase of 3◦ C everywhere, also with the same changes in precipitation. For GCMmodelled climate change, we used the Canadian Centre for Climate Modelling and Analysis GCM (CGCM2) and the Hadley Centre climate model (HadCM3), each in combination with two scenarios from the Special Report on Emissions Scenarios (A2 and B2). 3 The BEM results using the simple scenarios were more similar to each other than to the results obtained using GCM projections. The results were also qualitatively different (i.e. spatially different and divergent) depending on which GCM-scenario combination was used. 4 This modelling exercise illustrates that: (i) results using first approximation simple climate change scenarios can give predictions very different from those that use GCM-modelled climate projections (comprising a result that has worrying implications for empirical impact research) and that (ii) different GCM-models using the same scenario can give very different results (implying strong model dependency in projected biological impacts). Keywords Bioclimatic envelope model, climate change, CLIMEX, Liriomyza huidobrensis pea leafminer.
Introduction The present study had three different objectives. The first objective was to infer spatial changes, related to climate change, in the areas ‘at risk’ of pea leafminer Liriomyza huidobrensis (Blanchard) (Diptera: Agromyzidae) infestation. It was expected that future climate might be more favourable Correspondence: Jonathan A. Newman. Tel: +1 519 824 4120; fax: +1 519 837 0442; e-mail:
[email protected] 1 Present address: The University of Vermont, The Rubenstein School of Environment and Natural Resources, George D. Aiken Center, 81 Carrigan Drive, Burlington, VT 05405-0088, U.S.A. © 2010 The Authors
Journal compilation © 2010 The Royal Entomological Society
than ‘contemporary climate’ for this pest species because its historic distribution has been in a warmer climate than that currently found in most parts of North America. Particularly, it was expected that the northern extent of its current distribution would become more favourable and that, consequently, there would be a greater area at risk in future climates. Second, the study aimed to quantify the differences between the areas at risk that result from the use of two different climate models used to generate the climate projections. For the same set of forcing variables (i.e. climate scenarios), it was expected that these two general circulation models (GCMs) would project similar values of the climate variables and that the differences between
214 A. M. Mika and J. A. Newman the model projections would translate into small differences in the areas at risk from this pest species. Third, the study aimed to compare the areas at risk that result from these climate change projections with those that result from uniform changes in temperature. Such an approach is commonly taken in both experiments and modelling exercises. It was expected that the areas at risk resulting from the uniform changes in temperature would be good approximations to those generated using the more comprehensive GCM projections.
The pea leafminer The pea leafminer is a generalist herbivore, feeding on 14 families of plants, and is a serious pest on agricultural crops (Martin et al ., 2005). Some North American crops that are affected by L. huidobrensis include: lettuce (Lactuca sativa L.); spinach (Spinacia oleracea L.); celery (Apium graveolens L.); Asian crucifers (Brassica spp.); greenhouse ornamentals; greenhouse cucumbers (Cucumis sativus L.); and onions (Allium cepa L.) (Martin et al ., 2005). It was first reported as an agricultural pest in Brazil in approximately 1926 (Martin, 2003) from where it spread to other regions of South and Central America, as well as to California and Hawaii (Spencer, 1973). It was confined to these regions until the 1980s, from where it was introduced to other parts of the world, including Europe, Israel, Indonesia, Sri Lanka, China, and Canada (McDonald et al ., 2000; Scheffer, 2000; Zhao & Kang, 2000). In 2001, Scheffer et al . (2001) showed that what has been classified as L. huidobrensis actually comprises two cryptic species: one that is found in California and Hawaii (Liriomyza langei ); and the other in the rest of the world (L. huidobrensis). There is also a third closely-related species, Liriomyza bryoniae (Scheffer et al ., 2001), which can be identified using morphological characters (Spencer, 1973). Although unproven (Zhao & Kang, 2000), it is currently considered that L. huidobrensis survives cold winters in some parts of North America by overwintering in greenhouses and recolonizing the fields the subsequent growing season (Martin et al ., 2005). However, climate change may result in more favourable conditions for L. huidobrensis, which may then be able to overwinter and spread further north, becoming a major agricultural pest. Many species have already been observed to shift their distributions in response to changing climate, including butterflies on various continents (Hill et al ., 1999; Parmesan et al ., 1999; Beaumont & Hughes, 2002; Parmesan & Yohe, 2003), ticks (Lindgren et al ., 2000; Estrada-Pena, 2002), and birds and alpine herbs (Parmesan & Yohe, 2003). Depending on their climate tolerance limits, species may migrate, adapt or go extinct. Insects are especially sensitive to climate change because they are ectothermic and affected by temperature (Andrewartha & Birch, 1954; Bale et al ., 2002). Changes in temperature and precipitation can have large effects on insects’ metabolic function, rates of feeding and development, migration, voltinism, and larval emergence and survival (Andrewartha & Birch, 1954), which in turn affects their geographic distributions.
Choice of climate change projections Researchers have used GCM-derived climate projections to predict a variety of climate change impacts. For example, Beaumont & Hughes (2002) used such projections to predict the future extinction rates of butterfly species, whereas others have used such projections to predict extinction rates of plants in reserves (Ara´ujo et al ., 2004), to evaluate conservation policies (Harrison et al ., 2006) and to assess the risk of invasive species (Kriticos et al . 2006, Mika et al ., 2008). There are two choices to be made with respect to GCMderived climate projections: (i) which model(s) to use and (ii) which climate change scenario(s) to use. There has been much discussion about how the choice of climate scenario may impact study conclusions (Beaumont et al ., 2007). In the interest of completeness and for comparability with other work, we included such comparisons in the present study, although such comparisons were not an important aspect. However, we can assume, a priori, that the areas at risk will depend on our choice of climate change scenario. The primary objective of the present study was to focus on the impact of the choice of climate models, a choice that has received considerably less attention than the choice of scenarios. One might quite reasonably expect that the scenario choice will have a larger impact on study conclusions than the choice of climate models. This is because any observed differences in climate change projections between climate models using the same emissions scenario are a result of discrepancy in assumptions about how climate behaves. Nevertheless, Kriticos et al . (2006) found that variability between different GCM climate projections is as large as the variability between different emissions scenarios. Although there is uncertainty in both the GCMs and the emissions scenarios, there is ‘sufficient agreement’ between the projections with general patterns occurring on the broad scale (Kriticos et al ., 2006). Others have not found such agreement and have suggested that modellers should always use climate change projections from more than one GCM when studying the impacts of climate change on a biological system (Nakicenovic et al ., 2000; Newman, 2006). For example, recently, we found that the choice of climate models fundamentally changed the areas at risk prediction for another agricultural pest, the swede midge Contarinia nasturtii (Mika et al ., 2008). In that study, it was found that the areas at risk significantly increased using the projections from one climate model but decreased using the projections from another climate model for the same scenario. We questioned whether this difference was specific to the swede midge or perhaps a more general result, and so we sought to make the same comparisons in the present work on the pea leafminer.
The use of uniform climate change scenarios GCMs differ in their projections of future climate because of differences in how they represent climatic processes and feedbacks (IPCC, 2007a). They are our only available tools for projecting future climate, and their output is the basis upon which the IPCC considers the impacts of climate change. Nevertheless, and with notable exceptions, the vast majority of © 2010 The Authors
Journal compilation © 2010 The Royal Entomological Society, Agricultural and Forest Entomology,12, 213–221
Conflicting predictions of future distributions 215 experimental research into the biological impacts of climate change, and a good deal of the modelling work on this subject utilizes simplistic scenarios of uniform increases in temperature (or changes in precipitation) that have no basis in climatic processes. Why do researchers use such simple uniform changes at all? First, uniform increases in, for example, temperature may provide a ‘first approximation’ for responses to global warming. Frequently, researchers justify these choices, explicitly or implicitly, by reference to the predictions for the annual mean global increase in temperature (+1.5 to +4◦ C; IPCC, 2007b). So, we might wish to see how increasing a climate variable by the global mean would affect a particular species or system, independently of the temporal and spatial variability in climate that is bound to exist. Second, we might use uniform increases as a means of assessing the general ‘sensitivity’ of a species or system to changes in climate. After all, if we cannot demonstrate significant responses in species population dynamics or distributions resulting from changes in, for example, temperature, then some might argue this would question the utility of pursuing research on the biological responses of more realistic climate changes. Although temperature sensitivity simpliciter has been satisfactorily demonstrated for sufficient numbers of species and systems, it might reasonably be argued that most species are likely to be sensitive to changes in climate when near the edges of their ranges. Therefore, it is likely that modelling a species’ distribution using only an incremental increase in a climate variable may result in changes at its distribution limits. Third, in experimental work, the use of uniform changes in, for example, temperature is a pragmatic choice because it is easiest to implement and interpret. In mathematical modelling studies, it is arguably just as easy to implement one or more of the GCM projections as it is to implement a fixed temperature increase, although it is harder to interpret the responses (Newman, 2004, 2005, 2006) when the temperature differences between baseline and future vary daily, seasonally, annually and spatially. In the present study, we compared model predictions for both simple climate scenarios, and those based on GCM projections. This allowed us to consider the pros and cons of both approaches in all the respects noted above.
Materials and methods The model The modelling program CLIMEX (CSIRO, 2004) was used to create a bioclimatic envelope model (BEM) of L. huidobrensis. CLIMEX is a tool that is often used to create BEMs of insects, especially agricultural pests (Sutherst et al ., 2000). Researchers can use CLIMEX to combine the observed distribution and abundance data of a species to estimate its optimal climate and climate tolerance limits to model its potential distribution (Sutherst et al ., 2000). After fitting parameters for a particular species using either the built-in or supplementary weather station data, CLIMEX provides growth and stress indices to indicate the suitability of the climate for each location. The growth index is a function of temperature, diapause,
light and moisture. The stress indices include these for heat, cold, dry and wet. The growth and stress indices are then combined to give one index, called the Ecoclimatic Index (EI), which indicates how favourable each location may be for that particular species. The EI values are in the range 0–100, where 0 indicates that the location’s climate is not suitable at all, up to 100, which signifies a ‘perfect’ climate for that species (Sutherst et al ., 2004). In the present study, the EI ranges were categorized according to Olfert et al . (2006), where an EI of 0–10 indicates an ‘unfavourable’ climate (i.e. the species could occur, but would not be able to establish there), 10 < EI < 20 is ‘suitable’, 20 < EI < 30 is ‘favourable’ and EI > 30 is ‘very favourable’ climate. Although Sutherst et al . (2004) have also suggested that an EI value greater than 30 should be considered as signifying ideal climatic conditions; other classifications or a continuous gradient can also be used. Classifications of EI values were used in the present study to ease the computation of the area of various levels of ‘suitability’ for L. huidobrensis. The BEM of L. huidobrensis was developed using the ‘temperate’ setting in CLIMEX as a base because L. huidobrensis is mostly found in temperate areas (Chen & Kang, 2004). The temperature parameters were set to known tolerance limits (Martin, 2003; OMAFRA, 2008b), and then adjusted using distribution and/or abundance data for South and Central America as well as from western North America (McDonald et al ., 2000; Scheffer, 2000; Zhao & Kang, 2000; GBIF, 2008) because L. huidobrensis can survive in temperate, subtropical and tropical climates (He et al ., 2002). In the present study, the two cryptic species (Scheffer et al ., 2001) were assumed to have the same climate tolerance limits and were treated uniformly. Parameters (Table 1) were then tuned so that the highest EI values in South America occurred where there is high elevation because L. huidobrensis is typically found at high elevations (Scheffer et al ., 2001; He et al ., 2002). In China, L. huidobrensis has been found in areas with elevations in the range 552–3200 m (He et al ., 2002). The soil moisture index and the wet and dry stresses were adjusted so that the most favourable climate coincided in areas with a relative humidity of approximately 30–70% (Parrella, 1987). The light and diapause indices and the cold–dry, cold–wet, hot–dry and hot–wet stresses were not used. The number of degree days was set so that several (up to four) generations would occur in California, which is how many are currently observed there (Reitz & Trumble, 2002). This corresponded to 825 degree-days (above 10.0◦ C) per generation. The distribution in California did not correspond to known occurrences (GBIF, 2008) because the BEM predicted high dry stress; thus, an irrigation scenario was employed. The suggested irrigation for vegetable crops grown in sands and coarse sandy loams is 25 mm of water per week (OMAFRA, 2008a). We therefore used a monthly irrigation scenario of 3.6 mm/day from May until October; this amount was applied as top-up irrigation.
Model validation The model was developed using known distribution and/or abundance data from South and Central America as well as
© 2010 The Authors
Journal compilation © 2010 The Royal Entomological Society, Agricultural and Forest Entomology,12, 213–221
216 A. M. Mika and J. A. Newman Table 1 CLIMEX parameter values for the bioclimatic envelope model of the pea leafminer, Liriomyza huidobrensis Index
Parameter
Description
Value
Temperature
DV0 DV1 DV2 DV3 SM0 SM1 SM2 SM3 TTCS THCS TTHS THHS SMDS HDS SMWS HWS DV0 DV3 DV3 DV4 DVCS DV4 PDD
Limiting low temperature Lower optimal temperature Upper optimal temperature Limiting high temperature Limiting low soil moisture Lower optimal soil moisture Upper optimal soil moisture Limiting high soil moisture Cold stress temperature threshold Cold stress temperature rate Heat stress temperature threshold Heat stress temperature rate Dry stress threshold Dry stress rate Wet stress threshold Wet stress rate – – – – – – Minimum degree days above DV0 to complete generation
10.0◦ C 15.0◦ C 32.0◦ C 35.0◦ C 0.2 0.4 0.8 1.5 −5.0◦ C −0.002 38.0◦ C 0.005 0.2 −0.01 1.50 0.001 10 35.0◦ C 35.0◦ C 100 9 100 825
Moisture
Cold stress Heat stress Dry stress Wet stress Day-degree accumulation above DV0 Day-degree accumulation above DV3 Day-degree accumulation above DVCS Degree-days per generation
from the U.S.A. and Canada (McDonald et al ., 2000; Scheffer, 2000; Zhao & Kang, 2000; GBIF, 2008). The model was then validated using distribution and/or abundance data from Europe (especially the Netherlands, U.K., Italy and Germany), Israel, Indonesia, Sri Lanka and China (McDonald et al ., 2000; Scheffer, 2000; Zhao & Kang, 2000; GBIF, 2008). The resulting distribution in these areas corresponded well with the occurrence data (GBIF, 2008), especially after the irrigation scenario was applied.
Climate change projections Climate change projections were downloaded from the IPCC data distribution website (2002) as monthly mean values for the Canadian Centre for Climate Modelling and Analysis model (CGCM2) and the Hadley Centre model (HadCM3) for the A2 and B2 scenarios from the Special Report on Emissions Scenarios (SRES). These two scenarios were used because they represent two possible situations of future CO2 emissions with the concentrations for the A2 scenario reaching 840 p.p.m. by 2090–2099 and the concentrations for the B2 scenario amounting to 620 p.p.m. by 2090–2099 (IPCC, 2007b). The A2 and B2 scenarios are sometimes called the ‘mediumhigh’ and ‘medium-low’ emissions scenarios, respectively. The A2 scenario represents a future with a high human population growth and slow technological advancement of efficient environmentally sustainable energy use, whereas the B2 scenario has moderate human population growth with more environmental protection (Nakicenovic et al ., 2000). The climate variables required for CLIMEX included: minimum temperature (Tmin ), maximum temperature (Tmax ), precipitation, and relative humidity (RH%). Relative humidity
projections were readily available for HadCM3 but had to be estimated for CGCM2 using the formula: RH (%) = 100 ×
ea eo (T )
(1)
in accordance with Allen et al . (1998). This equation represents the ratio of the actual vapour pressure (ea ) to the saturation vapour pressure [e◦ (T )] at the same temperature (T ). A discussion of the robustness of this equation is provided by Mika et al . (2008). The model results for future climates were evaluated using the 30-year averages for three standard time slices: the 2020s (2010–2039); the 2050s (2040–2069); and the 2080s (2070–2099). The distribution of L. huidobrensis was also mapped using the baseline period (1961–1990) to compare the model results using the built-in CLIMEX weather station data and the GCM projections for approximately the same period. In addition to the GCM climate change projections, two simple climate change scenarios were also applied to the BEM. We used the simple scenarios that are provided by CLIMEX as a ‘climate change option’ (Sutherst et al ., 2004). The first scenario was an increase of 0.1◦ C per degree in latitude for minimum and maximum temperatures and a 20% increase in total precipitation in the six ‘summer’ months (May to October) and a 20% decrease in the six ‘winter’ months (November to April). The second scenario was an overall increase of 3◦ C everywhere also with a 20% increase in precipitation in the summer and a 20% decrease in the winter. These increments were added to the monthly averages but have no time scale on them. © 2010 The Authors
Journal compilation © 2010 The Royal Entomological Society, Agricultural and Forest Entomology,12, 213–221
Conflicting predictions of future distributions 217 The Geographic Information System ArcGIS, version 9.1 (ESRI, Canada) with inverse distance weighting interpolation (ESRI, 2005) was used to create maps because of the evenlyspaced GCM climate change projections. The North American Equal Albers Conic projection was used.
Results Driving variables According to the BEM, cold stress (CS) is currently the main limiting factor of the current distribution of L. huidobrensis in North America, mainly Canada and parts of the western and midwestern U.S.A. Heat stress (HS) is not a major limiting factor anywhere in North America, except in Brawley, California (32.60◦ N, 115.30◦ W). Even with an irrigation scenario, dry stress (DS) is extremely limiting in the southern U.S.A. (Arizona and Texas). Wet stress (WS) does not appear to limit the distribution of L. huidobrensis in North America. The major limiting factors of the current distribution of L. huidobrensis in North America are probably cold and dry stress.
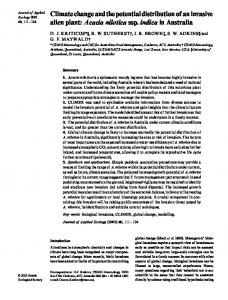
Possible effects of climate change Figure 1 shows the changes in absolute area across the 21st Century in North America for each of the categorical classifications: unfavourable, suitable, favourable and very favourable. Even though the total area may be similar between two predictions, the spatial pattern could differ. For brevity, spatial pattern is considered in Fig. 2 for the 2080s only because the results for this time period were the most divergent. Using the CGCM2 projections, the BEM predicts that North America may have less ‘unfavourable’ area and more ‘suitable’ and ‘favourable’ areas (Fig. 1). The area classified as ‘very favourable’ for L. huidobrensis does not change dramatically. On the other hand, using the HadCM3 projections, the model predicts a small increase in ‘unfavourable’ area, an increase in ‘suitable’ area, and relatively strong declines in ‘favourable’ and ‘very favourable’ areas. There is little qualitative difference between predictions for the two scenarios, except for the B2 with the CGCM2 model at the end of the century. Both of the simple climate change scenarios predict a decrease in ‘unfavourable’ and an increase in ‘suitable’, and ‘favourable’ area. For ‘very favourable’ area, there was a slight decrease (164 600 km2 ) using the uniform increase of 3◦ C everywhere but a relatively large increase for the +0.1◦ C/◦ latitude scenario (Fig. 1). Regarding geographic distributions, both the simple scenarios predict that the ‘very favourable’ area would shift farther north into southern Ontario and southern British Columbia (Fig. 2D, G). Although the spatial pattern of the bioclimatic envelope of L. huidobrensis is similar, the extent of the different climatic suitability area differs. For example, the midwestern U.S.A. are more favourable using the +0.1◦ C/◦ latitude scenario than the uniform +3◦ C scenario (compare Fig. 2D–G). Using the GCM projections, area of ‘very favourable’ climate are restricted to the extreme south of North America. These areas differ in spatial pattern and extent between the two GCMs and the two scenarios (Fig. 2).
Compared with the distribution of the envelope using weather station data (Fig. 2A), all the patterns and extent of climate stresses were similar with all GCM projections and simple climate change scenarios, except that heat stress using the HadCM3 projections (both scenarios) was much greater throughout most of North America by the 2080s than that using the CGCM2 projections (results not shown). Heat stress also increased slightly using the +0.1◦ C/◦ latitude scenario and more so using the +3◦ C scenario and the cold stress shifted slightly north (results not shown).
Discussion There are some standard objections to the general approach taken by BEMs for predicting climate change impacts. These objections have been thoroughly considered by others (Pearson & Dawson, 2003). Accordingly, for brevity, we simply note that we agree with these critiques, as do most producers and consumers of BEMs. Nevertheless, the continued use of these models implies that we do not yet have any better alternatives for predicting climate impacts at these sorts of spatial scales. Despite these significant limitations, BEMs nevertheless give an indication that the species might establish in a particular area.
Uncertain risk predictions when using GCMs In this section, we consider only the predicted areas at risk resulting from the GCM-generated climate projections (Figs 1 and 2). Despite the fact that, visually, there is some agreement between the maps for the baseline period (Fig. 2B, C), there appears to be little consensus between the maps for the 2080s for either climate scenario. One simple way to show this is by looking at the ‘unfavourable’ area (Fig. 1). Here, we can see that its extent increases if the HadCM3 projections are used, but decreases if the CGCM2 projections are used. Furthermore, the spatial pattern of predicted risk varies greatly between predictions based on the two GCMs, even for the same scenario. For example, Figs 2(H, I) are based on the same climate (i.e. scenario B2), yet there is almost no overlap at all between the predictions in the locations of ‘very favourable’ areas, and some areas (e.g. southern Texas and northern Mexico) that are classified as ‘very favourable’ based on one model are classified as ‘unfavourable’ based on the other. It is possible to find some areas of agreement between the predictions based on the two models (e.g. the Eastern and Northwestern U.S.A. are approximately similar within scenarios across models), although the differences appear to be more striking than the similarities. We therefore suggest that we have little idea of the potential changes in risk for crop damage from this invasive species. Certainly, there are many sources of uncertainty associated with the GCM projections, SRES scenarios and the BEMs themselves (Pearson & Dawson, 2003; Hampe, 2004; Segurado & Ara´ujo, 2004; Pearson et al ., 2006; Ara´ujo & New, 2007; Mika et al ., 2008). Constraints on current computing power require climatologists to trade off model complexity (spatial resolution, etc.) and computing time. Some processes
© 2010 The Authors
Journal compilation © 2010 The Royal Entomological Society, Agricultural and Forest Entomology,12, 213–221
218 A. M. Mika and J. A. Newman
Figure 1 The changes in ‘unfavourable’ (0 < EI < 10), ‘suitable’ (10 < EI < 20), ‘favourable’ (20 < EI < 30) and ‘very favourable’ (EI > 30) area (km2 ) from the baseline period (1961–1990) to the 2020s (2010–2039), 2050s (2040–2069), and 2080s (2070–2099), where each time period is shown as the mean of the period. The results are shown for the Canadian Centre for Climate Modelling and Analysis GCM (CGCM2) (denoted by open symbols) and Hadley Centre climate model (HadCM3) (denoted by filled symbols) climate change projections with the A2 (denoted by triangles) and B2 scenario (denoted by circles). The two climate change scenarios from CLIMEX were either an increase of 0.1◦ C per degree latitude (denoted by +) or a uniform increase of 3◦ C (denoted by X). Note the difference in scale on the y -axis for the graph representing ‘unfavourable’ area. EI, Ecoclimatic Index.
© 2010 The Authors
Journal compilation © 2010 The Royal Entomological Society, Agricultural and Forest Entomology,12, 213–221
Conflicting predictions of future distributions 219
Figure 2 Ecoclimatic index (EI) values for Liriomyza huidobrensis in North America using the (a) weather station data and the (b) Canadian Centre for Climate Modelling and Analysis GCM (CGCM2) and (c) Hadley Centre climate model (HadCM3) baseline period (1961–1990). The results from the bioclimatic envelope model (BEM) when using (d) an increase of 0.1◦ C per degree latitude or (g) a uniform increase of 3◦ C everywhere are shown. The BEM results when using GCM climate change projections in combination with the A2 scenario for (e) CGCM2 and (f) HadCM3 are shown for the 2080s. The B2 scenario projections for (h) CGCM2 and (i) HadCM3 are also shown for the 2080s. ‘Unfavourable’ climate represents EI < 10, ‘suitable’ is 10 < EI < 20, ‘favourable’ is 20 < EI < 30, and ‘very favourable’ climate is EI >30.
are modelled mechanistically, whereas others are represented phenomenologically. There is no consensus (or even much speculation) among climate modellers as to which GCM produces the most ‘reliable’ climate change projections or which model is ‘better’ than another. A GCM that accurately predicts past climate does not necessarily predict future climate accurately because future climate forces will be very different from those observed in the past. The inability to evaluate the accuracy of climate change projections from various GCMs is the main reason for considering multiple GCM-scenario combinations when studying the effects of climate change on a species’
distribution (Nakicenovic et al ., 2000; Kriticos et al ., 2006; Newman, 2006). The same approach used in the present study could be used with different GCM and SRES scenarios, as well as with more than two GCMs and two scenario combinations (Kriticos et al ., 2006). Mika et al . (2008) found qualitative differences in the predictions of the potential spread of another invasive agricultural pest, the swede midge (Contarinia nasturtii ). The BEM predicted an increase in areas with ‘very favourable’ climate when the CGCM2 was used and a decrease when the HadCM3 was used. In that study, which used the same GCMs and scenarios
© 2010 The Authors
Journal compilation © 2010 The Royal Entomological Society, Agricultural and Forest Entomology,12, 213–221
220 A. M. Mika and J. A. Newman as the present study, the differences in bioclimatic envelopes were attributable to differences between the GCMs in their projections of soil moisture. In the present study, the differences between the models largely reflect a combination of differences in both temperature and precipitation projections. When comparing historical climate data to the hind-casts from the CGCM2 and HadCM3 for western Canada, Bonsal et al . (2003) found that the CGCM2 and HadCM3 were quite accurate in modelling past mean temperature with some seasonal differences but that the HadCM3 precipitation matched the historical data more closely than the CGCM2. Perhaps it is this difference between the GCMs that is driving the interaction between temperature and precipitation and causing the effect on the distribution of L. huidobrensis.
Risk predictions from simple climate change scenarios Many modelling exercises, and almost all experimental investigations of climate change impacts, consider a uniform (in space and time) increase in temperature or change in precipitation. Recall from the Introduction that we considered the reasons for adopting this approach, and stated that our purpose in comparing the biological impacts implied by simple scenarios with those predicted from GCM-based climate projections was to evaluate the notion that the two approaches might give approximately similar predictions of the impacts of future climate change. Our comparison does not deny the utility of uniform increases for either establishing climate sensitivity or for pragmatic reasons of implementation or interpretation. In Fig. 2(G), we show the resulting bioclimatic envelope from a uniform +3◦ C temperature change. This increase is well within the range of changes predicted for each scenario we considered (A2 = +2.0 to +5.4◦ C; B2 = +1.4 to +3.8◦ C; IPCC, 2007b). It also comprises a reasonable comparison with the changes in the global mean temperature predicted for these particular GCMs and scenarios for the 2080s (CGCM2-A2 = +4.3◦ C; CGCM2-B2 = +3.0◦ C; HadCM3-A2 = +3.25◦ C; HadCM3-B2 = +2.5◦ C). Thus, Fig. 2(F–H) shows comparisons of approximately the same changes in mean global temperatures. By inspection, we can see that there is marginally better correspondence between the predictions from the uniform change and the CGCM2 model than between the predictions from the uniform and the HadCM3 model. Regardless, there are some striking differences. For example, the Mexican states of Sonora, Chihuahua, Sinaloa and Durango were classified as ‘very favourable’ using the uniform +3◦ C temperature but were classified as ‘unfavourable’ using the CGCM2 projections. The Mexican states of Yucatan, Quintana Roo, Campeche and Chiapas were equally discordant between the three models, and more or less the entirety of the Midwestern US states shows particularly poor agreement between the three results. As for the comparison of the outputs based on the two GCMs with each other, one can find areas of agreement between the GCM-based predictions and those based on the uniform change; however, to us, the differences are more striking than the similarities.
This exercise would suggest, at least for the pea leafminer, that uniform increases in temperature are not good approximations of the effects of GCM-predicted climate change. We suspect that similar differences would be found for many of the other modelling exercises that consider only uniform changes in temperature. Such changes are not similar enough to the output from any GCM to make them particularly good approximations, although, obviously, this is a testable hypothesis. Because uniform changes in temperature or precipitation are not predicted by any climate models, we suggest caution when interpreting the impacts of uniform changes (in either models or experiments) as being particularly relevant to the situation in future climates. Such experiments and modelling exercises demonstrate climate sensitivity simpliciter, although they probably should not be used to infer biological changes that result from climate change.
Acknowledgements This work was supported in part by grants from the Canadian Natural Sciences and Engineering Research Council (NSERC) and the Ontario Ministry of Agriculture, Food and Rural Affairs (OMAFRA), University of Guelph Sustainable Production Program. The authors would like to thank Rebecca Hallett for useful comments on developing the bioclimatic envelope model and three anonymous reviewers for their helpful comments on an earlier version of this manuscript.
References Allen, R.G., Pereira, L.S., Raes, D. & Smith, M. (1998) Crop Evapotranspiration–Guidelines for Computing Crop Water Requirements. FAO Irrigation and Drainage Paper 56. FAO, Italy. Andrewartha, H.G. & Birch, L.C. (1954) The Distribution and Abundance of Animals, pp. 782. The University of Chicago Press, Canada. Ara´ujo, M.B. & New, M. (2007) Ensemble forecasting of species distributions. Trends in Ecology and Evolution, 22, 42–47. Ara´ujo, M.B., Cabeza, M., Thuiller, W., Hannah, L. & Williams, P.H. (2004) Would climate change drive species out of reserves? An assessment of existing reserve-selection methods. Global Change Biology, 10, 1618–1626. Bale, J.S., Masters, G.J., Hodkinson, I.D. et al . (2002) Herbivory in global climate change research: direct effects of rising temperature on insect herbivores. Global Change Biology, 8, 1–16. Beaumont, L.J. & Hughes, L. (2002) Potential changes in the distributions of latitudinally restricted Australian butterfly species in response to climate change. Global Change Biology, 8, 954–971. Beaumont, L.J., Pitman, A.J., Poulsen, M. & Hughes, L. (2007) Where will species go? Incorporating new advances in climate modelling into projections of species distributions. Global Change Biology, 13, 1368–1385. Bonsal, B.R., Prowse, T.D. & Pietroniro, A. (2003) An assessment of global climate model-simulated climate for the western cordillera of Canada (1961–90). Hydrological Processes, 17, 3703–3716. Chen, B. & Kang, L. (2004) Variation in cold hardiness of Liriomyza huidobrensis (Diptera: Agromyzidae) along latitudinal gradients. Environmental Entomology, 33, 155–164. Commonwealth Scientific and Industrial Research Organisation (CSIRO) (2004) Dymex Simulator Application 2.0. Hearn Scientific Software, Australia. © 2010 The Authors
Journal compilation © 2010 The Royal Entomological Society, Agricultural and Forest Entomology,12, 213–221
Conflicting predictions of future distributions 221 Environmental Systems Research Institute (ESRI) (2005) ArcGIS. 9.1, Environmental Systems Research Institute Inc., Canada. Estrada-Pena, A. (2002) Increasing habitat suitability in the United States for the tick that transmits Lyme disease: a remote sensing approach. Environmental Health Perspectives, 110, 635–640. Global Biodiversity Information Facility (GBIF) (2008) Global Biodiversity Information Facility [WWW document]. URL http://tiny.cc/1VUUm [accessed on 15 May 2008]. Hampe, A. (2004) Bioclimate envelope models: what they detect and what they hide. Global Ecology and Biogeography, 13, 469–471. Harrison, P.A., Berry, P.M., Butt, N. & New, M. (2006) Modelling climate change impacts on species’ distributions at the European scale: implications for conservation policy. Environmental Science and Policy, 9, 116–128. He, L., Zhang, Y., Xiao, N., Wei, J. & Kuang, R. (2002) Liriomyza huidobrensis in Yunnan, China: current distribution and genetic structure of a recently established population. Entomologia Experimentalis et Applicata, 102, 213–219. Hill, J.K., Thomas, C.D. & Huntley, B. (1999) Climate and habitat availability determine 20th century changes in a butterfly’s range margin. Proceedings of the Royal Society of London Series B, Biological Sciences, 266, 1197–1206. IPCC (2002) The IPCC Data Distribution Centre [WWW document]. URL http://tinyurl.com/2uetzd [accessed on 1 February 2007]. IPCC (2007a) Climate Change 2007: IPCC Fourth Assessment Report. Chapter 8 – Climate Models and their Evaluation. Cambridge University Press, New York, New York. IPCC (2007b) Climate Change 2007: IPCC Fourth Assessment Report. Chapter 10 – Global Climate Projections. Cambridge University Press, New York, New York. Kriticos, D.J., Alexander, N.S. & Kolomeitz, S.M. (2006) Predicting the potential geographic distribution of weeds in 2080. 15th Australian Weeds Conference: Managing Weeds in a Changing Climate (ed. by C. Preston, J.H. Watts and N.D. Crossman), pp. 27–34. Weed Management Society of South Australia, Australia. Lindgren, E., Talleklint, L. & Polfeldt, T. (2000) Impact of climatic change on the northern latitude limit and population density of the disease-transmitting European tick Ixodes ricinus. Environmental Health Perspectives, 108, 119–123. Martin, A.D. (2003) The biology and behaviour of Liriomyza huidobrensis (Blanchard), the pea leafminer, in southern Ontario. Unpublished Master’s Thesis, University of Guelph. Martin, A.D., Hallett, R.H., Sears, M.K. & McDonald, M.R. (2005) Overwintering Ability of Liriomyza huidobrensis (Blanchard) (Diptera: Agromyzidae) in Southern Ontario, Canada. Environmental Entomology, 34, 743–747. McDonald, M.R., Sears, M.K., Clarke, T., Chaput, J. & Marshall, S.A. (2000) Pea leafminer, a new pest of leafy vegetables in Ontario, Canada. HortScience, 35, 392. Mika, A.M., Weiss, R.M., Olfert, O., Hallett, R.H. & Newman, J.A. (2008) Will climate change be beneficial or detrimental to the invasive swede midge in North America? Contrasting predictions using climate projections from different general circulation models. Global Change Biology, 14, 1721–1733. Nakicenovic, N., Alcamo, J., Davis, G. et al . (2000) Special Report on Emissions Scenarios: A Special Report of Working Group III of the Intergovernmental Panel on Climate Change, pp. 1–599. Cambridge University Press, Cambridge. Newman, J.A. (2004) Climate change and cereal aphids: the relative effects of increasing CO2 and temperature on aphid population dynamics. Global Change Biology, 10, 5–15.
Newman, J.A. (2005) Climate change and the fate of cereal aphids in Southern Britain. Global Change Biology, 11, 940–944. Newman, J.A. (2006) Using the output from global circulation models to predict changes in the distribution and abundance of cereal aphids in Canada: a mechanistic modeling approach. Global Change Biology, 12, 1634–1642. Olfert, O., Hallett, R., Weiss, R.M., Soroka, J. & Goodfellow, S. (2006) Potential distribution and relative abundance of swede midge, Contarinia nasturtii, an invasive pest in Canada. Entomologia Experimentalis et Applicata, 120, 221–228. Ontario Ministry of Agriculture, Food and Rural Affairs (OMAFRA) (2008a) Irrigating Vegetable Crops [WWW document]. URL http://tiny.cc/v2j8C [accessed on 15 May 2008]. Ontario Ministry of Agriculture, Food and Rural Affairs (OMAFRA) (2008b) Leafminers Attacking Field Vegetables and Greenhouse Crops [WWW document]. URL http://tiny.cc/nytLM [accessed on 15 May 2008]. Parmesan, C. & Yohe, G. (2003) A globally coherent fingerprint of climate change impacts across natural systems. Nature, 421, 37–42. Parmesan, C., Ryrholm, N., Stefanescu, C. et al . (1999) Poleward shift of butterfly species’ ranges associated with regional warming. Nature, 399, 579–583. Parrella, M.P. (1987) Biology of Liriomyza. Annual Review of Entomology, 32, 201–204. Pearson, R.G. & Dawson, T.P. (2003) Predicting the impacts of climate change on the distribution of species: are bioclimate envelope models useful? Global Ecology and Biogeography, 12, 361–371. Pearson, R.G., Thuiller, W., Araujo, M.B. et al . (2006) Model-based uncertainty in species range prediction. Journal of Biogeography, 33, 1704–1711. Reitz, S.R. & Trumble, J.T. (2002) Interspecific and intraspecific differences in two Liriomyza leafminer species in California. Entomologia Experimentalis et Applicata, 102, 101–113. Scheffer, S.J. (2000) Molecular Evidence of Cryptic Species within the Liriomyza huidobrensis (Diptera: Agromyzidae). Journal of Economic Entomology, 93, 1146–1151. Scheffer, S.J., Wijesekara, A., Visser, fnm.Dfnm. & Hallett, R.H. (2001) Polymerase chain reaction-restriction fragmentlength polymorphism method to distinguish Liriomyza huidobrensis from L. langei (Diptera: Agromyzidae) applied to three recent leafminer invasions. Journal of Economic Entomology, 94, 1177–1182. Segurado, P. & Ara´ujo, M.B. (2004) An evaluation of methods for modelling species distributions. Journal of Biogeography, 31, 1555–1568. Spencer, K.A. (1973) Agromyzidae (Diptera) of Economic Importance. Junk, The Netherlands. Sutherst, R.W., Maywald, G.F. & Russell, B.L. (2000) Estimating vulnerability under global change: modular modelling of pests. Agriculture, Ecosystems and Environment, 82, 303–319. Sutherst, R.W., Maywald, G.F., Bottomley, W. & Bourne, A. (2004) CLIMEX Version 2 User’s Guide. Hearne Scientific Software, Australia. Zhao, Y.X. & Kang, L. (2000) Cold tolerance of the leafminer Liriomyza sativae (Dipt., Agromyzidae). Journal of Applied Entomology, 124, 185–189. Accepted 1 August 2009 First published online 29 April 2010
© 2010 The Authors
Journal compilation © 2010 The Royal Entomological Society, Agricultural and Forest Entomology,12, 213–221