Open Access Proceedings
Drinking Water
Drink. Water Eng. Sci., 4, 37–50, 2011 www.drink-water-eng-sci.net/4/37/2011/ doi:10.5194/dwes-4-37-2011 © Author(s) 2011. CC Attribution 3.0 License.
Engineering and Science
Open Access
Open Access
Earth System
CLIPS based decision support system for water Science distribution networks
Data
K. Sandeep1 and K. Rakesh2 1
2
Research scholar, IIT Delhi, Delhi, India Faculty, Department of Civil Engineering, Indian Institute of Technology, Delhi, India Received: 7 February 2011 – Published in Drink. Water Eng. Sci. Discuss.: 7 March 2011 Revised: 8 September 2011 – Accepted: 23 September 2011 – Published: 27 October 2011
Abstract. The difficulty in knowledge representation of a water distribution network (WDN) problem has
contributed to the limited use of artificial intelligence (AI) based expert systems (ES) in the management of these networks. This paper presents a design of a Decision Support System (DSS) that facilitates “on-demand” knowledge generation by utilizing results of simulation runs of a suitably calibrated and validated hydraulic model of an existing aged WDN corresponding to emergent or even hypothetical but likely scenarios. The DSS augments the capability of a conventional expert system by integrating together the hydraulic modelling features with heuristics based knowledge of experts under a common, rules based, expert shell named CLIPS (C Language Integrated Production System). In contrast to previous ES, the knowledge base of the DSS has been designed to be dynamic by superimposing CLIPS on Structured Query Language (SQL). The proposed ES has an inbuilt calibration module that enables calibration of an existing (aged) WDN for the unknown, and unobservable, Hazen-Williams C-values. In addition, the daily run and simulation modules of the proposed ES further enable the CLIPS inference engine to evaluate the network performance for any emergent or suggested test scenarios. An additional feature of the proposed design is that the DSS integrates computational platforms such as MATLAB, open source Geographical Information System (GIS), and a relational database management system (RDBMS) working under the umbrella of the Microsoft Visual Studio based common user interface. The paper also discusses implementation of the proposed framework on a case study and clearly demonstrates the utility of the application as an able aide for effective management of the study network.
1
Introduction
The day-to-day operation of a water distribution network is managed by skilled operators who use experience and other heuristics to adjust and control network elements such as pumps and valves in their desire to achieve satisfactory performance of the water supply system. However, following an unforeseen and an unusual emergency such as a burst water main, prompt and effective measures from the network manager is often taken for granted by the consumers. On their part, the network managers usually have to depend upon scant information that is reported by consumers impacted by these exigencies (Machell et al., 2010).
Correspondence to: S. Kulshrestha (
[email protected])
Managers of water utilities design most of their interventions and other decisions based on intuition, rule of thumb heuristics and trial and error. These operative decisions are often vague and inconsistent as they lack objectivity and, as a result, these often result in inefficient network management. Further, on account of distribution complexities and excessive reliance on a heuristics driven management paradigm that is often unconvincing and seemingly feeble in substance without an accompanying validation, there is no guarantee that resources are utilized effectively (Raghvendran et al., 2007). Difficulties in managing a typical water supply system arise on account of (i) absence of a well defined policy framework; (ii) difficulty in gathering information that is coherent and objective because, as is often the case, information is based on individual perception and experience; (iii) complexity of a typical water supply system on account of its extensive and spatially distributed character and accompanied by a variety of control mechanisms; and (iv) frequent
Published by Copernicus Publications on behalf of the Delft University of Technology.
38
K. Sandeep and K. Rakesh: CLIPS based decision support system
changes in the network topology (Leon et al., 2000). Collectively, these foregoing issues present great difficulties in efforts to develop mathematical models of such inherently complex systems (Walski, 1993). Recent developments in AI technology make it possible to encode knowledge and reasoning in a structured computer program that enables it to mimic the human thought process and its application, albeit within a narrow but well defined domain specific framework, during a problem-solving process. Such a tool, generally referred to as either a knowledge-based system (KBS) or an Expert System (ES) (Chau, 2004), is designed to assist in solving problems that would otherwise require the skills and expertise of a knowledgeable “flesh and blood” professional by applying embedded heuristics and other pertinent rules of thumb. The paper presents descriptive details of a DSS that has been developed to assist managers of WDN, especially where water supply is intermittent and demand driven and not pressure driven. Water distribution networks operate for a limited duration, and because the amount of water each user is able to collect depends on the available pressure at their connection and the duration of the service, the user demand is often not fully met. To improve the service standards, water utilities are struggling hard to develop aids in the form of computer based analysis and management software. Expert systems, as an artificial intelligence (AI) based approach, is one such approach that managers of water utilities are increasingly gravitating towards. The suggested tool is but a computer program that seeks to provide solutions to the same problems which were traditionally solved only by a human expert by archiving knowledge in the form of rules and other heuristics and then utilizing this pre-programmed set of strategies and the knowledge base in a manner that is akin to human reasoning. The AI field has always fascinated researchers who have applied it in many diverse fields (Cheng et al., 2002; Wang et al., 2004; Muttil and Chau, 2007). In the field of water management, some important applications of expert systems include EXPLORE (Leon et al., 2000), OASIS (Goforth and Floris, 1991), CRITQUING Expert System (Shepherd and Ortolano, 1996), IITWSEXP (Khosa et al., 1995), Expert System for treated water distribution (Bunn and Helms, 1999), Network Management System For Water Distribution System (Raghvendran et al., 2007), and Intelligent Control System For a Municipal Water Distribution Network (Chan et al., 1999). Most of these initiatives included components to transfer knowledge from the heuristic domain to the knowledge base of the expert system, while some of the other developments have applied fuzzy logic to process information and suggest “best practice” guidelines for the network manager. Review of literature further reveals that presently available expert systems have an extremely limited scope and are confined to only those specific tasks that come as preprogrammed knowledge and are therefore unable to reason broadly across fields of peripheral expertise. These ES Drink. Water Eng. Sci., 4, 37–50, 2011
employ static knowledge domains without the ability to store newer facts and, therefore, are unable to learn and evolve. Moreover, the difficulty in knowledge representation of a WDN problem has contributed to the limited use of expert systems (ES) in the management of WDN. WDN are seldom new and are associated with large amount of data for its elements namely pipes, demand nodes, supply nodes and pump etc. As a result of the natural process of ageing, and with frequent interventions necessitated by our perceived need to meet various performance goals, water supply networks undergo physical changes that significantly impinge on their hydraulic responses. To analyze such a continuously changing system, it is necessary to store information related to WDN elements in a logical and systematic way, thereby preserving and retrieving the cross relations between them. The DSS, therefore, has been designed to have SQL as RDBMS.
2
CLIPS expert shell and domain integration
Knowledge base constitutes the core of any DSS and for the latter to be an effective surrogate for any expert, it is essential that the heuristic knowledge is available in the form of easily understandable rules. The public domain expert shell, CLIPS, provides an ideal platform wherein expert knowledge may be codified as rules related to operation and management of WDN. To supplement its rules management capability, CLIPS also works as an inference engine that enables it to perform the inference procedure whereby rules are interpreted to trigger various actions as is deemed appropriate. This mechanism employs the embedded pre-existing rules based knowledge as “facts” to drive the firing mechanism of the inference engine and thereby produce a recommended conclusion to a particular problem. A feature of CLIPS is that this expert shell does not have its own dedicated database and, as a result, facts are volatile and are purged from its memory as soon its execution is terminated. To overcome this intrinsic limitation, an external RDMS must be added for a seamless integration with CLIPS. This then creates the desired two-way communication capability in the DSS whereby all facts can be transferred into the database during closing and, conversely, these facts can also be re-asserted back into the memory bank of CLIPS during program execution. In comparison to the previous efforts as documented in the literature, the structure and design of the proposed DSS is a significant improvement as it combines network modelling capabilities with ES. Hydraulic modelling requires complex and extensive calculations to be carried out and this capability has been achieved in the proposed DSS by integrating the MATLAB computation platform with the latter system. The present study attempts to develop a DSS that incorporates a dynamic knowledge acquisition system driven by simulated runs of a hydraulic model, suitably calibrated and validated for the given water utility. In addition to CLIPS as an AI tool and the www.drink-water-eng-sci.net/4/37/2011/
K. Sandeep and K. Rakesh: CLIPS based decision support system
MATLAB computational platforms, and in order to vest it with the capability to handle spatially distributed attributes of the study network, the proposed DSS uses open source GIS coupled together with a RDBMS. Together, these seemingly disjointed components work under the umbrella of a common user interface with cross platform integration being facilitated through a dynamic link library (DLL) in the Visual Studio environment. 3
Problems of water distribution system management
Municipal water distribution systems are: (i) spatially extensive; (ii) composed of multiple pipe loops to maintain satisfactory levels of redundancy; (iii) governed by non-linear hydraulic equations; (iv) designed complex hydraulic control devices such as valves and pumps; and (v) complicated by numerous layout, pipe sizing, and pumping alternatives. In addition to the palpable impairment in hydraulic performance that results as a network inevitably ages, it is natural that with a steady improvement in living standards accompanied by continuously increasing population, aspirations for better reliability in service and periodic inclusion of newer areas within the municipal limits especially in metropolitan cities together make these systems difficult to manage. Often, these impacts result in performance levels that are well below expectations. Further, WDN are managed by experts, who, over the years of their association and responsibility, acquire an empirical knowledge of the system, but characteristically this knowledge remains largely confined to their respective personal domains. In the event of any new information and/or emergence of a new problem, these experts apply simple heuristics to design corrective measures and cognitively seek to predict network performance. Understandably, therefore, the assurance of a satisfactory response of the study network to suggested interventions is often based more on hope rather than on a validated belief. With specific reference to issues of availability of domain knowledge, managers of water utilities face numerous difficulties on account of (i) expert scientific knowledge is not readily accessible; (ii) expert scientific knowledge is not available in a user friendly manner; and (iii) the tacit, undocumented expertise required for operation of a water supply system may be lost when experienced personnel leave service for whatever reason. These and similar concerns have seen resurgence in consumer demands that water engineers are suitably trained to apply current, technology based tools objectively and intelligently, and with the recent advances in AI technology, these personnel can be trained to fulfill this requirement. This indeed follows from the widely held view that there usually are very few specialists who have a thorough understanding of all the issues pertinent to network modelling for flows, pressures, and/or water quality. The proposed KBS has the potential to fill the gaps in www.drink-water-eng-sci.net/4/37/2011/
39
knowledge that exist between researchers and practitioners (Chau, 2004). Knowledge of basic network modelling concepts is indeed central to the decision-making process within water utilities not just as an aid to pipe network analysis but also for its efficient planning, design, and operation. This allows simulation of the design network and its examination under a variety of current and future operating conditions including possible design interventions. A number of off-the-shelf packages are available that allow tailor-made simulation models to be constructed for a water utility’s specific requirements. Popular packages include EPANET (US Environmental Protection Agency), AQUIS (7T), Infoworks (Wallingford software), SynerGEE (Advantica), and WaterGEMS (Bentley). These software packages enable development of mathematical models for a WDN that combine the physical configuration of these networks with physics-based equations that relate pressure and flow for each operational element (Machell et al., 2010). For the model to be acceptable as a reasonable representation of the actual system, the results from the model must bear close resemblance to the actual performance of the hydraulic system (ECAC, 1999). This, therefore, necessitates a prior model calibration. 4
The DSS
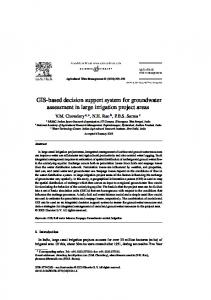
The aim of development of a DSS is to codify the heuristic expert knowledge in a form that is easily understood by the computer and also enables a novice to effectively manage a given WDN under unforeseen exigencies. Towards this end, possible real world scenarios corresponding to various design interventions are generated and corresponding results are incorporated in the knowledge base in order to enhance the scope and reach of the DSS. The development process involves (i) understanding the physical component elements of a typical WDN and their functionality, (ii) study of already existing DSS, (iii) understanding common terminology used by operators and experts, (iv) knowledge of current strategies for management of a water utility. Since the DSS is to be applied on a WDN, it is imperative to have a modal case study of a WDN. Anytown Network (Walski et al., 1988; Kapelan, 2002), as shown in Fig. 1, is taken as the model case study. The network consists of 35 pipes assembled in a fashion that they form 19 loops. As the present study deals only with steady state analysis, the tanks at nodes 501 and 502 in the original network have been changed to reservoirs. The proposed DSS is developed as a personal computer (PC) based application in the Visual Studio.Net environment. Visual Studio.NET is a complete set of development tools for building ASP Web applications – XML Web services, desktop applications, and mobile applications, etc., and all use the same integrated development environment (IDE), which allows them to share tools and facilitates in the creation of Drink. Water Eng. Sci., 4, 37–50, 2011
40
K. Sandeep and K. Rakesh: CLIPS based decision support system
Figure 1. The anytown network.
mixed-language solutions. This framework provides a clear, object-oriented, extensible set of classes that enables one to develop rich Windows applications. A DSS framework for a system as spatially extensive as a WDN has to reflect the underlying complexity of the system for realism and yet be simple to use. Accordingly, the complex functionality of these and similar systems is best disaggregated into a limited number of manageable facets in the form of interconnected modules and linked together in a structured manner to yield the overall DSS. Accordingly, within this modular framework, the proposed DSS has been designed with object modules for Network Calibration, Network Simulation, Daily Run Operation, and Network Information. The complex task of computations, data handling, visualization, and decision/inference of each module is handled through MATLAB, SQL server, MapWinGIS, and CLIPS. Figure 2 shows that platforms such as SQL, MATLAB, CLIPS, and MapWinGIS enable exchange/transfer of data between different modules of the DSS under the overall umbrella of Visual Studio.Net platform. In addition to the modules, there are additional supporting tools that have been integrated within the expert DSS. These supporting tools are listed in the following text along with a brief accompanying description. 4.1
Relational database management system
A typical WDN may be characterized in terms of a diverse set of attributes and, importantly, these attributes are complimentary in nature with no attribute capable of acting as a surrogate for one or more of the other identified attributes. While some attributes are static in nature (for example link diameters and elevations of the identified critical elements of the distribution system), many of the other attributes are dynamic in nature and may assume different values through time. The skill with which these data are stored, retrieved, Drink. Water Eng. Sci., 4, 37–50, 2011
Figure 2. Basic framework of Decision Support System.
and/or used largely determines the utility and acceptability of any proposed DSS. Typically, data pertaining to the components of WDN must be collected from different sources and need to be processed and stored within a well-structured framework in order to ensure availability to modellers, planners, and decision makers on demand and, at the same time, amenable to easy discrimination by the processing system. Relational databases allow such interrelationships to be preserved within the overall database management framework. In the present study, a relational database management system (RDBMS) for WDN has been developed using Structured Query Language (SQL). All the necessary tables have been created in SQL and these are linked to each other through a primary key. 4.2
CLIPS knowledge base and inference engine
CLIPS (acronym for C Language Integrated Production System) is a computer language designed and developed by the US Space Agency, NASA, specifically for writing expert system (ES) applications. CLIPS is a forward-chaining rule-based language that resembles OPS5 and ART, other widely known rule-based development environments. Figure 3 shows the basic components of CLIPS and the basic functionality of each of these components is given as below: 1. User Interface: the mechanism by which the user and the ES communicate. 2. Fact-list: a global memory for data inserted as pipefacts, node-facts, valve-fact, etc. into the memory of CLIPS. 3. Knowledge-base: contains all the rules used by the ES.
www.drink-water-eng-sci.net/4/37/2011/
K. Sandeep and K. Rakesh: CLIPS based decision support system
41
kulshrestha,S.:CLIPS CLIPS based Decision Support System kulshrestha,S.: based Decision Support System WDN status WDN status Reservoir levels Reservoir levels Pump status Pump status Valve status
Valve status
Proposed intervention intervention toProposed WDN by the user like: to WDN by the user like: Addition/Deletion/ updation Addition/Deletion/ updation Pipe, Source node, Demand Node Pipe,etc. Source node, Demand
Data-base Data-base
System System Analyzer
System Output: System Nodal heads and Output: Nodal heads and Link flows
Analyzer
5
Fact
Fact Child
Link flows
Child
public class DRAFPipe :Fact
public class DRAFPipe :Fact
Node etc.
CLIPS
CLIPS User Interface Warning/ User Interface Advice
Warning/ Advice
Fact-List
Fact-List
Knowledge-base
Knowledge-base Inference Engine Inference Engine Agenda Agenda
Fig. 3. Components of CLIPS andand its implementation in ES Figure 3. Components of CLIPS its implementation in ES.
const string PIPEID="pipe_id"; const string SNODE= "snode"; const string PIPEID="pipe_id"; const string ENODE= "enode"; "snode"; const string SNODE= gconst ; "enode"; const string Actual_Flow ="aflow"; string ENODE= const string Daily_Flow= "dflow"; ="aflow"; g Actual_Flow ; const string Observed Flow= "oflow""dflow"; const strin const string Daily_Flow=
const strin Observed Flow= "oflow" Child
public class DRPipe : DRAFPipe
Child
public class DRPipe : DRAFPipe const string INITIAL_FACTDR = "(pipe-details (pipe_id 0.0) Fig. 3. Components of CLIPS and its implementation in ES ( snode 0.0)( enode 0.0)( aflow 0.0) The CLIPS is a fact driven environment where rules are 4. Inference engine: makes inferences by deciding which const string INITIAL_FACTDR = "(pipe-details (pipe_i ( dflow 0.0)(oflow 0.0))"; fired depending upon the matching.theCLIPS does not rules are satisfied by pattern facts, prioritizes satisfied rules, ( snode 0.0)( enode 0.0)( aflow 0.0) The isthe a fact driven environment where rules are have its CLIPS own database andwith factsthe stay in thepriority. memory of the and executes rule highest ( dflow 0.0)(oflow 0.0))"; CLIPS during its active only. Asmatching. soon as the CLIPS CLIPS enfired depending uponstate the pattern does not Figure 4. Class and child Class for fact of Pipe object. vironment is closed all facts are removed from its memory. 5. Agenda: prioritizedand list facts created by in thethe inference en- of the have its own adatabase stay memory Fig. 4. Class and child Class for fact of Pipe object Therefore, through which facts engineduring ofa mechanism instances of was rules whose patterns satisfied CLIPS its active staterequired only. As soon are as the CLIPS are inserted into thefact-list. memory from the database and viceby factsis inclosed the enable (i) CLIPS to be embedded in other software platforms, vironment all facts are removed from its memory. versa. This was achieved through creation of classes and sub4. Class child Class forCLIPS. fact ofIn Pipe and calling external functions from the object present order(ii)toFig. empower theand DSS with computational capabilities, Therefore, a mechanism was required through which facts CLIPS a factStudio drivenenvironment.CLIPS environment where has rulesbeen are fired classes in is Visual intestudy, integration of CLIPS within the Visual Studio.Net the MATLAB computing engine (for MATrix LABoratory) are inserted into the memory fromCLIPS the database and vicedepending the pattern matching. does notdriven have grated with upon Visual Studio through DLL. CLIPS is fact platform been accomplished through has been has integrated with the DSS in thisClipsNet.dll. study. The MATversa. wasonand achieved through creation and subits ownThis database facts matching stay in themechanism memory of ofofclasses the language works pattern theCLIPS facts. order to empower the DSS LAB engine incorporates the LAPACKwith and computational BLAS libraries capabilitie in active Visual Studio environment.CLIPS has envibeen inteduring its state only. Asfacts soonbased as the Itclasses is therefore necessary to insert onCLIPS certain temthe MATLAB computing engine MATrix whichMATLAB provides access to state of the art in (for software stan-LABorator 4.3 platform ronment is In closed, facts are removed from itsismemory. grated with Visual Studio through DLL. CLIPS is facttodriven plate only. CLIPSall the ”deftemplate” construct used dards for matrix The proposed uses study. stand The MA has beencomputation. integrated with the DSSDSS in this Therefore, a mechanism wasthen required through which CLIPS and SQL server are not vested with the capability to create a template which can be used to access fields by facts. language works on pattern matching mechanism offacts the alone COM created using MATLAB LABcomponents engine incorporates thethe LAPACK andcomBLAS librari are inserted into the memory from the database and viceperform complex mathematical computations. Therefore, in name. Main class of all factstois insert ’Fact’. facts To facilitate of temIt is therefore necessary based transfer on certain piler. Each of the COM components is used in the Visual provides to state of the art in software sta versa. This wasCLIPS through of in classes andused to order towhich empower the DSSaccess with computational capabilities, data from CLIPS toachieved Visual studio andcreation vice-versa particular plate only. In the ”deftemplate” construct is Studio.Net platform as a class that can perform mathematical dards for matrix computation. The proposed DSS uses sta sub-classes in Visual Studio environment. CLIPS has been the MATLAB computing engine (acronym for MATrix LABtemplate two child classes created eachfields of operations on data imported from SQL and restore derived create a only template which canhave thenbeen be used to for access by alone COM components created using the MATLAB com integrated with Visual Studio through DLL. CLIPS is fact oratory) has been integrated with the DSS in this study. The the object as Pipe, source node, demand node etc. Figure 4 results back to the ’.Net’ environment. name. Main class ofworks all facts is ’Fact’. To facilitate transfer of driven language that on pattern matching mechanism MATLAB engine incorporates the LAPACK and BLAS piler. Each of the COM components is usedli-in the Visu shows two child classes for pipe object of WDN. First child data tocaptures Visual studio and vice-versa in particular of thefrom facts.CLIPS It is therefore necessary to insert factsofbased on braries, which provide access to astate-of-the-art softwaremathematic class (”DRAFPipe”) the value of each the slot Studio.Net platform as class that caninperform 4.4 Hydraulic Network Solver template only twoonly. child classes been created a certain template CLIPS, theFigure “deftemplate” con-each of standards for matrixon computation. The proposed DSS (”pipe−id”, ”snode” etc), In as shownhave in 4, value for from operations data imported from SQL anduses restore deriv the object source demand node Figure 4 possibility struct is used toPipe, create a template which can then be etc. used to standalone COM components created using the MATLAB database or as user through usernode, interface. Second child class The of linking public domain network solver, results back to the ’.Net’ environment. access fields by name. Main ofobject all isWDN. “Fact”. To child compiler. Each of the1993) COMthrough components is used in the Vishows two saves child classes forclass pipe First (”DRPipe”) the captured values in facts theof format defined EPANET (Rossman, DLL was examined and facilitate transfer of data from CLIPS to Visual Studio and sual Studio.Net platform as a class that can perform matheby template. it was felt that an in-built solver would be economical in class (”DRAFPipe”) captures the value of each of the slot 4.4 Hydraulic Network Solver vice-versa in particular template, only two classes have matical on data importedbased from on SQL restore The chaining mechanism is programmed fire from terms ofoperations computer time. Therefore, theand Todini and (”pipe−id”, ”snode” etc),ofasCLIPS shown inchild Figure 4, tovalue been if created for each of matches the objects asof pipe, node, dederived resultsand back to the1988) “.Net” environment. rules theor inserted fact the source already existing Pilati (Todini Pilati, improved gradient method, a database user through userany interface. Second child class The possibility of linking public domain network solv 4 shows two child classes for pipe mand node, etc. Figure facts. Further, for CLIPS to become operational as an ES Hydraulic Network Solver was developed in MATLAB and (”DRPipe”) saves the captured values in the format defined EPANET (Rossman, 1993) through DLL was examined a objectfollowing of WDN. two Firstkinds child class (“DRAFPipe”) capturesThe the shell, of integration are required. incorporated in network Visual Studio.Net through a COM compo4.4 Hydraulic solver by template. it was felt that an in-built solver would be economical value of each of thefor slots (“pipe id”, “snode”, etc.), as shown interface required such an integration to be possible ennent. The chaining mechanism of CLIPS is programmed to fire The possibility linking public network terms ofofcomputer time. domain Therefore, basedsolver, on the Todini a in Fig. 4, values from database or user through user interface. able (i) CLIPS to be embedded in other software platforms; EPANET (Rossman, 1993), through DLL was examined and method rules if the inserted fact matches any of the already existing Pilati (Todini and Pilati, 1988) improved gradient Second child class (“DRPipe”) saves the captured values in 4.5 Open Source GIS Platform and (ii) calling external functions from CLIPS. In the present it was felt that an inbuilt solver would be economical in terms the format defined by template. facts. Further, for CLIPS to become operational as an ES Hydraulic Network Solver was developed in MATLAB a study, integration of CLIPS within the Visual Studio.Net of computer time. Therefore, based on the Todini and proMapWinGIS is an open GIS and an application The following chaining CLIPS is programmed to fire The shell, two kindsof of integration are required. platform has beenmechanism accomplished through ClipsNet.dll. incorporated in source Visual Studio.Net through aPi-COM comp lati (1988) interface improved(API) gradient method,under a hydraulic network gramming distributed the Mozilla Pubrules if the inserted fact matches any of the already existinterface required for such an integration to be possible ennent. solver was developed MATLAB and incorporated Framein Vilic License (MPL) wasinbuilt upon the Microsoft.Net ing facts. Further, CLIPS to become operational an 4.3 MATLAB platform able (i) CLIPS to for be embedded in other softwareasplatforms; sual through a COM component. workStudio.Net 2.0. The MapWinGIS components and end user appliES shell, the following two kinds of integration are required. 4.5 Open Source GIS Platform and (ii)and calling external functions from CLIPS. In thetopresent CLIPS SQL serverfor is such not vested with thetocapability cation support manipulation, analysis, and viewing of geoThe interface required an integration be possible study, integration of CLIPScomputations. within the Visual Studio.Net perform complex mathematical Therefore, in spatial data in many standard GIS data formats. Hence, Map-
platform has been accomplished through ClipsNet.dll. www.drink-water-eng-sci.net/4/37/2011/
4.3
MATLAB platform
MapWinGIS is an open source GIS and an application pr Water Eng. Sci., 4, 37–50, gramming Drink. interface (API) distributed under2011 the Mozilla Pu lic License (MPL) was built upon the Microsoft.Net Fram work 2.0. The MapWinGIS components and end user app
42 4.5
K. Sandeep and K. Rakesh: CLIPS based decision support system Open source GIS platform
MapWinGIS is an open source GIS and an application programming interface (API) distributed under the Mozilla Public License (MPL) that was built upon the Microsoft.Net Framework 2.0. The MapWinGIS components and end user application support manipulation, analysis, and viewing of geo-spatial data in many standard GIS data formats. Hence, MapwinGIS is a mapping tool, a GIS modelling system, and a GIS API in a re-distributable open source. Further, and importantly, the creation, visualization, and manipulation of the shape files of various constituent elements of the study network have been achieved through integration of “ax-Map object” of MapWinGIS with Visual studio.Net. 5
DSS modules
The DSS being developed has modules on calibration, simulation, planning, and daily run. 5.1
Network calibration module
Various automatic network calibration algorithms have been proposed in the literature and include: (i) methods based on analytical equations (Walski, 1983); (ii) simulation models (Boulos and Ormsbee, 1991; Gofman and Rodeh, 1982; Ormsbee and Wood, 1986; Rahal et al., 1980); and (iii) optimization methods (Coulbeck and Orr, 1984; Ormsbee, 1989). Techniques based on analytical equations require significant simplification of the network through skeletonizations. As a result, such techniques may only get the user close to the correct results. Conversely, both simulation and optimization approaches take advantage of using a complete model. In the recent past, the focus of researchers has shifted from traditional analytical techniques to heuristic techniques such as Genetic Algorithm (GA), Simulated Annealing (SA), Shuffled Frog-Leaping Algorithm (SFLA), and Ant Colony Optimization (ACO). Performance of ACOA, as a class of optimization techniques, has been quite encouraging and this technique has often been seen to outperform other heuristicsbased approaches when applied to some benchmark problems (Maier et al., 2003; Zecchin et al., 2005). Considering that the calibration process involves adjustment of some key system parameters like nodal demands and/or pipe-roughness values, prior knowledge of their rational values can act as a heuristic in stochastic search procedures such as GA and ACOA. In this study an automated calibration algorithm was developed for WDN and has been incorporated in the proposed DSS. The calibration algorithm has been designed using ACO approach and searches for optimal hydraulic performance by adjusting internal pipe roughness as a calibration parameter. As an aid, the algorithm has been designed to use age of the network pipes as Drink. Water Eng. Sci., 4, 37–50, 2011
prior information (PI) for guiding the search (Kulshrestha et al., 2011). Accordingly, and in line with the foregoing discussion, a Calibration Module has been developed as an intrinsic component of the DSS. The calibration process has been developed based on ACO algorithm and systematically adjusts the Hazen Williams C-values in order to tune the hydraulic performance of the model, as expressed in terms of the derived distribution of nodal heads and link flows, with the network observations on corresponding state variables. The use of prior information (PI) on age and diameter of the various network components has been studied extensively in the study and is shown to aid the calibration process significantly. A detailed discussion on the development of the ACO-based calibration algorithm along with its evaluation and detailed sensitivity analysis is described separately in (Kulshrestha et al., 2011). The paper also presents a comparison of its performance with that of a MATLAB-based implementation of GA-based algorithm as well as the industry standard DARWIN CALIBRATOR of Benteley Systems, USA. The significance of the role of some of the key parameters of the designed calibration algorithm in the calibration process has been studied extensively and their respective significance established on the basis of a detailed parametric study as reported in (Kulshrestha et al., 2011). The calibration algorithm parameters that have been the subject matter of scrutiny in the latter study include (along with their respective derived best values): (i) decision control parameters (α = 1.0 and β = 0.3); (ii) initial pheromone value, τ0 = 200; (iii) pheromone persistence factor, ρ = 0.95; (iv) pheromone Reward factor, R = 200; (v) number of ants, m = 10; and (vi) maximum number of iterations, n = 200. Basic working of the calibration module is shown in Fig. 5. Observations on the state variables of link flows (Q) and nodal heads (H) at different loading conditions are taken as input parameters. The study network is calibrated using ACOA with one set of observed boundary conditions and then validated with another, but independent, set of boundary conditions. The calibrated network is saved in the RDBMS for scenario generation in response to various unforeseen, but hypothetical, design interventions that may be necessitated in the foreseeable future. 5.2
Simulation module
A typical network simulation model is comprised of static asset information such as pipe lengths, diameters, connectivity, and network topography. In addition to the static information, the model is also armed with information about dynamic attributes that are expected to change with time. These include distribution of water demand across the network and, importantly, direct or indirect measures of growth in pipe roughness with age, amongst others. Most contemporary modelling packages utilize models that include every pipe down to the level of, but not including, customer www.drink-water-eng-sci.net/4/37/2011/
K. Sandeep and K. Rakesh: CLIPSSupport based decision support system kulshrestha,S.: CLIPS based Decision System kulshrestha,S.: CLIPS based Decision Support System
43
77
User UserInterventions Interventions in Pipes Pipes
User Interface
User Interface
DemNodes Nodes Dem
Pumps Pumps
Valves Valves
Knowledge Base Of
One Complete One Complete Scenario
Knowledge Base Of Expert System Expert System
Scenario
Issues Advice / Warning Issues Advice / Warning
Is
YES
Scenario Is Existing Scenario Existing
YES
Inference Engine
InferenceOf Engine Expert Of System Expert System Pipe Flows & Nodal Heads Pipe Flows & Nodal Heads
NO
NO
Network Solver
Network Solver Details of Existing scenario Shown to USER
Details of Existing scenario Shown to USER
Figure 5. Schematic of calibration module.
Fig. 5. Schematic of Calibration Module
Fig. 5. Schematic of Calibration Module service pipes. Standard daily time-varying demand relationships different makes customer types,and anddecision these ety of are dataestimated generatedfor sometimes analysis are summed and allocated at pipe junctions (nodes) accordmaking tedious. ety of ing datatogenerated sometimes makes analysis and decision distribution of customers. Thethe simulation module of the Simulation proposed models DSS isare demaking tedious.used to simulate flows and pressures over a fixed normally signed to enable simulation studies for planning enhanceh period (Machell 2010) and are usually vested with The24 simulation module the as proposed DSS isnetwork dements/upgrades for et theal.,of WDN well as solving the capability to generate a great number of reports. The varisignedproblems. to enableTosimulation studies for planning enhancemeet service standards for a growing and inety of data generated sometimes makesasanalysis andnetwork decision ments/upgrades for the WDN as well solving creasingly fastidious population, it becomes imperative to making problems. Totedious. meet forofa the growing and inadd newer areasservice under standards the coverage distribution netThe simulationpopulation, module of itthe proposed DSS is decreasingly fastidious becomes imperative to or work or, in some situations, either add a new parallel link signed to enable simulation studies for planning enhanceadd newer areas under the coverage of the distribution even replace an existing smaller diameter pipe with anetlarger ments/upgrades for the WDN as well as solving network diameter pipe. Simulation study can examine work or, in some situations, either addona WDN new parallel link orthe problems. To meet service standards for a growing and inimpact of proposed or even a hypothetical intervention even replace an any existing smaller diameter pipe with a largerto creasingly fastidious population, it becomes imperative and,pipe. uponSimulation recall fromstudy the memory bank ofexamine the DSS,thecan diameter on WDN can add newer areas under the coverage of the distribution netguide theinproposed network managers similar interventions impactwork of any or eveneither awhenever hypothetical intervention or, some situations, add a new parallel link or are deemed to be desirable in future. and, upon recall an from the memory bank ofpipe thewith DSS, can even replace existing smaller diameter a larger 6 shows schematic of the pipe. A the simulation study on simulation WDNinterventions can module. examine It guide diameter theFigure network managers whenever similar merits mention a suggested change in the network conthe impact anythat proposed or even a hypothetical intervenare deemed to beofdesirable in future. figuration constitutes a valid scenario and may already exist tion and, upon recall from the memory bank of the DSS, can Figure 6 shows the schematic of the simulation module. It in the the knowledge after having been generated following networkbase managers whenever interventions meritsguide mention thatIna such suggested change insimilar the network cona prior query. a case, the user has the option to either are deemed to be desirable in future. figuration constitutes a valid scenario and may already exist evaluate scenario details or,ofinthe thesimulation event the module. information Figure the 6 shows the schematic It in the merits knowledge base afterinhaving been generated is not already the knowledge infollowing the absence mentionpresent that a suggested change inbase the network cona priorfiguration Inconstitutes such a case, theascenario user hasand the option to either ofquery. any past interest ina such scenario, themay network solver valid already exist is evaluate theknowledge scenario details or,having inheads. thebeen event the information triggered for flows andafter nodal Thegenerated values offollowing pipe flows in the base is not aand already present in the knowledge base inoption the absence nodal heads are asserted asuser factshas in the inference engine prior query. In such a case, the to eitherof of anyevaluate past interest in such a scenario, theevent network solver is to CLIPS which fires certain rules issue Advice/Warning the scenario details or, intothe the information is already present in the knowledge baseitsof incorresponding the absence thenot user. The and Advice/Warning along with triggered for flows nodal heads. The values pipe flows of any past interest in such a scenario, the network solver scenario is added to the Knowledge Base of the DSS and nodal heads are asserted as facts in inference engine as ofisan triggered for flows and nodal heads. The values of pipe flows reference rendering the DSS astodyCLIPSupgrade which for firesfuture certain rules tothus issue Advice/Warning namic amenable to up gradation/augmentation. In order the user. Theand Advice/Warning along with its corresponding to facilitate delivery of existing (previous memory) and curscenario is added to the Knowledge Base of the DSS as an www.drink-water-eng-sci.net/4/37/2011/
upgrade for future reference thus rendering the DSS as dynamic and amenable to up gradation/augmentation. In order to facilitate delivery of existing (previous memory) and cur-
Figure 6. Schematic of simulation module of the DSS.
Fig. 6. Schematic of Simulation module of the DSS
and nodal heads are asserted as module facts inof inference Fig. 6. Schematic of Simulation the DSSengine of CLIPS, which fires certain rules to issue Advice/Warning to (user information, namely therent user. Theinterventions) Advice/Warning along withtwo its templates corresponding ’memory’ and ’user’ are created in CLIPS. scenario is added to the Knowledge Base of the DSS as an rent (user interventions) information, two templates namely upgrade for future reference, thus rendering the DSS as dy’memory’ and ’user’toare created in CLIPS. namic amenable upgradation/augmentation. In order 5.3 and Planning Module to facilitate delivery of existing (previous memory) and cur5.3 Planning Module rent (user interventions) information, two of templates, namely Planners carefully research all aspects a water distribution “memory” and “user”, are created in CLIPS. system and try to determine which major capital improvePlanners carefully water distribution ment projects are research necessaryalltoaspects ensure of theaquality of service system and try to determine which major capital improvefor the future. This process, called master planning (also re5.3 Planning module ferred to as capital improvement planning comprehensive ment projects are necessary to ensure the or quality of service Planners carefully research allproject aspects system a water distribution planning), may be used to growth and(also waterrefor the future. This process, called of master planning system and try to determine which major capital improveusagetofor next 5, 10, or 20 years. Systemorgrowth may ocferred asthe capital improvement planning comprehensive ment are necessary growth, to ensureannexation, the qualityacquisition, of service or cur projects because of population planning), may be used to project system growth and for the future. This process, called master planning (also re-water wholesale agreements water System supply utilities usage forasthe next improvement 5, 10,between or 20 years. growth(Walski may ocferred to capital planning or comprehensive et al ., 2001). cur because of population growth, annexation, planning), may be used to project system growth acquisition, and water or andyears. a consequent increase interwholesale agreements between water supply utilities (Walski usageThe for ageing the nextof5, pipes, 10, or 20 System growth mayinocnal pipe roughness, is always accompanied by loss of cural because of population growth, annexation, acquisition, orconet ., 2001). veyance. Such a scenario is indeed realistic and(Walski confronts wholesale agreements between supply utilities The ageing of pipes, and water a consequent increase in interall water supply networks. In water utility practices, Hazenet al., 2001). nal pipe roughness, is always accompanied by loss of conWilliams C-factor is the most commonly used parameter to The ageing of pipes, and a consequent increase in interveyance. Such a scenario isofindeed realistic and confronts internal roughness water mains nalrepresent pipe roughness, is always accompanied byand lossbyofextension conalltheir water supplycapacity networks. internal In waterroughness utility practices, Hazencarrying water mains veyance. Such a scenarioand is indeed realistic andofconfronts Williams C-factor is the most commonly used parameter et al., networks. 1988) andInthe present study has also adoptedto all(Walski water supply water utility practices, Hazenrepresent internal roughness of water mains and by extension this approach. grows linearly Williams C-factor The is thepipe mostroughness commonly used roughly parameter to their capacity roughness water mains withcarrying time and the rateand ofofinternal roughness growth, a,extension is strongly represent internal roughness water mains and byof influenced by the pHand ofinternal water (roughness For CI pipes ) and the cor(Walski et al., 1988) and the present study also adopted their carrying capacity ofhas water mains responding growth of roughness mayadopted be written this approach. The for pipe grows roughly linearly et al., model 1988), and theroughness present study has also (Walski as approach. (Colebrook andpipe White., 1937): grows this roughness roughlya,linearly with time and The the rate of roughness growth, is strongly
influenced by the pH of water ( For CI pipes ) and the core = eo + atmodelDrink. (1) responding for growth of roughness may be written Water Eng. Sci., 4, 37–50, 2011 as (Colebrook and White., 1937): e = e + at
(1)
8 44
K. Sandeep and K. Rakesh: CLIPS decision support kulshrestha,S.: CLIPSbased based Decision Support system System
with time and1,the ratetheof absolute roughness growth, a, is strongly In equation e is roughness height, (L); influenced by the pH of water (For CI pipes).blackboxbf eo is the initial roughness height,(L); a is the growth rate sentence break created here The corresponding model for in roughness height,(L/T); and t is the time variable,(T). growth of roughness may be written as (Colebrook and Using Colebrook-White (Colebrook and White., 1937) and White, 1937): Swamee-Jain (Swamee and Jain, 1976) approximations, Hazen-Williams e = eo + at CHW may respectively be written as (Wal(1) ski et al., 1988). In Eq. (1), e is the absolute roughness height, (L); e0 is the initial height, (L); a is the growth rate in roughness CHW =roughness 18.0 − 37.2log(X) (2) height, (L/T); and t is the time variable, (T ). Using Colebrook 1.08 CHW = 33.3|log(0.27X)| (3) (1937) and Swamee and Jain (1976) approximaand White tions, Hazen-Williams CHW may respectively be written as where, X = (e1988). (Walski et al., 0 + at)/D and D is the diameter of pipe. The relationship between the annual roughness growth CHW = 18.0 37.2 log(X) (2) rate, a, and the − Langelier saturation index (LI) with the latter controlled by factors such 1.08 as the pH of water, its alkalinity, CHW = 33.3|log(0.27 (3) and calcium content canX)| be represented as equation 4 Lamont (1981). where X = (e0 + at)/D and D is the diameter of pipe. The relationship between the annual roughness growth rate (a) and a= 10−(4.08+0.38LI) f orLI < 0 (4) the Langelier saturation index (LI), with the latter controlled by factors of and water, alkalinity, and pipe, calcium Given thesuch age as of the the pH pipe its its diameter of old it content, can be represented as Eq. (4) (Lamont, 1981): is possible to obtain an estimate of the Hazen-Williams C-
factor. Based upon the above theoretical account, as the sysa = 10−(4.08+0.38LI) for LI < 0 (4) tem under goes ageing process, following things are expected to happen Given for theany ageWDN: of the pipe and its diameter of old pipe, it is possible to obtain an estimate of the Hazen-Williams C1. With age of the WDN, the Hazen-Williams C-value will factor. Based upon the above theoretical account, as the sysreduce. tem undergoes the ageing process, the following things are expected to happen head for any WDN: 2. The consequent loss in the WDN would increase. With ageenergy of the requirement WDN, the Hazen-Williams C-value will 3.1.The total in the WDN for the same reduce. input parameters would as well increase. 2. The consequent loss in the WDN will itincrease. Therefore, from the head management perspective, is important3. to The be forewarned on these changes and, at the same total energy requirement in the WDN for thetime, same know in advance the manner which its consequences are input parameters will asinwell increase. likely to manifest. As an example, the proposed Planning Therefore, fromHazen-Williams the managementC-values perspective, it is imporModule estimates expected over tant totime be forewarned changes at the time, various horizons ofon5,these 10, 15 and 20and, years and,same for each know in advance the manner in which its consequences are such horizon, additionally computes (i) total energy requirelikely(ii)tototal manifest. Asacross an example, the proposed ment; head loss the network; (iii) headplanning loss in module estimates C-values expected over each individual pipe;Hazen-Williams and (iv) temporal variation of Hazenvarious time horizons of 5, 10, 15, and 20 years and, for each Williams C-values. such additionally computes (i) total energya requireThe horizon, module further, has the capability to present graphment, (ii) total head loss across the network, (iii) head loss in ical depiction of the above information besides populating pipe, and (iv)Expert temporal of Hazentheeach dataindividual bases of the proposed DSS.variation The schematic of Williams C-values. planning Module is shown in Figure 7. The module further has the capability to present a graphdepiction the above information besides populating 5.4ical Daily RunofModule the databases of the proposed expert DSS. The schematic of planning module is shown in Fig.operators 7. Many water utilities use human whose primary function is to monitor the pulse of the water distribution system and provide system control when needed. Automated control is increasingly becoming the preferred option and uses instrumentation and control equipment to control the Drink. Water Eng. Sci., 4, 37–50, 2011
Input Parameters
Pipes D.Nodes
PLANNING HORIZON
S.Nodes Pumps 0 years
5 years
10 years
15 years
20 years
Residual Head SEVERITY OF ATTACK (LI)
Hazen‐Williams C‐values
HYDRAULIC NETWORK SOLVER
For each planning Horizon • Total Head loss • Head loss in each Pipe • Flow in each Pipe • Head at each Node • Total Energy Requirement
Figure 7. Schematic of planning module. Fig. 7. Schematic of Planning Module
5.4
Daily run module
distribution automatically. Such control canprimary be imMany watersystem utilities use human operators whose plemented either locally at the facility or throughout the sysfunction is to monitor the pulse of the water distribution system. Typically, simple operating rules are used to determine tem and provide system control when needed. Automated which is operated and how. Systems that relyand on controlcomponent is increasingly becoming the preferred option advanced control use optimization algorithms, DSS, AI, or uses instrumentation and control equipment to control the control logic to control the distribution system. It becomes distribution system automatically. Such control can be imclear that for thislocally paradigm be realistic, the actual sysplemented either at thetofacility or throughout the system operation, in terms of its numerous diagnostic attributes, tem. Typically, simple operating rules are used to determine need tocomponent be monitored continuously and Systems logged for which is operated and how. thatprospecrely on tive reference. The proposed design of the DSS uses Daily advanced control use optimization algorithms, DSS,aAI, or Run Module (DRM) that logs these operational attributes control logic to control the distribution system. It becomes inclear order be this able paradigm to offer diagnostic inferences fromsysthe thatto for to be realistic, the actual logged daily runs. Figure 9 depicts a selected screen shot of tem operation, in terms of its numerous diagnostic attributes, DRM . As shown in Figure 8, this module has subordinate needs to be monitored continuously and logged for prospeccomponent sub-modules for the following tasks:uses (i) retrieve tive reference. The proposed design of the DSS a Daily status of the study network on some previous date and time Run Module (DRM) that logs these operational attributes in (order Sub-Moduledaily run scenario given to be ableI); to (ii) offergenerate diagnostic inferences fromfor the alogged set of runs. input Figure conditions (Sub-Module-II); and shot (iii) of diagnose 9 depicts a selected screen DRM. daily specific consumer complaints (Sub-Module-III). A brief note As shown in Fig. 8, this module has subordinate component on each of these sub-modules follows: sub-modules for the following tasks: (i) retrieve status of the study network on some previous date and time (Sub-ModuleSub-Module-I : Refer Figure 9for with dottedsetcircle ”I”. I);– (ii) generate daily run scenario a given of input Each daily run history, for a given set of input condiconditions (Sub-Module-II); and (iii) diagnose specific contions, is stored(Sub-Module-III). in the knowledgeAbase the on DSS. sumer complaints briefofnote eachThe of of the WDN corresponding to any given date and thesestatus sub-modules follows: time can be retrieved with the help of the Graphical User – Interface Sub-Module-I: refer to Fig. 9 of with dotted circle “I”. and runs independent CLIPS inference enEach daily run history, for a given set of input condigine. tions, is stored in the knowledge base of the DSS. The – Sub-Module-II: Refer Figure 9 with dotted circle www.drink-water-eng-sci.net/4/37/2011/
Fig. 10
kulshrestha,S.: CLIPS based Decision Support System K. Sandeep and K. Rakesh: CLIPS based decision support system Fig. 8. Different modules of Daily Run Module
45
Compare Reservoir levels No: Rule4
I
Check Pump status
OK: Rule5
II
Problem at WTP Attend Pumps Immediately
Check Electricity status OK: Rule7
Daily Run Scenario
SUB- MODULE III
No Action Required
OK: Rule3
No: Rule6
SUB- MODULE II
OK: Rule1
No: Rule2
Retrieve Status of WDN some previous date & time
DAILY RUN MODULE
Compare Flows and Heads
SUB- MODULE I
Problem at Consumer En
No: Rule8
III
Supply will resume in next cycle
Consumer Complaint Diagnostics and Management based Decision Support System kulshrestha,S.: CLIPS
Figure 8. Different modules of Daily Run Module.
Fig. 8. Different modules of Daily Run Module
Figure 9. Screen shot of Daily Run Module of DSS showing sub9 10.shot Working ofRun CLIPS for Sub-ModuleII modules. Fig. 9. Fig. Screen of Daily Module of DSS showing submodules
Fig. 11
OK: Rule1
Compare Flows and Heads No Action Required m SUB- MODULE I given date and status of the WDN corresponding to any No: Rule2 ”II”.This sub-module assists a network manager in asOK: Rule3 Retrieve Status of WDN an time can be retrieved with the help Compare Reservoir Problem at WTP certaining statuslevels of the network corresponding to opersome previous dateof & the timegraphical user th No: Rule4 interface (GUI) and runs independent of CLIPS inferator specified inputsOK:on source node levels, pump and Rule5 th Check Pump status Attend Pumps Immediately ence engine. electricity status. There is also an option available that DAILY RUN No: Rule6 in SUB- MODULE II allows comparison between observations on linkEnd flows OK: Rule7 Check Electricity status Problem at Consumer MODULE to – Sub-Module-II: refer to Fig.Run 9 Scenario with dotted circle “II”. Daily No: Rule8 and nodal heads, provided to the sub-module as prior ic in ascerIThis sub-module assists a network manager specified data, and incorresponding computed values as II Supply will resume next cycle taining status of the network corresponding to operaad output from the network solver. The comparison is tor specified inputs on source node levels, SUBMODULE III pump, and made by the Inference Engine of CLIPS, shown in Figelectricity status. There is also an option available Consumer Complaint Figure Working CLIPS forby Sub-Module II. of appropriate ure10.10, and isoffollowed generation Diagnostics and Management that allows comparison between observations on link 6 Ca caution and/or advice. The Inference Engine fires rules flows and nodal heads, provided to the sub-module as Fig. 10. Working of CLIPS for Sub-ModuleII at each decision stage, identifies cause and also proprior 6 Case study III specified data, and corresponding computed valThe pr poses action using the backward chaining mechanism. ues as output from the network solver. The compariisting Figure 10 presents ”if else” rule firing under different son modules is made of byDaily the inference engine of CLIPS, shown Fig. 8. Different Run Module The proposed application has been implemented on an exVasant scenario with message details. For example, if comparin Fig. 10, and is followed by generation of appropriisting water distribution network that services a segment of Delhi. ison of flows and heads with normal values is found OK ate caution and/or advice. The inference engine fires Vasant Vihar (identified as Blocks “D”, “E”, and “F”) in New having then message ” No Action Required” is popped up othrules at each decision stage, identifies cause, and also The11. study area is a predominantly area 111 pip Fig. 9. Screen shot of Daily Run Module of DSS showing sub-Delhi. Fig. New Project form of ES residential erwise, ”Rule 2” is fired and reservoir levels are comproposes action using the backward chaining mechahaving a total population of 21 000. The network consists of on the modules pared. nism. Figure 10 presents “if else” rules firing under 111 pipes and 86 demand nodes. Processing any new project is don I different scenarios with messageIIdetails. For example, on–the proposed ES platform with data formatting and Sub-Module-III: This isbegins the Daily Diagnostic Module ure 11 if comparison of flows and heads with normal values module uses backward chaining process for inferen is done invoking the to “New Network” stream of DSS. Figand is designed manage consumer complaints. The pertain ”II”.This assists“No a network managerisin as-ure 11 shows “New Project” form of DSS for formatting data is foundsub-module OK, then message Action Required” and starts by first identifying the consumer in term certaining status of the network corresponding to oper-pertaining to WDN. popped up; otherwise, “Rule 2” is fired and reservoir the network segment that he/she belongs to. Rule levels are compared. ator specified inputs on source node levels, pump and By clicking “Add Base Map” button, the JPEG file of the
this module are similar to those shown in Figure 10. desired network can be loaded on the form which would electricity status. There anDiagnostic option available – Sub-Module-III: This is is thealso Daily Module that III ing backward chaining mechanism, CLIPS is desig facilitate creation of shape files. Source Node, Demand allows comparison observations on link and is designed to between manage consumer complaints. Theflows to identify possible cause of the complaint and, as a andmodule nodal uses heads, provided to the sub-module as priorNode, Pumps and Valves are added as nodes on the shape backward chaining process for inferencing ical follow also as suggests file “node.shp”. A pipe up, is added line in appropriate the shape file measures t and starts by first the consumer in terms of as specified data, andidentifying corresponding computed values “pipe.shp”. Upon conclusion of thisthe task,situation. the project network adopted to manage the network segment that he/she belongs to.comparison Rules for output from the network solver. isis11. then processed as ”Existing Fig. 9. Screen of Daily Run Module of shown DSS The showing sub-Us- Fig. New Project form of ES Network” in DSS. thisshot module are similar to those in Fig. 10. by the Inference Engine of CLIPS, shown in Figmodules made ing backward chaining mechanism, CLIPS is designed ure to10, and possible is followed bythegeneration of asappropriate identify cause of complaint and, a log6.1 Calibration 6 Case Study caution and/or The Inference ical follow up,advice. also suggests appropriate Engine measuresfires to be rules module uses backward chaining process for inferencing ”II”.This sub-module assists a network manager in asThe DSS adopts an optimization approach for calibraadopted to manage the situation. at each decision stage, identifies cause and also pro- and starts by first identifyingbased the consumer in terms of certaining status of the network corresponding to opertion and is enabled by the state-of-the-art ant colony optiThe proposed application has been implemented on an the network segment that he/she belongs to. Rules for poses action using the backward chaining mechanism.mization algorithm (ACO). As an added novelty, the calator specified inputs on source node levels, pump and isting water distribution network that services this module are similar to those shown in Figure 10. Us- a segme Figure status. 10 presents ”ifalso else” rule firing under electricity There is an option available thatdifferentibration algorithm is also designed to accommodate prior ing backward chaining mechanism, CLIPS is designed Vasant Vihar, (identified as Blocks ’D’, ’E’ and ’F’), in scenario with message For example, if comparallows comparison between details. observations on link flows to identify possible cause of the complaint and, as a logDelhi. The study area is a predominantly residential ison of heads, flows and headstowith values is found OK and nodal provided the normal sub-module as prior www.drink-water-eng-sci.net/4/37/2011/ Drink. Waterappropriate Eng. Sci., 4,measures 37–50, 2011 ical follow up, also suggests to be having a total population of 21,000. The network consis then message No Action Required” popped specified data, and” corresponding computedisvalues as up othadopted to manage the situation. 111 pipes and 86 demand nodes. Processing any new pro output from”Rule the network solver. comparison erwise, 2” is fired and The reservoir levels isare comon the proposed ES platform begins with data formatting made by the Inference Engine of CLIPS, shown in Figpared.
Supply will resume in next cycle
kulshrestha,S.: CLIPS based Decision Support System
nt
wing sub-
46 Fig. 10. Working of CLIPS for Sub-ModuleII
K. Sandeep and K. Rakesh:CLIPS CLIPS based decision supportSupport system kulshrestha,S.: based Decision
System
Figure 11. New Project form of ES. 10
kulshrestha,S.: CLIPS based Decision Support System
Fig. 11. New Project form of ES
module uses backward chaining process for inferencing Fig. 13. Calibration result for Vasant Vihar WDN er in asFigure 13. Calibration result for Vasant Vihar WDN. and starts by first identifying the consumer in terms of to operthe network segment that he/she belongs to. Rules for ump ot ofandthe Calibration Module this module are similar to those shown in Figure 10. UsFig. 13. Calibration result for Vasant Vihar WDN able that ing backward chaining mechanism, CLIPS is designed nk flows to identify possible cause of the complaint and, as a loghot of the Calibration Module as prior ical follow up, also suggests appropriate measures to be values as Add Base Map” button, thetheJPEG file of the adopted to manage situation. arison is n can in Fig-be loaded on the form which would propriate n ofBase shape files.button, Source Demand Add Map” the Node, JPEG file of the 6 Case Study res rules
nd Valves are added as nodes the shape can on the form on which would also pro-be loaded The proposed application has been implemented chanism. Aofpipe is added line inNode, the shape file on an exon shape files. asSource Demand isting water distribution network that services a segment of ndifferent conclusion of this task, the project network nd Valves are added as nodes on the shape Vasant Vihar, (identified as Blocks ’D’, ’E’ and ’F’), in New comparFigure 12. Screen Shot of the Calibration Module. Delhi. The study area is a predominantly residential area dound as ”Existing Network” in DSS. OK A pipeFig. is 12. added as line in the shape file Screen Shot of the of Calibration Module having a total population 21,000. The network consists of d up othn conclusion of this task, thenodes. project network 111 pipes and 86 demand Processing any new project are cominformation on age of the network components as a and guide on the proposed ES platform begins with data formatting n d as ”Existing Network” in DSS. leading the search process towards the desired optimality. As
Fig. 13. Calibration result for Vasant Vihar WDN
clicking ”Add button, the JPEG fileFigof the isBy done invoking the Base ”NewMap” Network” stream of DSS. shown in Fig. 12, calibration is initiated by prompting the desired network can be loaded onDSS thefor form which data would ure 11 shows ”New Project” form of formatting Module user to provide requisite information such as observed link an Optimization based approach for calibrapertainingcreation to WDN.of shape files. Source Node, Demand nts. n The facilitate Figure 14. Existing scenario results of Simulation module. flows and junction (these will form the basis for shape comNode, Pumps and heads Valves are added as nodes on the led by the state of the art Ant Colony Opparison between these values and model derived file ”node.shp”. A pipe is added as line in theoutputs). shape file14. Existing scenario results of Simulation module Fig. ithm. As”pipe.shp”. an added novelty, the calibration an Optimization based approach for calibraBefore proceeding for calibration, the groups not already available in the knowledge base are imbibed into Upon conclusion of this task, themodule project network pipes based on diameter and age and computes prior informait with a new, unique ID for possible future use. It is unoled designed to accommodate prior informais then processed Network” inOpDSS. by the state of theas ”Existing art Ant Colony tion on Hazen-William C-values for each such group based thatscenario the designresults of the proposed DSS hasmodule distinctive 14. derstood Existing of Simulation erithm. network components asthe a guide leading thequality ofFig. As6.1 added novelty, the calibration on an type of attack on pipes on account of wafeatures such as: (i) the knowledge base (KB) is continuously Calibration tiveC-features such as (i) the Knowledge Base(KB) is continowards the optimality. As and shownin ter. desired The calibration module derives assigns calibrated upgraded; and (ii) the knowledge base is dynamic. Figure 14 o designed to accommodate prior informavalues to adopts each and these results archived shown uously upgraded; and theresults Knowledge Base is dynamic. presents a screen shot(ii) of the propagated by simulation DSS an Optimization basedare approach is The initiated bypipe, prompting user to forascalibraeration network components as a guide the leading the 13 in Fig. mModule in terms of link flows and nodal heads with the lattion and is enabled by the state of the art Ant Colony Op- 14 presents a screen shot of the results propagated Figure by information such asoptimality. observed link flows and tive features such as (i) the Knowledge Base(KB) is continowards the desired As shownin Fig. 14. Existing scenario results of Simulation module ter being displayed in comparison with residual head. Also, timization Algorithm. As an added novelty, the calibration Simulation Module infigure terms link flows and nodal heads hese will form the basis for comparison uously the upgraded; and (ii)displays theofKnowledge Base is dynamic left part of the changes in pipes, demand is also designed to accommodate prior informabration isalgorithm initiated by prompting the userbeto 6.2 Simulation nodes, andbeing source thatshot make up athe particular scenario. with latter displayed inof comparison with residualby tion onsuch age ofas theobserved network components as proa and guide leading the the14 and model derived outputs). Before Figure presents a nodes screen results propagated ees information link flows tive features such as (i) the Knowledge Base(KB) is continThe CLIPS engine has been designed to be an ideal foil for Simulation studies are undertaken to diagnose problems search process towards the desired optimality. As shownin head. Also, Module the left in part of the figure displays changes in bration, Module groups pipes based on Simulation terms link flows heads these willthe form basis for comparison uously to upgraded; andan (ii) the of Knowledge Base isand dynamic. related WDN. As example, consider a scenario 1nodal in the simulation module and allows the tobeexploit Figure 12,the Calibration is initiated by DSS prompting the the userfull to pipes, demand nodes and source thatpropagated make upbya residua partice and computes prior information on HazenFigure presents a screen of results 15. 14 Initially, source nodeshot 501nodes isthe maintained at reservoir potentialderived of the latter module.such Each simulation is the Fig. with latter being displayed in comparison with provide requisite information as observed flows and ues and model outputs). Before pro-linkoutcome level of 2.5 m. At this condition head at node 20 was 8.90 m. checked for precedence, and only those scenarios that are Simulation Module in terms of link flows and nodal heads ular junction heads (these willon form the basis for comparison be-scenario. s for eachthe such group based type of attack head. Also, the left part of the figure displays changes in bration, Module groups pipes based on with the latter being displayed in comparison with residual tween these values and model derived outputs). Before proSimulation studies arepartundertaken diagnose problems account of quality of water. The Calibration pipes, demand nodes and source nodesto that make head. Also, the left of the figure displays changesup in a partice and computes prior information on Hazenceeding for calibration, the37–50, Module groups pipes based on Drink. Water Eng. Sci., 4, 2011 www.drink-water-eng-sci.net/4/37/2011/ related to WDN. As an example consider a scenario 1 in Figpipes, demand nodes and source nodes that make up a particand assigns calibrated C-values to each pipe ular scenario. and age based and computes priorof information s for eachdiameter such group on type attack on Hazenular scenario. William for such group based on type ofure attack15. Initially source node 501 is maintained at reservoir are archived asC-values shown ineach Figure Simulation studies are undertaken to diagnose problems account of quality of water. The 13 Calibration Simulation studies are undertaken to diagnose problems on the pipes on account of quality of water. The Calibration
level of 2.5 m. At this condition head at node 20 was 8.90m.
ual head required
ID: 20
12 m
8.9 m kulshrestha,S.: CLIPS based Decision Support System K. Sandeep and K. Rakesh: CLIPS based decision support system 100 mm
D: 135
D : 34
element/ parameter
Scenario 1 value
100 mm Source Node 501
2.5 m
Residual head required
12 m
Node ID: 20
8.9 m
Pipe ID: 135
100 mm
Pipe ID : 34
100 mm
ual head required
ID: 20
D: 135
Max head loss
Scenario 2 value Max head loss
2.5 m
WDN element/ parameter
12 m
Scenario 2 value
Source Node 501
2.5 m
13.61 Residual headm required
12 m
Node ID: 20
13.61 m
Pipe ID: 135
200 mm
200 mm
Fig. 16. Variation of flows and heads over PH Figure 16. Variation of flows and heads over PH. Fig. 16. Variation of flows and heads over PH
mm identification Figure 15. Scenario for problem Pipe 150 ID : 34 150and mm remedial measures.
Considering desirable residual head of 12.0 m at node 20, Fig. 15. Scenario for Problem Identification and Remedial Meanetworksures administrator proposes to change pipe diameters of pipe number 135 and 34 and (feeding to node 20) from existing ario for Problem Identification Remedial Mea100 mm to 200 mm and 150 mm, respectively. Since infrassuch scenario will be tried module issue tructureWhenever improvement work involves hugethecost, the shall simulaa message ”Similar scenario was earlier tried. Do you want tion module can be used to study the impact of such proposedto view the scenario?”. If user chooses ”Yes” then existing scechanges. It can be seen from Fig. 15 that head at node 20 nario details are populated otherwise scenario is processed as of will Vasant WDN improved to 13.61 (above residch scenario beVihar tried thehas module shall issue new scenario. ual head). The scenario can be saved for future milar scenario was earlier tried. Do you want to reference. Whenever scenario will be tried, the module shall is6.3 such Planning ario?”. If sue user chooses“Similar ”Yes”scenario then existing a message was earlierscetried. Do you Planning module of the DSS has been designed to give re populated scenarioIfisuser processed as then wantotherwise to view the scenario?”. chooses “Yes”, ex-an insight into the WDN’s performance over planning horizon. isting scenario details are populated; otherwise, scenario is Planning horizon has been taken as 20 years with a time step processed new (i.e. scenario. of 5asyears 5, 10, 15 and 20 years). The module is de-
g
47
e Node 501
D : 34
WDN element/ parameter
11
Fig. 17. Variation of Hazen-William C-values for different groups
signed to help network managers take guidance on decision Figure 17. Variation of Hazen-William C-values for different groups. tions. In this regard, the module derives strength based on its Fig. Planningability module of the DSS has been designed to give an 17. Variation of Hazen-William C-values for different groups to report the following: the DSS has been designed to give an
6.3
for replacement of pipes and up-gradation of pumping staPlanning
dule of insight into the WDN’s performance over planning horizon. e WDN’sPlanning performance over planning horizon. – Variation ofbeen Pipe flows and junction different horizon has taken as 20 years heads with aover time step planning Horizon(Figure 16). of 5 years 15, and 20 years). module is dezon has been taken(i.e. as5,2010,years with a timeThe step signed to help networkofmanagers take guidance – Variation Hazen-William C-values different e. 5, 10, 15 and 20 years). The module is de-onfordecisions for replacement of of pipes andover upgradation of pumping groups Pipes the different planning staHorip networktions. managers take the guidance on decision In thiszon(Figure regard, module derives strength based on its 17). ability to report the following: nt of pipes and up-gradation of pumping sta– Variation of Total Energy requirement in KW and toegard, the module derives strength based on different itsover the – Variation of pipe flows junction diftal head loss in theand system over heads the planning Horizon(Figure 18). ferent planning horizon (Fig. 16). rt the following: – Variation of Hazen-William C-values for different horizon
of Pipes over theover different planning n of Pipe flowsgroups and junction heads different (Fig. 17). Horizon(Figure 16).
– Variation of total energy requirement in kW and total head loss in the system overfor the different planning horiHazen-William C-values different zon (Fig. 18).
n of of Pipes over the different planning Horire 17). www.drink-water-eng-sci.net/4/37/2011/
n of Total Energy requirement in KW and toloss in the system over the different planning
6.4
Daily run
The DSS is built with a daily run module (DRM) and as already explained, this module consists of three sub-modules I, II, and III. Sub-Module-I prompts user to select date and supply time (for intermittent supply) for information on link flows and junction heads. For this already existing scenario, the presents as head depicted Fig.module 18. Variation of Totalinformation Energy and total loss in Fig. 8. The sub-modules II and III are tailored to invoke CLIPS inference engine to assert facts derived as a solution from the hydraulic network solver in its memory, and importantly, follow up with Advice/Suggestion/Warning as deemed appropriate as illustrated in Fig. 19. The daily tun module is also endowed with an important functionality in terms of its ability to manage consumer Drink. Water Eng. Sci., 4, 37–50, 2011
Fig. 17. Variation of Hazen-William C-values for different groups K. Sandeep 12 and K. Rakesh: CLIPS based decision support system
48
k
Condition
Message/ Warning/ Advice CLIPS working for Sub-Module II
If all Link Flows and Junction Heads normal
If Link Flows and Junction Heads not normal then Check Reservoir Levels. If Reservoir Levels not OK
12
Fig. 18. Variation of Total Energy and total head loss Condition
Contact Water Treatment Plant Managers for supply status
If Reservoir Levels Ok, check Pump Status. If there is any Pump failure
WDN Parameters were OK but there was pump failure. Please attend immediately
If Pump status Ok, check Electricity status. If Electricity status not OK
WDN Parameters were OK but there was Electricity failure. Please wait for next supply.
If Electricity status OK
Figure 18. Variation of Total Energy and total head loss.
No Action Required by Network Administrator
WDN Parameters were OK. There might be problem at consumer end.
Figure 19. Advice/Suggestion/Warning issued by CLIPS. Fig. 19. Advice/Suggestion/Warning CLIPS. kulshrestha,S.: CLIPS based issued Decisionby Support System
Fig. 20
Message/ Warning/ Advice CLIPS working for Sub-Module II
Flow in Pipe ID=71 is less than normal and
complaints. Consider, for example, the water reservoir Daily Run CLIPS is checking other details No Action Required by Network 6.4 If all Link Flows and Junction Heads normal information Administrator (ID 501) of the case study. The following is lodged: Contact Water Treatment Plant The DSS is built with a Daily Run Module(DRM) and as alIf Link Flows and Junction Heads not Managers for supply status normal then Check Reservoir Levels. If ready explained, this module consists of three sub-modules Reservoir Levels not OK 1. Reported head at the reservoir (ID 501) is 2.5 m instead Head at Source ID: 501 is less than required. I, II and III. Sub-Module-I prompts user to select date and WDN Parameters were OK but there If Reservoir Levels Ok, check Pump Status. Please check Water Supply at WTP of 3.0 m. was pump failure. Please attend If there is any Pump failure supply time (for intermittent supply) for information on link immediately flows and junction heads. For this, already existing, scenario, 2. Consumer with ID 3423 lodges a complaintWDN that “water Parameters were OK but there If Pump status Ok, check Electricity status. was Electricity failure. Please wait for the module presents information as depicted in Figure 8. The supply to the user has been less than normal”. If Electricity status not OK next supply. difference between u/s node:3 and d/s Sub-ModulesHead II and III are tailored to invoke CLIPS infernode:30 is more than expected. Please check WDN Parameters were OK. There 3. Reports of a pump failure have also been independently ence engine to asserts facts, derived as a solution from the might be problem at consumer end. If Electricity status OK status of Pumps or Electricity. lodged. hydraulic network solver, in its memory and, importantly, follows up with Advice/Suggestion/Warning as deemed ap4. There was no reported electricity failure. Figure 20.asMessages received for addressing consumer complaint. propriate illustrated in Figure 19. Fig. 20. Messages received for addressing consumer complaint Fig. 19. Advice/Suggestion/Warning issued by CLIPS. The Daily Run Module is also endowed with an important From the network configuration, it is seen that the comfunctionality in terms of its ability to manage consumer complainant is connected 6.4to Daily pipeRun ID 71 (u/s node 3 and 7 CONCLUSION plaints. Consider, for example, waterdirectly reservoir 501) d/s node 30). The CLIPS inference engine uses backward CLIPS inference engine has beenthe linked with(ID Visual The DSS is built with a Daily Run Module(DRM) and as alThe aim of the development of DSS was to design a comof the case study. The following information is lodged: chaining mechanism and reports appropriately reasoned diStudio.Net environment and indirectly with SQL and MATready explained, this module consists of three sub-modules prehensive operation and management aid for a water utilagnostic message as depicted in Sub-Module-I Fig. 20 which shows Such of thesetheseemingly diverse set of I, II and III. prompts user tosucselect dateLAB. and ity. Theinterlinking study potential application of instead 1. Reported headhasatdemonstrated the reservoir (ID 501) is 2.5 m cessive messages as would fromsupply) the consumer supply be timereceived (for intermittent for information oncomputing link platforms has resulted a multiplier effect and, CLIPS as a core component aroundinwhich such a manage3.0 m. could be built. Present work suggest that CLIPS and junction heads. For this, already existing, scenario, of ment complaint managementflows module. together, theaidstudy has been able to unlock the combined pothe module presents information as depicted in Figure 8. The is indeed a powerful platform for development of an Expert tential of such an application. In particular, thethat proposed 2. Consumer with ID 3423 lodges a complaint ”water Sub-Modules II and III are tailored to invoke CLIPS inferSystem. ence engine to asserts facts, derived as a solution fromframework the supply acquires a totally dynamic flavor where a waSupporting platforms like MATLAB, SQL, and Mapto the user has been less than normal”. 7 Conclusions hydraulic network solver, in its memory and, importantly, WinGIS have also integrated together under a common ter supply system canbeen be modelled, calibrated, and validated follows up with Advice/Suggestion/Warning as deemed apumbrellaofofaVisual Studio.Net the 3. its Reports pump failureenvironment. have also In been independently and hydraulic performance simulated forthisa work diverse set of The aim of the development DSS was to design a compropriateof as illustrated in Figure 19. CLIPS inference engine has been linked directly with Visual lodged. Daily Run Module alsoaendowed operating requirements. moduleswith of SQL DSS, designed, Studio.Net environmentThe and indirectly andas MATprehensive operation andThe management aidisfor water with util-an important functionality in terms of its ability to manage consumer comSuch interlinking these seemingly diverse set of can thenLAB. acquire facts that of emerge from such an exercise for ity. The study has demonstrated the potential application of plaints. Consider, for example, the water reservoir (ID 501) 4. There was no reported electricity failure. computing platforms has resulted in a multiplier effect and, further analysis and post processing by the inference engine CLIPS as a core component around which such a manageof the case study. The following information is lodged: together, the study has been able to unlock the combined poand its resident and an equally dynamic knowledge ment aid could be built. 1.Present work suggests that CLIPS tential of such application. In particular, the proposed From the network configuration, itand is flexible seen that the comReported head at the reservoir (ID 501) is 2.5 m instead framework acquires a totally dynamic flavor where a wabase. is indeed a powerful platform for development of an expert of 3.0 m. plainantterissupply connected to pipe ID 71 (u/s node 3 and d/s system can be modeled, calibrated and validated system. Furthermore, the proposed DSS has been designed tochainpernode 30). The CLIPS inference engine uses backward and its hydraulic performance simulated for a diverse set of 2. Consumer with ID 3423 lodges a complaint that ”water Supporting platforms like MATLAB, SQL, and Mapform other routine tasks such as directed simulation runs in operating requirements. The modules of DSS, as designed, supply to the user has been less than normal”. ing mechanism and reports appropriately reasoned diagnoscanto then acquire facts that emerge fromintervention such an exerciseand for to asWinGIS have also been integrated together under a common response any real or hypothetical tic message as depicted in Figure 20 which shows successive 3. Reports of a pump failure have also been independently further analysis and post processing by the inference engine umbrella of Visual Studio.Net environment. In this work, the sess theand given studyandnetwork for consequent impacts. This lodged. messages as received from theflexible consumer complaint its would resident be equally dynamic and knowledge base. module. management 4. There was no reported electricity failure.
Drink. Water Eng. Sci., 4, 37–50, 2011configuration, it is seen that the comFrom the network plainant is connected to pipe ID 71 (u/s node 3 and d/s node 30). The CLIPS inference engine uses backward chaining mechanism and reports appropriately reasoned diagnostic message as depicted in Figure 20 which shows successive
Furthermore, the proposed DSS has been designed to perwww.drink-water-eng-sci.net/4/37/2011/ form other routine tasks such as directed simulation runs in response to any real or hypothetical intervention and to assess the given study network for consequent impacts. This helps in a priori generation of knowledge regarding network performance following such interventions.
7
C
The ai prehen ity. Th CLIPS ment a is inde System Sup WinG umbre CLIPS Studio LAB. compu togeth tential framew ter sup and its operat can th furthe and its base. Fur form o respon sess th helps perfor CLI impor
K. Sandeep and K. Rakesh: CLIPS based decision support system
helps in a priori generation of knowledge regarding network performance following such interventions. CLIPS platform does not have permanent memory and an important contribution of the study has been the development of an external dynamic knowledge base with the mechanism for transferring newer facts into the knowledge base for subsequent use by the inference engine of CLIPS. The dynamic knowledge domain is designed to be self learning as it autogenerates newer knowledge for the DSS for future guidance. The DSS, with its simulation and planning modules, is able to estimate, in advance, the expected Hazen Williams C- values for planning horizons of 5, 10, 15, and 20 years. Importantly, the proposed DSS avoids excessive dependence on interventions by highly trained expert personnel and with the help of a highly user friendly interface, even relatively novice operators are now vested with necessary tools for effective management. Scope for further developments
In order to enhance the appeal of the proposed DSS for water supply systems that are in continuous operation and the system is essentially driven by demand, Extended Period Simulation (EPS) would be a desirable addition. Further, in present day scenario, it would be advantageous to harness the potential of Information Technology in water sector. Most water utilities now use some form of Supervisory Control and Data Acquisition (SCADA) system in their daily operations. The DSS would be an ideal partner tool for a SCADA based water distribution management system and, undoubtedly, would significantly widen the utility of the proposed Expert System. Edited by: I. Worm References Boulos, P. and Ormsbee, L.: Explicit network calibration for multiple loading conditions, Civ. Eng. Environ. Syst., 8, 153–160, 1991. Bunn, S. and Helms, S.: Application of an expert system to control treated water distribution, ASCE, Annual Water Resource Planning and Management Conference, Phoenix, AZ, 1999. Chan, C., Kritpiphat, W., and Tontiwachwuthikul, P.: Development of an intelligent control system for a municipal water distribution network, Proceedings of the 1999 IEEE Canadian Conference on Electrical and Computer Engineering, Edmonton, Alberta, Canada, 9–12 May 1999. Chau, K.: Knowledge-based system on water-resource management in coastal waters, Water Environ. J., 18, 25–28, 2004. Cheng, C. T., Ou, C. P., and Chau, K. W.: Combining a fuzzy optimal model with a genetic algorithm to solve multi-objective rainfall-runoff model calibration, J. Hydrol., 268, 72–86, 1999. Coulbeck, B. and Orr, C.: A network analysis and simulation program for water distribution systems, Civ. Eng. Environ. Syst., 1, 139–144, 1984.
www.drink-water-eng-sci.net/4/37/2011/
49
Colebrook, C. and White, C.: The reduction of carrying capacity of pipes with age, J. Ice, 7, 99–118, 1937. CAC – Calibration Guidelines for Water Distribution System Modelling: Engineering Computer Application Committee, Proceedings of AWWA 1999 1mTech conference, American Water Works Association, 1999. Gofman, E. and Rodeh, M.: Loop equations with unknown pipe characteristics, J. Hydraul. Div., 107, 1047–1060, 1982. Goforth, G. and Floris, V.: OASIS: An intelligent water management system for South Florida, AI Appl., 5, 47–55, 1991. Kapelan, Z.: Calibration of water distribution system hydraulic models, PhD thesis, University of Exeter, 2002. Khosa, R., Parida, B., Singh, B., and Aggarwal, S.: Expert system for iit water supply, Master’s thesis, Unpublished Undergraduate Project under Student Undergraduate Research Award(SURA), Indian Institute of Technology, Delhi, 1995. Kulshrestha, S., Khosa, R., and Jha, K.: Roughness Calibration of a Water Distribution Network using Ant Colony Optimization with Prior Information, J. Water Resour. Pl.-ASCE, in review, 2001. Lamont, P.: Common pipe flow formulas compared with the theory of roughness, J. Am. Water Work. Assoc., 73, 274–280, 1981. Leon, C., Mart´ın, S., Elena, J., and Luque, J.: EXPLORE- hybrid expert system for water networks management, J. Water Resour. Pl.-ASCE, 126, 65–74, 2000. Machell, J., Mounce, S. R., and Boxall, J. B.: Online modelling of water distribution systems: a UK case study, Drink. Water Eng. Sci., 3, 21–27, doi:10.5194/dwes-3-21-2010, 2010. Maier, H., Simpson, A., Zecchin, A., Foong, W., Phang, K., Seah, H., and Tan, C.: Ant colony optimization for design of water distribution systems, J. Water Resour. Pl.-ASCE, 129, 200–209, 2003. Muttil, N. and Chau, K. W.: Machine-learning paradigms for selecting ecologically significant input variables, Eng. Appl. Artif. Intell., 20, 735–744, 2007. Ormsbee, L.: Implicit network calibration, J. Water Resour. Pl.ASCE, 115, 243–257, 1989. Ormsbee, L. and Wood, D.: Explicit pipe network calibration, J. Water Resour. Pl.-ASCE, 112, 166–182, 1986. Raghavendran, V., Gonsalves, T. A., Rani, U., Kumar, S., and Narasimhan, S.: Design and Implementation of a Network Management System for Water Distribution Networks, ADCOM’07 Proceedings of the 15th International Conference on Advanced Computing and Communications, IEEE Computer Society Washington, DC, USA, doi:10.11.09/ADCOM.2007.62, 2007. Rahal, C., Sterling, M., and Coulbeck, B.: Parameter tuning for simulation models of water distribution networks, Proc. Inst. Eng., 69, 751–762, 1980. Rossman, L.: EPANET water quality model, Technical report, PB93-236552/XAB, Environmental Protection Agency, Cincinnati, OH (United States), Risk Reduction Engineering Lab., 1993. Shepherd, A. and Ortolano, L.: Water-supply system operations: Critiquing expert-system approach, J. Water Resour. Pl.-ASCE, 122, 348–355, 1996. Swamee, P. and Jain, A.: Explicit equation for pipe-flow problems, ASCE J. Hydraul. Div., 102, 657–664, 1976. Todini, E. and Pilati, S.: Gradient Algorithm for the Analysis of Pipe Networks, Computer Applications in Water Supply, 1, Research Studies Press Ltd. Taunton, UK, 1988.
Drink. Water Eng. Sci., 4, 37–50, 2011
50
K. Sandeep and K. Rakesh: CLIPS based decision support system
Walski, T.: Technique for calibrating network models, J. Water Resour. Pl.-ASCE, 109, 360–372, 1983. Walski, T.: Tips for saving energy in pumping operations, J. Am. Water Work. Assoc., 85, 49–53, 1993. Walski, T., Shields, F., and Sharp, W.: Predicting Internal Roughness in Water Mains, Miscellaneous Paper EL-88-2, US Army Engineer Waterways Experiment Station, Vicksburg, 1988. Walski, T., Chase, D., Savic, D., Strafaci, A., and Dietrich, K.: Water Distribution Modelling, Haestad Press, Waterbury, CT, USA, 2001.
Drink. Water Eng. Sci., 4, 37–50, 2011
Wang, H. J., Zhang, J. P., Chau, K. W., and Anson, M.: 4D dynamic management for construction planning and resource utilization, Automat. Construct., 13, 575–589, 2004. Zecchin, A., Simpson, A., Maier, H., and Nixon, J.: Parametric study for an ant algorithm applied to water distribution system optimization, IEEE T. Evol. Comput., 9, 175–191, 2005.
www.drink-water-eng-sci.net/4/37/2011/