Clock Time Naming: Complexities of a Simple Task Simone A. Sprenger (
[email protected]) Max Planck Institute for Psycholinguistics; P.O. Box 310 NL-6525 AH Nijmegen, The Netherlands
Hedderik van Rijn (
[email protected]) University of Groningen, Department of Artificial Intelligence; Grote Kruisstraat 2/1 NL-9712 TS Groningen, The Netherlands A
Abstract Performance in relative clock time naming (e.g., pronouncing 3:50 as “ten to four”) has been described as depending on three factors: reference hour determination, minute transformation, and an additional distance component (Meeuwissen, Roelofs & Levelt, 2003). However, this model does not specify the cognitive operations that are responsible for the distance effect. We present three hypotheses about the factors that determine clock time latencies: physical distance, arithmetics, and frequency of the expression. Three experiments and a corpus analysis that test these hypotheses are presented. Regression models of speech onset latencies for an extended set of clock times show clear contributions of all three factors and explain most of the variance associated with this task.
h uur ’h hour’, h o’clock B: m over h
H: 60-m voor h+1
‘60-m before h+1’
kwart voor h+1 ‘quarter to h+1’
G
F: m-30 over half h+1
H or F
H B F D
‘m-30 past h+1’
‘m past h’
B or D
C
kwart over h ‘quarter past h’
D: 30-m voor half h+1
‘30-m before half h+1’
E
half h+1 (‘half h+1’)
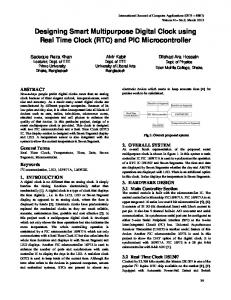
Figure 1: Preferred utterance formats for relative clock times in Dutch.
Keywords: clock time naming, language production, phrases.
Clock time naming In a series of recent papers (Bock, Irwin, Davidson & Levelt, 2003; Meeuwissen, Roelofs & Levelt, 2003, 2004) clock time naming has been established as a new paradigm to study the production of multi-word utterances. It can be seen as a special variant of the picture naming paradigm that allows to elicit complex spoken responses without additional training, due to the universal familiarity of clock faces and the task of telling the time. Bock et al. (2003) showed that while the stimulus is universal, the format of the utterance that is used to express time varies both between and within languages. Most importantly, languages like English and Dutch (among many others) offer two alternative ways of telling the time: either using an absolute system (three fifteen) or using a relative system (quarter past three). Testing five-minute intervals, Bock et al. showed that native speakers of Dutch prefer a relative system that uses the full and the half hour as reference points. Thus, Dutch speakers say tien over h ’ten past h’ when the clock shows h:10 and vijf voor half h+1 ’five before half h+1’ when the clock shows h:25. According to Bock et al., the reference point (half hour or hour) changes at twenty and forty minutes past the full hour (h:20 and h:40), respectively. In addition, the reference hour that is named in the utterance (h or h+1) changes at twenty minutes past the full hour. Figure 1 shows how the different utterance formats relate to the clock times. Meeuwissen et al. (2003) measured Dutch clock time naming latencies for five-minute intervals on the digital clock (hour:minutes, h:mm), using the relative system. They found effects of the type of reference point (h, half h+1, h+1) and
the distance (in minutes) between the minutes and their reference point. Utterances referring to the full hour (Figure 1, Format B) were faster than utterances referring to the next full hour (H), which in turn were faster than utterances referring to the half hour (D,F). The longer the distance (0, 5, or 10 minutes) between the minutes on the display and their reference point, the longer it took to initiate the utterance. In addition, Meeuwissen et al. found an interaction between distance and reference point, indicating that the distance effect is stronger for clock time naming latencies around the half hour and the next full hour. The authors explain their findings by means of a procedural semantics for clock time naming, in which there are separate semantic procedures for determining the full hour (h) and the next full hour (h+1). Since clock times that refer to the next full hour always require the determination of both h and h+1, speech onset latencies are predicted to be longer for these times. Furthermore, Meeuwissen et al. explain the interaction between reference point and distance as an effect of the numerical transformation that is required for minutes relative to the half hour and the next full hour, but not relative to the full hour (e.g., h:20 becomes ten before half h+1, whereas h:10 remains ten past h). To summarize, Meeuwissen et al.’s model explains the speech onset latencies for clock time naming by means of three factors: (1) numerical transformation of the hour, (2) numerical transformation of the minutes, and (3) distance between the minutes to be transformed and their reference point. While (1) and (2) seem rather straightforward explanations for an increase in reaction times, the third factor remains puz-
zling. Why should it take longer to say ten before half two than five before half two? Meeuwissen et al. do not specify the cognitive processes responsible for this effect. In fact, it is unclear what the cognitive equivalent to “distance in minutes” should be, weakening the viability of the model. If clock time naming is to be applied as a paradigm for testing phenomena in, for example, speech production, the underlying cognitive principles need to be specified in more detail. We will discuss three possible explanations that each specify a different aspect of transformation and distance. To begin, one might think of the physical distance between the hands of an imaginary analog clock, where the small hand points to the hour and the big hand points to the minute. If one were to turn the big hand to its reference point (either the full hour or the half hour), it would take longer, the larger the distance in degrees. Most importantly, one would predict the effect of distance to be a linear function, for example rt = degrees ∗ x ms. Such a linear effect is included implicitly in Meeuwissen et al.’s data plots, where the reaction times for the five-minute intervals that were tested in their experiment are connected by straight lines. The linear distance hypothesis implies that speech onset latencies for all minutes within an utterance format should show a linear increase in reaction time with distance. Another possible explanation of the distance effect, that is related to the problem of minute transformation, involves the influence of mental arithmetics. Naming the clock times from a digital clock requires speakers to transform the number on the display. In order to generate the correct expression in the Dutch relative system, arithmetic problem solving is required. The required operations depend on the reference point: 0 + m for utterance format B, 30-m(D), m-30 (F), and 60-m (H). The arithmetic hypothesis implies that the mental arithmetic required for transforming digital clock times can explain the pattern of speech onset latencies. Another source of influence on the speech latencies for clock time naming might be found in the frequencies of the time expressions. Bock et al. (2003, p.683) suggest that time expressions are “a kind of non-figurative idiom, construction, or formula” (e.g., Kuiper, 1996), but show that nevertheless their linguistic formulation proceeds compositionally and in an incremental fashion. Accordingly, the general format of an idiom for relative clock times in Dutch is x [prep] [half] y, with x as the minute term, [prep] as an obligatory variable that can either be voor or over (before or past), [half] as an optional element, and y as the hour term. We assume that this abstract structure is not computed online, but rather accessed as a whole, and that its open slots are filled dependent on the actual time information. On the other hand, one might assume that frequently used time expressions are represented separately, for example by means of their own lexical entry whose minute slot has already been filled (e.g, “ten past y”). This suggests that the frequency of a time expression is related to its speech onset latency. Thus, the frequency hypothesis implies that the frequency distribution of time expressions can explain part of the variance in the speech onset latencies, and thus serves as a relevant factor in a model of clock time naming. The goal of our present study is to assess the validity of these hypotheses for clock time naming. By identifying dif-
ferent factors that influence reaction times we will develop a more fine-grained model of clock time naming.
Experiment 1 The first experiment tested the hypothesis that speech onset latencies for digital clock times are a linear function of the physical distance between the minute hand and its reference point on an imaginary analog clock. Therefore we extended Meeuwissen et al.’s (2003) digital clock time naming paradigm: not only the standard five minute intervals were tested, but all minutes of the hour. The distance hypothesis predicts a linear increase of speech onset latencies with distance to reference point.
Method Participants All participants in the present study were students of the University of Nijmegen and native speakers of Dutch who were paid for their participation. Twelve participants were tested in Experiment 1. Materials and Design The set of stimuli comprised all digital clock times from two o’clock (2:00) to nine fifty-nine (9:59), including the subset of five-minute intervals (standard times in the following) tested by Meeuwissen et al. (2003). The set was chosen such that all time points could be displayed with three-digit Arabic numerals (h:m1 m2 ). The complete set of stimuli consisted of 480 unique items. Procedure Participants were tested individually. They were instructed to produce spoken clock times in response to a digital clock display on a computer monitor, using the relative clock time format, and introducing each response with an initial om ’at’. They were explicitly instructed to use the nearest full or half hour as reference point for the formats B, D, F and H (the maximum distance being 14 minutes). Response latencies were measured by voice key. At the beginning of each trial a fixation cross was presented for 500ms, followed by 150ms blank screen. Then the clock time stimulus was presented for 1000ms. Speech onset latencies were measured from clock presentation onset, with a deadline of 2500ms. A new trial was initiated 1500ms after voice-key triggering. Following a training session with 15 items, all stimuli were presented in random order in six individual blocks that were separated by a short pause. Analyses and Results All utterances were checked for erroneous or missing responses and disfluencies. Data from two participants were removed from the data set, because of more than ten percent errors. The results of Experiment 1 are shown in Figure 2. The dots in the top panel show the speech onset latencies per minute. The dashed lines connecting the minutes from 0 to 15 and from 45 to 59 show the latencies for filler times, which were included in order to increase the external validity of the task. The dashed line connecting all standard times accentuates the subset of five minute intervals tested by Meeuwissen et al. (2003). The plotted latencies are based on 94.75% of all data (6.25% being rejected because of errors, disfluencies, or latencies shorter than 350ms). Given the continuous character of the minute variable, we analyzed these data using multilevel multiple regression models (Pinheiro & Bates, 2000), with the logarithm of the speech
1300
● ●
Data (Experimental Trials) Data (Filler Trials) Subset of standard times
●
1200
● ●
●
● ●
1100
●
●
● ●
●
●
●
RT (in ms) 1000
●
● ● ●
900
●
● ●
●
●
●
800
●
● ●
●
● ●
●
● ●
● ●
●
●
● ●
●
●
● ●
●
●
● ●
●
●
● ●
● ●
● ● ●
●
●
700
●
● ●
●
●
● ●
●
●
●
● ●
●
m past h
●
● ●
(30−m) to half (h+1) 10
15
20
25
(30−m) past half (h+1) 30 Minutes
35
(60−m) to (h+1)
40
45
50
55
60
1300
5
1300
0
●
1200
1200
●
● ● ● ●
●
●
●
●
● ●
●
●
● ● ●
● ● ● ● ●
●
900
● ● ● ●
●
●
● ●
● ●
●
800
25
●
●
●
●
●
●
● ●
●
●
●
● ● ●
●
●
35
●
40
45
●
● ●
●
●
●
●
●
●
●
●
●
● ●
●
●
●
● ●
●
30 Minutes
●
● ●
●
●
Distance Fit Data
20
●
700
700 15
●
●
●
●
●
● ●
●
●
●
●
●
●
●
● ●
●
● ●
●
800
●
● ● ●
●
900
●
●
●
●
●
●
RT (in ms) 1000
RT (in ms) 1000
● ●
● ● ●
●
1100
1100
●
●
15
Distance+ Fit Data
20
25
30 Minutes
35
40
45
Figure 2: Speech onset latencies and fits of two different regression models for Experiment 1.
onset latencies as the dependent variable and participant as the error stratum. Following Meeuwissen et al. (2003), we entered three types of predictor variables into the analyses: (1) magnitude information (the minutes), (2) length information (number of morphemes and number of phonemes of the minute term in the utterance), and (3) frequency (logarithm of the morpheme frequency for the minute term). In contrast to Meeuwissen et al., we preferred minute-term related variables over wholeterm variables, as Dutch relative clock time expressions start with expressing the minute term. Moreover, combining the values for minutes and hours into one factor excludes the possibility of assessing separate and possibly independent contributions of hour and minute terms. To account for possible hour related effects, we included hour as a categorical variable in the analyses. Note that this standard set of variables does not include whole form frequency, as testing the contribution of frequency was a specific focus of Experiment 3. The standard set of predictor variables was used in the analyses of both Experiment 1 and 2, in addition to the sets of experiment-specific variables. In all analyses, we first entered the total set of variables as fixed effects and trial number as random effect, and constructed the best-fitting model based on stepwise model selection by exact AIC (Pinheiro & Bates, 2000). As a test of replication, we first analyzed the subset of standard times. In addition to the variables mentioned above, we included a categorical variable representing the reference point (i.e., hour, half hour or next hour) and a categorical variable representing the distance to reference point (i.e., 0/15 for the cardinal times and either 5 or 10 for the remaining time points). The best-fitting model (all df=899) contains three predictors: the logarithm of the minute morpheme frequency (β=.179, t=7.923, p