CLOMP: Accurately Characterizing OpenMP Application Overheads Greg Bronevetsky, John Gyllenhaal, and Bronis R. de Supinski Computation Directorate Lawrence Livermore National Laboratory Livermore, CA 94551, USA
[email protected],
[email protected],
[email protected] Abstract. Despite its ease of use, OpenMP has failed to gain widespread use on large scale systems, largely due to its failure to deliver sufficient performance. Our experience indicates that the cost of initiating OpenMP regions is simply too high for the desired OpenMP usage scenario of many applications. In this paper, we introduce CLOMP, a new benchmark to characterize this aspect of OpenMP implementations accurately. CLOMP complements the existing EPCC benchmark suite to provide simple, easy to understand measurements of OpenMP overheads in the context of application usage scenarios. Our results for several OpenMP implementations demonstrate that CLOMP identifies the amount of work required to compensate for the overheads observed with EPCC. Further, we show that CLOMP also captures limitations for OpenMP parallelization on NUMA systems.
1
Introduction
OpenMP [11] is a simple method to incorporate shared memory parallelism into scientific applications. While OpenMP has grown in popularity, it has failed to achieve widespread usage in those applications despite the use of shared memory nodes as the building blocks of large scale resources on which they run. Many factors contribute to this apparent contradiction, most of which reflect the failure of OpenMP-based applications to realize the performance potential of the underlying architecture. First, the applications run on more than one node of these large scale resources and, thus, the applications use MPI [10]. While distributed shared memory OpenMP implemetantions [9] are an option, they fail to provide the same level of performance. Application programmers still might have adopted a hybrid OpenMP/MPI style, using OpenMP for on-node parallelization. However, the performance achieved discourages that also. OpenMP programs often have higher Amdahl’s fractions than with MPI for on-node parallelization. Optimization of OpenMP usage has proven difficult due to a lack of a standard OpenMP profiling interface and, more so, to a myriad of confusing and often conflicting environment settings that govern OpenMP performance. In addition, the lack of on-node parallelization within MPI implementations has often implied higher network bandwidths with multiple MPI tasks on a node. Perhaps the most important factor has been 0
This work performed under the auspices of the U.S. Department of Energy by Lawrence Livermore National Laboratory under Contract DE-AC52-07NA27344. (UCRL-ABS-XXXXXX).
a mismatch between the amount of work in typical OpenMP regions of scientific applications and the overhead of starting those regions. Multi-core systems will impact many factors that have restricted adoption of OpenMP. Future networking hardware will not support the messaging rates required to achieve reasonable performance with an MPI task per core. Also, greater benefit from on-node parallelization within MPI implementations will provide similar (or better) aggregate network bandwidth to hybrid OpenMP/MPI applications compared to using an MPI task per core. Further, shared caches will provide memory bandwidth benefits to threaded applications. Since we expect OpenMP to gain popularity with future large scale systems, we must understand the impact of OpenMP overheads on realistic application regions. Accurately characterizing them will help motivate chip designers to provide hardware support to reduce them if necessary. In this paper, we present CLOMP, a new benchmark that complements the EPCC suite [13] to capture the impact of OpenMP overheads (the CLOMP benchmark has no relationship to Intel’s Cluster OpenMP). CLOMP is a simple benchmark that models realistic application code structure, and thus the associated limits on compiler optimization. We use CLOMP to model several application usage scenarios on a range of current shared memory systems. Our results demonstrate that OpenMP overheads limit performance substantially for large scale multiphysics applications and that NUMA effects can dramatically lower their performance even when they can compensate for those overheads.
2
Characteristics of Scientific Applications
CLOMP provides a single easy-to-use benchmark that captures the shared memory parallelization characteristics of a wide range of scientific applications. We focused on applications in use at Lawrence Livermore National Laboratory (LLNL), which are representative of large scale applications. We categorize LLNL applications as multiphysics applications or as science applications that focus on a particular physics domain. We need a simple easy-to-use benchmark that accurately characterizes the performance that a system and its OpenMP implementation will deliver to the full range of these applications. Multiphysics applications [4, 16, 5, 14] generally have large, complex code bases with multiple code regions that contribute significantly to their total run time. These routines occur in disparate application code sections as well as third party libraries, such as linear solvers [1, 6]. While the latter may include large loops that are relatively amenable to OpenMP parallelization, the application code often has many relatively small but parallelizable loops with dependencies between the loops that inhibit loop fusion to increase the loop sizes. Further, the loops frequently occur in disparate function calls related to different physics packages, making consolidation even more difficult. Many multiphysics applications use unstructured grids, which imply significant pointer chasing to retrieve the actual data. Code restructuring to overcome these challenges is difficult: not only are these applications typically very large (a million lines of code or more) but the exact routines and the order in which they are executed depends on the
input. However, the individual loops have no internal dependencies and would appear to be good candidates for OpenMP parallelization. Science applications typically have fewer lines of code and less diverse execution profiles. While many still use high performance numerical libraries such as ScaLAPACK [2], a single routine often contains the primary computational kernel. Loop sizes available for OpenMP parallelization vary widely, from dense large matrix operations to very short loops. LLNL science applications include first principles molecular dynamics codes [8], traditional molecular dynamics codes [7, 12, 15] and ParaDiS, a dislocation dynamics application [3]. The loop sizes available for OpenMP parallelization depend on the application and the input problem. Currently, many HPC applications either use weak scaling or increase the problem resolution, both of which imply the loop sizes do not vary substantially as the total number of processors increases. However, we anticipate systems with millions of processor cores in the near future, which will make strong scaling attractive. Further, the amount of memory per core will decrease substantially. Both of these factors will lead to smaller OpenMP loops. Thus, while we need an OpenMP benchmark that characterizes the range of applications, capturing the impact of decreasing loop sizes is especially important.
3
The CLOMP Benchmark Implementation
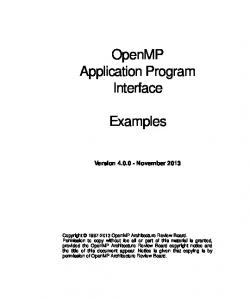
CLOMP is structured like a multiphysics application. Its state mimics an unstructured mesh with a set of partitions, each divided into a linked list of zones, as Figure 1 shows. The linked lists limit optimizations but we allocate the zones contiguously so CLOMP can benefit from prefetching. The amount of memory allocated per zone can be adjusted to model different pressures on the memory system; however, computation is limited to the first 32 bytes of each zone. We kept the per-zone working set constant because many applications only touch a subset of a zone’s data on each pass, including our target applications. Although the actual size varies from application to application, keeping it at 32 bytes makes it easier to explore the interactions between the CPU and the memory subsystem. CLOMP repeatedly executes the loop shown in Figure 2. calc deposit() represents a synchronization point, such as an MPI call or a computation that depends on the state of all partitions. The subsequent loop contains numPartitions independent iterations. Each iteration traverses a partition’s linked list of zones, depositing a fraction of a substance into each zone. We tune the amount of computation per zone by repeating the inner loop flopScale times. CLOMP models several possible loop parallelization methods, outlined in Figure 3. The first applies a combined parallel for construct to the outer loop, using either a static or a dynamic schedule. We call these configurations for-static and for-dynamic. The second method, called manual, represents parallelization that the programmer can perform manually to reduce the Amdahl’s fraction. We enclose all instances of CLOMP’s outer loop in a parallel construct and partition each work loop among threads explicitly. To ensure correct execution, we follow the work loop by a barrier and enclose the
calc deposit in a single construct. The last configuration, called best-case represents the optimistic scenario in which all OpenMP synchronization is instantaneous. It is identical to the manual version, except that the barrier and single are removed. Although this configuration would not produce correct answers, it provides an upper bound for the performance improvements possible for the other configurations. While similar to the schedule benchmark in EPCC that measures the overhead of the loop construct with different schedule kinds, CLOMP emulates application scenarios through several parameters in order to characterize the impact of that overhead. The numPartitions parameter determines the number of independent pieces of work in each outer loop while the numZonesPerPart and the flopScale parameters determine the amount of work in each partition. While our results in Section 4.2 fix numPartitions to 64, we can vary it as appropriate for the application being modeled. The EPCC test fixes the corresponding factor at 128 per thread and requires source code modification to vary it; which prevents direct investigation of speed ups for a loop with a fixed total amount of work. The EPCC test also fixes the amount of work per iteration to approximately 100 cycles; our results show that this parameter directly impacts the speed up achieved. CLOMP could mimic the EPCC schedule benchmark through proper parameter settings but those would not correspond to any application scenarios likely to benefit from OpenMP parallelization. Our results in Section 4.2 demonstrate that we must measure the impact of memory issues as well as the schedule overheads alone to capture the effectiveness of an OpenMP implementation for many realistic application loops. We control CLOMP’s memory footprint through the zoneSize parameter that specifies the amount of memory allocated per zone. In addition, the allocThreads parameter determines whether each thread allocates its own partitions or if the master thread allocates all of the partitions. As is well known, the earlier strategy works better on NUMA systems that employ a first touch policy to place pages.
partArray[4]
PartPtr0 PartPtr1 PartPtr2 PartPtr3
Zone01 NextZone ZoneData
Zone02 NextZone ZoneData
Zone03 NextZone ZoneData
Zone04 NextZone ZoneData
Zone11 NextZone ZoneData
Zone12 NextZone ZoneData
Zone13 NextZone ZoneData
Zone14 NextZone ZoneData
Zone21 NextZone ZoneData
Zone22 NextZone ZoneData
Zone23 NextZone ZoneData
Zone24 NextZone ZoneData
Zone31 NextZone ZoneData
Zone32 NextZone ZoneData
Zone33 NextZone ZoneData
Zone34 NextZone ZoneData
Fig. 1. CLOMP data structures
deposit = calc_deposit(); for(part = 0; part < numPartitions; part++) { for(zone = partArray[part]->firstZone; zone != NULL; zone = zone->nextZone) { for(scale_count = 0; scale_count < flopScale; scale_count++) { deposit = remaining_deposit * deposit_ratio; zone->value += deposit; remaining_deposit -= deposit; } } }
for-static
Fig. 2. CLOMP source code for-dynamic
repeat { #pragma omp parallel for schedule(static) for(part = 0; part < numPartitions; part++) { …. } deposit = calc_deposit(); }
repeat { #pragma omp parallel for schedule(dynamic) for(part = 0; part < numPartitions; part++) { …. } deposit = calc_deposit(); }
manual
best-case
#pragma omp parallel repeat { for(part = thread_part_min; part < thread_part_max; part++) { …. } #pragma omp barrier #pragma omp single deposit = calc_deposit(); }
#pragma omp parallel repeat { for(part = thread_part_min; part < thread_part_max; part++) { …. } deposit = calc_deposit(); }
Fig. 3. Variants of CLOMP
4
Experimental Results
In this section, we demonstrate that CLOMP provides the context of application OpenMP usage for results obtained with the EPCC microbenchmarks [13] through results on three different shared memory nodes. The LLNL Atlas system has dual core, quad socket (8-way) 2.4GHz Opteron, 16GB main memory nodes. Each core has 64KB L1 instruction and data caches and a 1MB L2 cache; each dual core chip has a direct connection to 4GB of local memory with HyperTransport connections to the memories of the other chips. The LLNL Thunder system has 4-way 1.4GHz Itanium2, 4GB main memory nodes. Each single core chip has 16KB instruction and data caches, a 256KB L2 cache and a 4MB L3 cache. All four processors on a node share access to main memory through four memory hubs. Our experiments on Thunder and Atlas use the Intel compiler version 9.1, including its OpenMP run time library support. The LLNL uP system has dual core, quad socket (8-way) 1.9GHz Power5, 32 GB main memory nodes. Each core has private 64KB instruction and 32KB data caches while a 1.9MB L2 cache and a 36MB L3 cache are shared between the two cores on each chip. Each dual core chip has a direct connection to 8GB of local memory with connections through the other chips to their memories. Our experiments on uP
use the IBM xlc compiler version 7.0, including its OpenMP run time library support. All experiments on all platforms use the -O3 optimization level. Thread affinity were used to force each thread to use a different core but the threads were not bound, meaning that they could move if needed by the Operating System. We relied on the kernel’s memory affinity algorithm to keep memory close to the threads that allocated it but the exact details of the algorithms used are unknown. 4.1
OpenMP Overheads Measured with EPCC
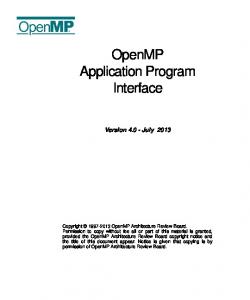
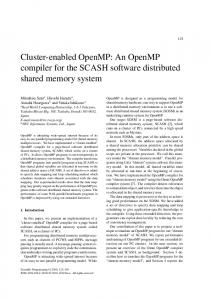
We measured the overheads of OpenMP constructs on our target platforms with the EPCC microbenchmark suite. Figure 4 presents the results of the synchronization microbenchmark and Figure 5 show the scheduling microbenchmark. All figures list OpenMP constructs on the x-axis and their average overhead from ten runs in processor cycles on the y-axis. The synchronization benchmark data is plotted on a linear y-axis and the scheduling data uses a logarithmic axis.
Cycles
100000
PARALLEL
FOR
140000
PARALLEL FOR
120000
80000
1
60000
2
40000
4
20000
8
CRITICAL
ATOMIC
SINGLE
LOCK/ UNLOCK
100000 Cycles
120000
1
80000
2
60000
4
40000
8
20000
0
0 Atlas Thunder
uP
Atlas Thunder
uP
120000
Cycles
100000
Atlas Thunder
uP
BARRIER
Atlas Thunder uP
ORDERED
Atlas Thunder uP
Atlas Thunder uP
Atlas Thunder uP
REDUCTION
80000
1
60000
2
40000
4
20000
8
0 Atlas Thunder
uP
Atlas Thunder
uP
Atlas Thunder
uP
Fig. 4. EPCC Synchronization Results
The synchronization microbenchmark data shows several interesting effects. First, while the overhead of synchronization constructs with Intel OpenMP vary little with the number of threads, the overhead of the constructs with IBM OpenMP rises dramatically as the number of threads increases. However, despite its poor scaling, IBM OpenMP is less expensive for most OpenMP constructs The exceptions are the atomic and critical and parallel loop constructs, which have higher overhead with IBM OpenMP on larger thread counts. Overall, most synchronization overheads are on the order of tens of thousands of cycles. In particular, a barrier costs between 27,000 and 38,000 cycles with Intel OpenMP and from 7,000 to 31,000 with IBM OpenMP. The overhead of a loop construct
Static Schedule Atlas
Thunder
Cycles
1 2 4
4
16 64
1
4
16 64
1
4
Atlas
Thunder
uP
1000000
1
10000
2 4
100
8 1
Dynamic Schedule
100000000
uP
Cycles
1000000 100000 10000 1000 100 10 1
8
1
16 64
1
4
16 64
1
Chunk Size
4 16 64 Chunk Size
1
4
16 64
Guided Schedule
10000000 1000000 100000 10000 1000 100 10 1
Atlas
Thunder
uP
Cycles
1 2 4 8 1
2
4
8 16 1
2 4 8 16 32 1 Chunk Size
2
4
8 16
Fig. 5. EPCC Scheduling Results
is 28,000-40,000 cycles with Intel OpenMP and ranges from 1,400 to 100,000 cycles with IBM OpenMP. The overhead of a combined parallel loop construct is typically a little larger than the maximum overhead of the separate constructs. The overhead of different schedule kinds varies between our platforms also, as shown in Figures 5 (the y-axis is logarithmic). The overhead of the loop construct changes little as the number of threads increases with our two Intel OpenMP platforms for a fixed schedule kind and associated chunk size. Further, static scheduling overhead is similar for all chunk sizes. In contrast, dynamic scheduling overhead drops off exponentially with increasing chunk size while guided scheduling overhead falls linearly. The reduced overheads reflect that the dynamic and guided mechanisms impose a cost every time they are invoked. Since larger chunks imply fewer invocations of the chunk assignment mechanism, they impose a smaller overhead. This drop-off is less pronounced for guided scheduling because it uses smaller chunks at the end of the allocation process, while dynamic scheduling uses similar chunk sizes throughout. Nonetheless, dynamic and guided scheduling overheads are consistently higher than static scheduling overhead on the Intel OpenMP platforms, ranging from twice as high with a chunk size of 128 to a factor of ten higher on Thunder and 50 on Atlas with a chunk size of one. On Thunder, guided scheduling overhead with a chunk size of 32 is 1.8x lower than the static scheduling overhead; the reason for this is unclear. The overheads of different schedule kinds with IBM OpenMP rise superlinearly with the number of threads. However, IBM OpenMP overheads exhibit the same patterns with respect to chunk size patterns as seen with Intel OpenMP except that static scheduling shows even steeper overhead drops than dynamic and guided scheduling with increasing the chunk size. In addition, static scheduling overhead is not much lower than the other schedule kinds with the same chunk size and is sometimes larger.
The EPCC results capture the relative cost of different schedule kinds on our platforms. When compared to Intel OpenMP, IBM OpenMP is always cheaper with dynamic and guided and one thread and is usually cheaper with two. In all other cases, IBM OpenMP is more expensive as its poor scalability overtakes its good sequential performance. The results demonstrate that users should use static scheduling with Intel OpenMP unless their loop bodies have very significant load imbalances while, with IBM OpenMP, the more flexible schedule kinds are more likely to prove worthwhile. However, these low level EPCC results do not include sufficient information to determine if an application can compensate for the overheads. While it helps to convert the overheads to cycles from the microseconds that the test suite reports, we still need measures that capture the effect of these overheads for realistic application scenarios. 4.2
Capturing the Impact of OpenMP Overheads with CLOMP
We model application scenarios through CLOMP parameter settings. All results presented here set numPartitions to 64 and flopScale to 1. CLOMP’s default parameters, including numZonesPerPart equal to 100, model the relatively small loop sizes of many multiphysics application. The defaults use the minimum zone size of 32 bytes, which provides the most opportunity for prefetching and limits memory system pressure, and have the master thread allocate all memory similarly to the usual default in most applications. The untuned results, shown in Figure 6, use the default run time environment variable settings, which is the most likely choice of application programmers. With these settings the (unrealistic) best-case configuration scales well up to 8 threads, which shows that good performance for the loop sizes common to multiphysics applications are possible. However, the realistic configurations all scale poorly, even causing increased run times in many cases. The tuned results, shown in Figure 7, reflect the impact of changing environment settings so idle threads spin instead of sleep on uP and so idle threads spin much longer (KMP BLOCKTIME=100000) before they sleep on Atlas and Thunder (we used these settings for the EPCC results presented in Section 4.1). These settings, which are appropriate for nodes dedicated to a single user, result in improved scaling for the manual and for-static scale configurations on both uP and Atlas. However, the actual speed ups, no more than 3.9, are still disappointing in light of the potential demonstrated by the best-case configuration. Further, the for-dynamic configuration still does not have sufficient work to compensate for the high overhead of the dynamic schedule kind. In fact, the “tuned” environment settings actually caused a slowdown for for-dynamic on uP and they did not improve performance on Thunder. These results highlight the complexity of choosing the best OpenMP configuration, a task for which CLOMP results provide guidance. For our subsequent experiments we consistently used the modified OpenMP flags because the best performance of for-dynamic is much lower than the best performance of manual and for-static. We examined the effects of memory bandwidth on the performance of parallel loops by increasing the number of zones per partition by a factor of 10 (1,000
4.5 8.1
8 7
Bestcase OpenMP
6
Static Parallel For
5 4
1
5.8
4.1
Dynamic Parallel For 3.0 2.0 1.61.6
6.8
5.0
Manual Threading
3 2
Atlas
Speedup vs Serial Performance
Speedup vs Serial Runtime
9
2.32.2
1.01.01.01.0 0.5
0.5
2.72.5 1.0 0.50.4
0.9 0.60.4
0.5
0.9 0.50.4
0.8 0.40.4
0 1
2
3
4 5 6 Number of Threads
7
4.2
Bestcase OpenMP Static Parallel For Manual Threading Dynamic Parallel For
4 3.5 3
Thunder 2.8 2.1 2.0
2.0
2
2.8 2.5
2.5 1.5 1.5
1.5
1.0 1.0 1.0 1.0
1
0.6
0.9
0.8
0.5 0
8
1
2
3 Number of Threads
4
Speedup vs Serial Runtime
9 7.9
8 7 6
Static Parallel For
5
Manual Threading
4
1
4.9
3.0 2.5 2.01.8 1.01.01.01.0
6.7 5.9
3.9
Dynamic Parallel For
3 2
uP
Bestcase OpenMP
3.5
3.3
3.0 1.9
3.5 2.8
2.2
2.3
2.0
1.9
1.7
1.4
0.7
0.6
0.4
0.3
0.2
0.1
0.1
6
7
8
0 1
2
3
4 5 Number of Threads
Fig. 6. CLOMP Untuned Default Scenario
zones per partition), which corresponds to some multiphysics application runs as well as some science codes. The results for this scenario, shown in Figure 8, exhibit outstanding scaling since the single core’s memory bandwidth dominates performance of the sequential run. In fact, we observe superlinear speedups with manual and for-static on uP (e.g., 8.7x on with 8 threads) and on Atlas (peaking at 36x on 7 threads). The dramatic improvement on Atlas arises from the system’s NUMA architecture, in which the penalty for accessing remote memory via Hyper-Transport is relatively very high. Since the problem fits in cache with more threads, the performance benefit is significant. The cache effects are far smaller on uP and Thunder since these systems provide uniform memory access, with uP’s slightly super-linear speedups attributable to its much larger cache. In all cases, these configurations are very close to the theoretical maximum of best-case while the for-dynamic configuration results continue to disappoint. For application scenarios with even larger memory footprints, corresponding to science codes based on dense linear algebra routines, we no longer observe superlinear speedups since they no longer fit into cache. However, while we observe consistently good scaling on the uniform memory access systems, these scenarios provide insight into NUMA performance issues. Figure 9 shows results on Atlas for scenarios in which we increase the number of zones per partition over the default scenario 100x (10,000 zones per partition) and 1,000x (100,000 zones per partition). Here, we compare the two strategies for allocating application state: serial, where the master thread allocates all memory; and threaded, where each thread allocates its own memory. For each allocation strategy we show the speedup of the highest-performing realistic configuration. In both scenarios the two allocation strategies result in dramatically different performance, with
8 7 6 5 4
1
2.0 1.61.6
0.5
2.82.6
3.1 2.8
0.6
3.4 3.1
3.6 3.1
3.0
0.5
0.5
0.5
3.9
2
3
4 5 6 Number of Threads
2
Speedup vs Serial Runtime
5 4 3
1.0
0 1
2
3 Number of Threads
6.2
uP
2.0 1.71.8
5.4 4.6
3.8
2.3 2.0
2.6 2.4
3.0 2.6
3.3 2.8
3.4 3.0
3.5 3.0
1.01.01.01.0 0.6
0.6
0.6
0.5
0.5
0.4
0.4
0 1
2
3
4 5 6 Number of Threads
7
8
Fig. 7. CLOMP Tuned Default Scenario
the threaded allocation achieving near-linear speedup, while the serial allocation shows little improvement at all scales, similarly to previous observations on other NUMA systems. While application programmers generally will make the necessary coding changes to achieve these performance gains, the gains are not consistent: we still observed significant performance variation in our runs, with speed ups as low as 4 with eight threads. Examination of /proc data indicates that the threaded allocation does not guarantee the strict use of local memory. We are investigating using the numactl command in the NUMA library to provide more consistent performance. By providing a best-case performance estimate, CLOMP puts the actual performance numbers in context of OpenMP overheads, cache effects, and NUMA effects. The best-case configuration is significantly different from the EPCC schedule test and represents a contribution of our work. For example, in Figure 8, the 27.1 speedup for 8 threads on Atlas is great but an even higher speedup of 30.5 was possible if the OpenMP overheads were lower. Similarly, the low best-case serial Allocation performance corresponding to the results in Figure 9 shows that OpenMP overhead is not the problem, NUMA effects are.
5
0.9
0.7
8
Bestcase OpenMP Static Parallel For Manual Threading Dynamic Parallel For 2.8
2.5
1.6 1.5
6.6
2 1
2.7
2.6 2.5
1.0 1.0 1.0 1.0
1
7 6
3.9
3.5
0.5
0.5
7
Thunder
2.0
1.5
0 1
3
2.5
4.2
1.01.01.01.0
Bestcase OpenMP Static Parallel For Manual Threading Dynamic Parallel For
3.5
6.0
2.32.2
0.5
4 6.8
5.1
3.0
3 2
4.5
8.3
Atlas
Bestcase OpenMP Static Parallel For Manual Threading Dynamic Parallel For
Speedup vs Serial Runtime
Speedup vs Serial Runtime
9
Conclusion and Future Work
Despite the popularity of shared memory systems and OpenMP’s ease of use, overheads in OpenMP implementations and shared memory hardware have limited potential performance gains, thus discouraging the use of OpenMP. This paper presents CLOMP, a new OpenMP benchmark that models the behavior of scientific applications that have an overall sequential structure but contain
4
4.5
45 35 30 25
39.9
Atlas
Bestcase OMP
4
35.8 34.7
Static Parallel For
30.5 27.1 26.0
Manual Threading Dynamic Parallel For
15
23.3 21.5 21.1
19.9 18.7 18.4
20
19.2 17.9 17.9
11.6 11.1 11.0
10 5
1.01.01.01.0
2.62.52.5 1.7
1
2
2.3
3.3
3.4
2.4
1.8
2.4
0 3
4 5 6 Number of Threads
Speedup vs Serial Runtime
10 9 8 7 6 5 4 3 2 1 0
7
Bestcase OMP Static Parallel For Manual Threading Dynamic Parallel For
3.5 Speedup vs Serial Runtime
Speedup vs Serial Runtime
40
3 2.5
3.9 3.8
3.0 2.9 2.9
2.0 2.0 2.0
2
1.3
1.5 0.5 0
1
2
3 Number of Threads
8.9 8.78.7
uP
7.37.17.1
Static Parallel For
6.66.56.5
Manual Threading
5.45.35.3
Dynamic Parallel For
4.24.14.1
3.23.13.1 2.5 2.12.12.1 1.5
1.8
3.6
3.3
2.9
2.0
1.01.01.01.0
1
2
3
1.4
1.2
1.0 1.0 1.0 1.0
1
8
Bestcase OMP
4.0
Thunder
4 5 6 Number of Threads
7
8
Fig. 8. CLOMP 10X Memory Scenario
many loops with independent iterations. CLOMP can be parameterized to represent a variety of applications, allowing application programmers to evaluate possible parallelization strategies with minimal effort and OpenMP implementors to identify overheads that can have the largest impact on real applications. Our results on three shared memory platforms demonstrate that CLOMP extends EPCC to capture the application scenarios necessary to characterize the impact of the overheads measured by EPCC. CLOMP guides selection of run time environment settings and can identify the impact of architectural features such as memory bandwidth and a NUMA architecture on application performance. The resulting insights can be very useful to application programmers in choosing the parallelization strategy and hardware that will provide the best performance for their application. CLOMP is focused on single-node application performance while most scientific applications execute on multiple nodes, using MPI for inter-node communication. Our experience indicates that environment settings appropriate for single node OpenMP applications are often detrimental to MPI performance. Thus, our future work will extend CLOMP to include MPI communication so we can analyze the performance trade-offs between OpenMP and MPI. Overall, our results should not be seen as critiquing the OpenMP implementations that were used in our experiments. While we noted differences between them, the most significant issues arose from differences in the underlying architecture. Ultimately, CLOMP would provide its greatest value if it could guide architectural refinements that reduce the overheads of dispatching threads for OpenMP regions. For this reason, we are including CLOMP in the benchmark suite of LLNL’s Sequoia procurement.
4
8
7.2
Atlas - 100x
Speedup vs Serial Runtime
7 6 5
Serial Allocation
5.0
3.5
3.1
3
2.5
2 1
5.0
Threaded Allocation
4
1.5 1.5
1.7
1.4
1.4
1.3
1.0 1.0
1.3
1.3
0 1
2
3
4 5 6 Number of Threads
7
8
8
Speedup vs Serial Runtime
6
Serial Allocation
5
Threaded Allocation
6.0 5.5
4.5 3.7
4 3
2.3
2 1
7.0
Atlas - 1000x
7
1.6 1.5
1.5
2.0 1.4
1.7
1.9 1.3
1.0 1.0
0 1
2
3
4 5 6 Number of Threads
7
8
Fig. 9. CLOMP 100X and 1000X Memory Scenarios
References 1. S. Balay, W. D. Gropp, L. C. McInnes, and B. F. Smith. Efficient management of parallelism in object oriented numerical software libraries. In E. Arge, A. M. Bruaset, and H. P. Langtangen, editors, Modern Software Tools in Scientific Computing, pages 163–202. Birkh¨ auser Press, 1997. 2. L. Blackford, J. Choi, A. Cleary, E. Azevedo, J. Demmel, I. Dhillon, J. Dongarra, S. Hammerling, G. Henry, A. Petite, K. Stanley, D. Walker, and R. Whaley. ScaLAPACK Users. SIAM, Philadelphia, 1997. 3. V. Bulatov, W. Cai, J. Fier, M. Hiratani, G. Hommes, T. Pierce, M. Tang, M. Rhee, K. Yates, and T. Arsenlis. Scalable Line Dynamics in ParaDiS. In Proceedings of IEEE/ACM Supercomputing ’04, Nov. 2004. 4. W. D. Collins, C. M. Bitz, M. L. Blackmon, G. B. . Bonan, C. S. Bretherton, J. A. Carton, P. Chang, S. C. Doney, J. J. Hack, T. B. Henderson, J. T. Kiehl, W. G. Large, D. S. McKenna, B. D. Santer, and R. D. Smith. The community climate system model version 3. Journal of Climate, 19(1):2122–2143, 2006. 5. J. D. de St. Germain, J. McCorquodale, S. Parker, and C. Johnson. A Componentbased Architecture for Parallel Multi-Physics PDE Simulation. In International Symposium on High Performance and Distributed Computing, 2000. 6. R. Falgout, J. Jones, and U. Yang. The Design and Implementation of HYPRE, a Library of Parallel High Performance Preconditioners. Numerical Solution of Partial Differential Equations on Parallel Computers. Springer-Verlag, to appear. 7. T. Germann, K. Kadau, and P. Lomdahl. 25 Tflop/s Multibillion-Atom Molecular Dynamics Simulations and Visualization/Analysis on BlueGene/L. In Proceedings of IEEE/ACM Supercomputing ’05, Nov. 2005. 8. F. Gygi, E. Draeger, B. de Supinski, R. Yates, F. Franchetti, S. Kral, J. Lorenz, ¨ C. Uberhuber, J. Gunnels, and J. Sexton. Large-Scale First-Principles Molecular Dynamics simulations on the BlueGene/L Platform using the Qbox code. In Proceedings of IEEE/ACM Supercomputing ’05, Nov. 2005.
9. J. Hoeflinger and B. R. de Supinski. The openmp memory model. In International Workshop on OpenMP (IWOMP), 2005. 10. Message Passing Interface Forum. Mpi: A message-passing interface standard. International Journal of Supercomputer Applications, 8(3/4):165–414, 1994. 11. OpenMP Architecture Review Board. OpenMP application program interface, version 2.5. 12. J. C. Phillips, G. Zheng, S. Kumar, and L. V. Kale. NAMD: Biomolecular Simulation on Thousands of Processors. In Proceedings of IEEE/ACM Supercomputing ’02, Nov. 2002. 13. F. J. L. Reid and J. M. Bull. Openmp microbenchmarks version 2.0. In European Workshop on OpenMP (EWOMP), 2004. 14. R. Rosner, A. Calder, J. Dursi, B. Fryxell, D. Q. Lamb, J. C. Niemeyer, K. Olson, P. Ricker, F. X. Timmes, J. W. Truran, H. Tufo, Y.-N. Young, M. Zingale, E. Lusk, and R. Stevens. Flash code: Studying astrophysical thermonuclear flashes. Journal on Computing in Science and Engineering, 2(2), 2000. 15. F. Streitz, J. Glosli, M. Patel, B. Chan, R. Yates, B. de Supinski, J. Sexton, and J. Gunnels. 100+ TFlop Solidification Simulations on BlueGene/L. In Proceedings of IEEE/ACM Supercomputing ’05, Nov. 2005. 16. B. S. White, S. A. McKee, B. R. de Supinski, B. Miller, D. Quinlan, and M. Schulz. Improving the Computational Intensity of Unstructured Mesh Applications. In Proceedings of the 19th ACM International Conference on Supercomputing, June 2005.