Closing-the-Loop in NVisionIP: Integrating Discovery and Search in Security Visualizations Kiran Lakkaraju∗† NCSA,UIUC
Ratna Bearavolu
‡§
NCSA, UIUC
Adam Slagell NCSA , UIUC
CR Categories: K.6.5 [Computing Milieux]: Management of Computing and Information Systems—Security and Protection H.5.2 [Information Systems]: Information Interfaces and Presentation—User Interfaces H.3.3 [Information Systems]: Information Storage and Retrieval—Information Search and Retrieval Keywords: Security Visualization, Intrusion Detection Systems, Network Security 1
I NTRODUCTION
The field of security visualization came about to concisely display the complex, large data sets that security engineers must navigate in order to gain information about the network that they are protecting. These data sources, such as NetFlows, are often generated at the rate of gigabytes a day, making it impossible to be able to view all the data, unless there is a concise, rich representation of the data. In recent years, there has been a surge of growth in visualizing many different types of data. From NetFlows (NVisionIP [10], VisFlowConnect [15], etc.), BGP data ([14]), to Bro logs ([11]) All of these visualizations concisely display complex data, and allow security engineers to gain a measure of situational awareness of the network, as well as find patterns of interesting behavior that might indicate attacks in the network. But as fantastic as the growth in security visualizations has been, a crucial question has been overlooked:
William Yurcik NCSA, UIUC
∗∗ ††
Stephen North
‡‡
AT&T Research
1. Transform text security data to a rich visualization.
A BSTRACT The field of security visualization is in need of a paradigm shift in order to allow visualization tools to be practically used by security engineers. Security engineers must complete two different tasks, that of Discovery of a pattern, and that of Searching for a pattern in a data set. Current security visualizations do not aid the user in creating symbolic rules that represent visual patterns. Transforming visual patterns to symbolic rules requires effort by the security engineer and detracts from their main task of discovering interesting patterns. In this paper we describe the idea of Closing-The-Loop a system where symbolic rules are created from visual patterns.
¶k
2. Discover interesting activity, represented as a visual pattern via the visualization. 3. Transform the visual pattern into a symbolic rule. 4. Search data sources for pattern, using the symbolic rule. Figure 1. The four steps in the process for the investigation and detection of possibly malicious activity, via a visualization
network that might indicate attacks or misuse of the network, and they must search for these patterns of activity in the data. Figure 1 illustrates the steps to do these tasks when using a visualization. Of the four steps, all but step 3 have been explored. There are numerous visualizations of various sets of data, which satisfies Step 1. Discovering interesting patterns is something that the visualization also tries to bias towards. Step 4 as well, searching for matches to a symbolic rule, is just searching. The missing component is Step 3, the transformation of the visual pattern, found in the visualization, to a symbolic rule that can be used by machines to search for the activity. This step has been neglected by nearly all security visualizations, but is a necessary step for a security engineer to complete their tasks. In this paper, we discuss the two tasks of Discovery and Search that a security engineer must do. We argue for security visualizations to aid in the creation of symbolic rules from visual patterns, that is, aid in doing Step 3. We also implement this concept in our security visualization tool, NVisionIP. The rest of the paper is organized as follows. Section 2 discusses the difference between discovery and search, and describes our security visualization tool, NVisionIP. Section 3 discusses the transformation of visual patterns to symbolic rules in NVisionIP and contains an example of the tool in use. Section 4 discusses related work. Section 5 describes some preliminary work on Closing-theLoop between a human, visualization and a data mining algorithm. The conclusions and future work are in Section 6.
What happens after a pattern is discovered? Security engineers, in order to protect their network, must do two tasks, first they must discover interesting patterns of activity in the ∗ e-mail:
[email protected] Center for Supercomputing Applications ‡ e-mail:
[email protected] § National Center for Supercomputing Applications ¶ e-mail:
[email protected] k National Center for Supercomputing Applications ∗∗ e-mail:
[email protected] †† National Center for Supercomputing Applications ‡‡ e-mail:
[email protected] † National
2
D ISCOVERY AND S EARCH : T HE TASKS OF A S ECURITY E NGINEER
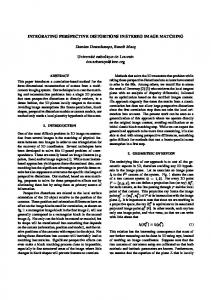
Figure 2: NVisionIP Galaxy View with recatngular region selected
Suppose a security engineer is using the NVisionIP tool to explore their network. Via the tool, they notice in the Galaxy View that a section of the subnet-host space has unusually high activity as compared to what they have seen before (note boxed section in figure above. More details on NVisionIP can be found in [10] and in Section 2). On drilling down into this area, they find that there is activity via the UDP protocol on this machine (see below). This UDP activity from a single port to many machines could be an indicator of P2P activity (Gong [6]).
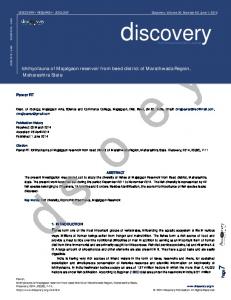
Figure 3: Machine View of IP address 98.97.30.88
Since this should not be allowed on the network, the security engineer would like to ascertain which other machines have this type of activity. The options for the security engineer right now are two-fold, to search for this pattern in the visualization or to create a symbolic pattern that will describe this visual pattern which we can then use to search the data. Searching for this pattern visually will require too much effort on the part of the security engineer, as well as too much time. Creating a symbolic rule is an efficient way of finding instances of this pattern in the data. The security engineer would want to determine whether other machines from this set of machines also have high UDP activity. To do this, the security engineer would have to construct a symbolic rule akin to the one Gong, [6], constructed: ”For a period of time(x), from on single IP, fixed UDP port -i many destination IP(y), fixed or random UDP ports” It is clear from this example that that the job of a security engineer goes past the point of just discovering an attack on a network, but also encompasses the task of searching for attacks on the network. We call these two tasks Discovery and Search. Discovery is the process of finding patterns in some data. Patterns are basically structures in the data. This could be a spatial structure, like a shape in an image. It could also be a correlation in the fields of the data, for instance if you had data on the purchases made in a store, and noticed that whenever it rained, the purchases of umbrellas went up. A large body of work in the Artificial Intelligence/Data Mining community is focused on finding correlations within a set of data. For instance, there are many Data Mining techniques for finding
association rules, which are basically if-then statements. The technique used to determine association rules is to find correlated values in the data, and assume that correlation implies causality. In Intrusion Detection, the patterns in the data are the indications of an attack. In signature based intrusion detection, these are the signatures of an attack. For instance here is a signature from a Trojan attack that was discovered in June of 2004: alert tcp any any -> any 80 (msg:"Webber/Berbew Trojan keystroke log upload"; flow:established; content:"id=crutop|26|vvpupkin0="; depth:20; classtype:trojan-activity; reference: url,www.lurhq.com/berbew.html;sid:1000108; rev:1;) This snort rule tells the IDS to send an alert whenever it sees a packet using the tcp protocol from any ip address going to another ip address via port 80; in addition, the packet payload must be ” id=crutop—26—vvpupkin0=”. This snort rule is a symbolic rule specifying the correlated fields that indicates a Trojan attack. To create this rule, a human security engineer would have to look at the trojan and find the aspects of it that differentiate it from other attacks, and create this symbolic rule. Even though there has been work on automated discovery of patterns in the fields of Artificial Intelligence and Data Mining, these techniques often generate many false positives (that is, indicating attacks when there are no attacks). It is still the case that human security engineers must look through the data and create a signature for an attack, like the snort signature for the Trojan shown above. Security visualizations can help the human determine the signatures of attacks, but discovery is still a very human oriented task. Searching is the process of finding a particular pattern in a set of data. Examples abound of this in the computer realm. The Unix tool grep searches text files for a specific pattern, represented as a regular expression. Signature based intrusion detection systems are basically highly efficient searchers. Systems like Snort [1], or Bro [12], have a set of rules or signatures which they use to filter a data stream. In essence, they are checking the stream of data for any matches to the signatures they have. For the task of searching, they are highly efficient and fast. There are some limitations though, the first being the language that the pattern is represented in limits the types of patterns that can be found. For instance, a search program that can only find patterns that are represented as a regular expression will not be able to find patterns of the form 1n 0n , since this isn’t a regular expression. The second limitation is of usefulness, the search engines must be supplied with the patterns to be found, so they are only useful once it has been determined that the pattern is useful. 2.1
From a Visual Pattern to a Symbolic Rule
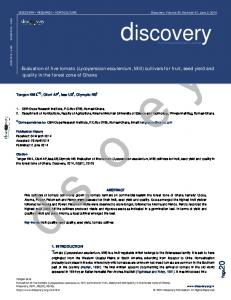
The benefits of representing a visual pattern as a symbolic rule are obvious. Symbolic rules allow a concise summarization of a complex visual pattern. This summarization can also be processed by the machine and used to find matches in other streams of data. A symbolic rule is also disseminable, it can be stored and shared with others. A symbolic rule can be used to affect the choice of input data as well, that is it can be used to modify the network sensors, or the firewall rules, etc. It is for this reason, that the user can affect the network sensors, that we call this concept ”closing-the-loop”. Figure 4 illustrates the interaction between the user of the system and the data flow of the system.
Network Sensors
Log Data Data
Filters
IDS
Viz User
FireWall
Figure 4. Various types of data and how they are interconnected. Without the concept of closing-the-loop, the human in the diagram would not be able to modify the filters or the sensors, as indicated by the double pointing arrows and the arrow between the user and the network.
The benefits to a symbolic representation are clear; the problem is how to create a symbolic rule from a visual pattern (step 3 in Figure 1). This is not a trivial task, as many visualizations are quite complex, and although they are meant to highlight interesting activity, it is not clear how to easily represent this activity as a symbolic rule. It will require some effort to create a symbolic rule from a visualization. In our previous example, the user would have to retrace their steps to find what aspects of the data were interesting, then create a rule describing these aspects. We propose creating a visualization tool that allows security engineers to not only discover patterns, but also aids them in creating symbolic rules from the discovered visual patterns. The visualization will provide a concise, rich display of the data from which the users can discover visual patterns that will be automatically translated into symbolic patterns. This will reduce the effort on the part of the security engineer in creating symbolic rules from visual patterns and thus enhance their productivity. In this paper we extend our security visualization tool, NVisionIP, to include this capability. Symbolic patterns are generated based on the interaction of the user with our tool. To aid in organizing the symbolic rules that are created, we provide a list view and a tree view of the rules. Finally, we provide a mapping from the symbolic rules into the tcpdump filtering language. 2.2
NVisionIP
NVisionIP[10] is a visualization tool designed to provide situational awareness of a network for security engineers. Its aim is to represent connection data taken from the routers on a network in a visual manner that is conducive for learning about both normal and abnormal behavior of a network. Currently, NVisionIP uses NetFlows as its data source. A NetFlow record is an abstract representation of a sequence of packets transmitted between a source and destination host over a particular source and destination port pair. NetFlows keep track of the start and end time, source and destination port, number of bytes transmitted, number of packets transmitted, and IP protocol used (There are other optional fields, but these are common to all formats). We will consider a flow to be comprised of the following seven fields: Start Time Start time of the flow End Time End time of the flow Source IP Source IP address Destination IP Destination IP Address Source Port Port on source IP address Destination Port Port on destination IP Address Protocol IP Protocol used for this flow. NetFlows can be captured from various points on the network. For instance, CISCO routers can log NetFlow data, and there are
also third party clients that can generate NetFlows from packets captured on an arbitrary host, like the Argus toolkit [2] Figure 5 shows the three views of NVisionIP: Galaxy View, Small Multiple View and Machine View. The Galaxy View provides an overall view of the address space for an entire class B network. In the Galaxy View, the user can see statistics about machines, but cannot access more detailed information. The Small Multiple View shows more detailed information about smaller sets of machines, including information about port usage. Finally, the Machine View provides detailed information about a single machine, including the number of bytes transferred over a specific port, the types of protocols used and various other statistics. NVisionIP supports filtering in the Galaxy View. By using this option, the user can filter for a specific set of IPs that satisfy a given criteria. Currently, the filtering menu supports three different categories that the user can filter on - IP, protocol and port. In the IP category, the user can specify a range of subnets and hosts of the IPs, as well as specify whether the IPs should be the source IPs or the destination IPs. In the Protocol category, the user can specify the different protocols and specify whether they want to view results that did or did not use the protocol(s). In the ports category, the user can indicate specific port numbers and whether these port numbers should have been used by the source IP, the destination IP or not used by them. As a result the Galaxy View gets updated depending on the number of IPs that satisfy all the criteria specified by the user. For a more detailed explanation about NVisionIP, see our previous descriptive paper [10]. 2.3
What is a visual pattern in NVisionIP?
One of the main ways that users can interact with NVisionIP is by choosing different sections of the address space to view at varying levels of detail. From the Galaxy View, the user is able to select ranges of IP addresses to view in more detail in the Small Multiple View. Similarly in the Small Multiple View, the user can choose a particular machine to look at in detail. In terms of information presented to the user, of particular importance are the ports used by machines, and how much traffic has passed over those ports. These attributes of machines are the ones presented in the Galaxy View of NVisionIP, and in more detail in the Small Multiple View. In addition to ports, the protocols used by a machine are also important. A symbolic rule must be capable of representing all of these types of patterns, that of a constraint on the IP address space, a constraint on what ports and how much traffic has passed over them, and a constraint on the protocols used by the machines. In this, our preliminary work on Closing-The-Loop, we designed a pattern language that is comprised of 4 fields, which place constraints on the IP address of the machine and which port and protocol to be used. The four fields are: ip1 Constraint on the subnets, like < 30 − 40 >. Can be < any >, signifying any subnet ip2 Constraint on the hosts, like < 35 − 90 >. Can be < any >, signifying any host portr Constraint on the ports, like < 0 − 1023 >. Can be < any >, signifying any port protr Constraint on the protocols, like < 6 >. Can be < any >, signifying any protocols. We will represent a pattern as: 141.142. < ip1 > . < ip2 >, < portr >, < protr > Searching for a pattern will involve finding all records in a set of NetFlows that satisfy the constraints of the pattern. A NetFlow record matches a pattern if:
Figure 5. NVisionIP screenshot. The background is the Galaxy View, the bottom left is the Small Multiple View, and the bottom right is the Machine View
1. The Source IP subnet and host or the Destination IP subnet and host are within ip1 and ip2 respectively. (Note: this kind of box like selection is exactly the same type of selection used for the Small Multiple View of NVisionIP). 2. The Source port or Destination port are within portr 3. The protocol is within protr For example, a pattern of: 141.142. < any > . < 98 >, < 91 − 95 >, < any > will match with all records that have an IP address in the domain 141.142 with a host number of 98 that uses either port 91, 92, 93, 94 or 95. The pattern: 141.142. < 45 > . < any >, < 80 >, < 6 > will match with all records for hosts on the network 141.142.45.0/24 communicating on port 80 with protocol 6, i.e HTTP traffic. 3
T RANSFORMING VISUAL PATTERNS INTO S YMBOLIC RULES
To help the security engineer in searching as well as discovery, the security visualization tool must transform the visual patterns into symbolic rules that can then be used by dedicated searchers. Not only must we create symbolic rules, we must organize these rules so that the user is not overwhelmed by the number of patterns. 3.1
Observing the behavior of the user
We utilize the Observer paradigm to create symbolic rules. Basically, we keep track of the behavior of the user as they use NVisionIP and create patterns from this behavior. This feature can be turned off if the user prefers not have patterns recorded.
The pattern language defined above allows the patterns to represent constraints on the IP addresses, ports used, and protocols used. We generate different patterns based on which view the user is currently focused on, and what actions the user takes. Galaxy View In the Galaxy View, a pattern consists of a range of IP addresses. Whenever the user zooms in on a set of IP addresses, a pattern is created and placed in the pattern tree. The pattern created will be in the format of : 141.142.ipr1 .ipr2 , < any >, < any >. For example, 141.142. < 5 − 10 > . < 25 − 29 >, < any >, < any >. Small Multiple View In the Small Multiple View, a pattern consists of a range of IP addresses. The user can select an entire row/column or a single machine. Based on the selection, the relevant pattern is generated and added to the pattern tree. Since the only actions in the Small Multiple View involve choosing a subset of the machines, the patterns will only select a subset of machines as well. The pattern created will be in the format of: 141.142. < ipr1 > . < ipr2 >, < any >, < any >. The main difference in using this view to create a pattern is that it is easier to select a very small or specific set of IP addresses because the view is already zoomed in on a smaller area. Machine View In the Machine View the user can select specific ports and protocols by clicking on the bars in the histograms. This will create patterns that will specify the port and protocol portions of the pattern. For example, if the user is viewing the bar graph showing the number of times each protocol was used by machine 141.142.9.8, and the user clicks on the bar for TCP, the pattern 141.142. < 9 > . < 8 >, < any >, < TCP > will be generated. On the other hand, if the user clicks on the bar for port 80 while looking at the histogram showing the number of times each port was used by machine 141.142.9.8 the pattern 141.142. < 9 > . < 8 >, < 80 >, < any > will be generated.
,,,
The most specific pattern is created at the Machine View level, as the Machine View shows the most detailed information. 3.2
Many patterns will be generated via the Observer method—many of which may not be useful—since the observer will be recording all activity. We organize the patterns by creating a Pattern Tree that shows how the patterns are related to each other. The pattern tree will organize patterns from most general to most specific. The parent-child relationships in the pattern tree indicate varying levels of specificity and also indicate from whence the patterns were generated. Figure 6 shows a sample pattern tree. The root of the tree is the most general pattern possible, 141.142. < any > . < any >, < any >, < any >. This corresponds to the Galaxy View before any selections. If the user picks a range (in this case a square from the 2-D grid) of IP addresses to view in the Small Multiple View, a new pattern 141.142. < ipr1 > . < ipr2 >, < any >, < any > is created and added as a child to the root node. Thus, the second pattern is more specific than the root node. Within the Small Multiple View, if the user selects a single machine to bring up in the Machine View, the pattern 141.142. < subnet > . < host >, < any >, < any > is created and added as a child of the Small Multiple View pattern (141.142. < ipr1 > . < ipr2 >, < any >, < any >). Finally, if ports or protocols are chosen in the Machine View, these patterns are added as children to the pattern: 141.142. < subnet > . < host >, < any >, < any >. We can see that the parent pattern of a child shows from which view the child pattern was generated. When we add patterns that were generated in the Machine View, though, we add the port and protocol selections to all the nodes in the path from the Small Multiple View pattern to the root node—essentially creating aunt or uncle nodes. Figure 7 illustrates what happens when a pattern is added. 3.3
,,,
Organizing the Patterns
Symbolic Patterns
The symbolic patterns created by the system will be expressed in a simplified variant of the tcpdump filter language. Libpcap and tcpdump share a close dependency and are maintained by the same group ([3]). Libpcap serves as a library and API used to capture packets off of a network interface. Tcpdump, ethereal, snort and many other tools that listen to network traffic in promiscuous mode use the libpcap library. Libpcap uses BPF (Berkeley Packet Filter) to filter the traffic that is captured. Thus tools that use libcap inherit the filtering capabilities of BPF. Tcpdump’s syntax has become a de facto standard for most tools using libpcap. However, many tools have extended this filtering ability. For example, while tcpdump style filters can be used for packet capturing in ethereal, it supports another extended filtering language for display filters. BPF filters are quite powerful and can filter on source IP/subnet, source port, destination IP/subnet, destination port, protocol number, ICMP type and even TCP flags utilizing the standard boolean operators of AND, OR and NOT. Our NVisionIP filters implement a subset of these filter options in a tcpdump compatible format. Specifically we support filtering by IP address, port and protocol with no distinction between source and destination. We do, however, support one special method of selecting blocks of a class B network not supported by tcpdump. For example, to select the list of IP addresses {141.142.96.100,141.142.96.101,141.142.97.100,141.142.97.101}, we could write 141.142... This syntax would need to be expanded to specify each IP address individually in tcpdump. We make this notational shortcut for convenience because it is common to generate such a selection visually in NVisionIP. However, we provide a script to make such rules tcpdump compatible.
,,, ,,, ,,, Figure 6. Sample Pattern Tree. In this case, the user initially chose to view, in the Small Multiple View, the range of machines 141.142... The user then chose machine 141.142.25.36 to view in the Machine View. While viewing the bar graphs, the user clicked on the bars for port 98. The left hand branch of the tree indicates that the user choose to view the range 141.142..in the Small Multiple View, but did not go any further from there. ,,, ,,, ,,, ,,, ,,, ,,,
,,, ,,,
,,,
Figure 7. Pattern Tree from Figure 6, after choosing protocol 11. Four new patterns are added to the tree, one for each node on the path from the parent node to the root node. In this method, all possible patterns and combinations of patterns are stored.
3.4
An Example
Here we do a walk through of our tool.
Figure 8: NVisionIP Galaxy View with IP’s 178.78.161.154 to 178.78.170.166 selected
Here we show the user zooming into the range of ip addresses 178.78.161.154 to 178.78.170.166. As a result of this action, a pattern 178.78. < 161 − 170 > . < 154 − 166 >, < any >, < any > is created a placed as a child of the most generic pattern (178.78. < any > . < any >, < any >, < any >) in the pattern list:
Figure 9: Pattern tree with most generic pattern
As mentioned earlier, the pattern tree will organize patterns from most general to most specific, as seen above. The user can get more information on a specific machine by clicking on the machine in the Small Multiple View.
Figure 13: Pattern tree with protocol pattern added.
Once the patterns are created, they can be applied to the data within NVisionIP. For instance, the user can pick the specific pattern 178.78. < any > . < any >, < any >, < UDP >: Figure 10: Small Multiple View with IP address 178.78.164.158 selected
In this case, the user selected the machine (178.78.164.158) in the Small Multiple view. As a response to this action, a pattern 178.78. < 164 > . < 158 >, < any >, < any > is created and placed in the pattern tree as a child of 178.78. < 161 − 170 > . < 154 − 166 >, < any >, < any >, as can be seen here: Figure 14: Menu option to apply patterns to NVisionIP
and apply this pattern to the current data in NVisionIP. As a result, the application searches for all the IP addresses in the domain of 178.78 that used the UDP protocol. The Galaxy View of NVisionIP gets updated based on the result of this search:
Figure 11: Pattern tree with two nodes
In the Machine View, the user can click on the bar charts to create patterns:
Figure 15: Galaxy View after applying pattern
Also, the patterns in the tree can be saved to a file so that they can be applied to other netflow data sets in the future. We use a modified form of the tcpdump filter language to store the patterns:
Figure 12: Machine view of 178.78.164.158, with user selecting the UDP protocol bar
When the user clicks on a specific port or protocol in the machine view, a pattern is generated and placed accordingly in the pattern tree. In this scenario, when the user clicked on the UDP protocol bar chart of machine 178.78.164.158, a pattern 178.78. < 164 > . < 154 >, < any >, < UDP > is created and placed in the tree as a child of the pattern 178.78. < 164 > . < 154 >, < any >, < any >. Apart from this, two more patterns 178.78. < 161−170 > . < 154− 166 >, < any >, < UDP > and 178.78. < any > . < any >, < any > , < any > are created and placed in the tree:
Figure 16: Patterns in a modified tcpdump format
4
R ELATED W ORK
Visual data mining (VDM) focuses on using visualization to describe the data and patterns created by data mining (DM) algorithms. The visualization allows the user to discover more patterns in the data, evaluate the current patterns and then re-run the data mining algorithms with different inputs. The goals of VDM are very similar to our own, but while they focus on modifying the
working of a data mining algorithm, we focus on using the patterns created by the humans to search through the data. [7]. There has been much work on visualizing networks, The Atlas of Cyberspace ([5]) describes many of the early visualizations of the Internet. Some of the visualizations are geographical in nature, showing the traffic flow between machines as a link between the physical locations of the machines. Other visualizations , such as [4], focus on connectivity patterns and traffic volumes. In terms of visualization for security, Teoh et. al. [13] provides an example using BGP routing data. A new tool to enhance situational awareness is the Spinning Cube of Potential Doom [11]. This tool represents network traffic as points in 3D space. The addresses of the network being monitored lie on one axis, all possible source IP addresses lie on a second axis, and the third axis represents port numbers. The color of the points represent different characteristics of the traffic flows on the network. This presentation is similar to that of NVisionIP. Although similar to NVisionIP, the Spinning Cube of Potential Doom does not allow the user to drill down or filter for events of interest. One of the key differences is that we explicitly allow the user to create patterns from the user interface. In other approaches, even though the data is visually displayed the patterns found by the user must be noted by the user, and then transformed by the user into symbolic rules. 5
In our system we generate constraint sets from geographical information. Swift-3D can also provide other constraints such as constraints based on time and other attributes of the data set. In addition, there are capabilities to do top-10 queries. Currently we only use geographical information. When the user selects a geographical region of the map the set of wire centers that exist in that region are calculated. This set of wire centers are the constraint set for the origin wire center, termination wire center, and dialed wire center attributes. The modified guided Apriori algorithm defines an itemset to be interesting if it satisfies the constraint set. If the values of the origin wire center, terminating wire center, or dialed wire center attributes of an itemset are contained in the constraint set, then this itemset is interesting. An interesting itemset will have to satisfy a smaller support threshold. Our extension to the Apriori algorithm thus finds high support itemsets, but also finds itemsets that are interesting, according to a user defined measure of interesting. The itemsets found by the Apriori algorithm can then be viewed by the user. Thus we have closed-the-loop between the human, the visualization, and the data mining algorithm.
C LOSING - THE - LOOP BETWEEN A HUMAN , VISUALIZA TION AND A DATA MINING ALGORITHM . 5.1
It is clear that searching is a task well suited to machines, but machines can also aid humans in the discovery of patterns. The main problem with applying data mining/artificial intelligence algorithms to large data sets like security data are the large amount of irrelevant patterns that are generated. If the human can influence the search for patterns by the algorithm, it might be possible to find more interesting patterns. For instance, we have applied the Apriori association rule mining algorithm on data from AT&T’s voice network. The data set recorded the properties of calls made on the AT&T voice network. Each record in the data set represents a call, and consists of 7 attributes (a wirecenter is an aggregation of several area code regions): origin wire center - the origin of the call; termination wire center - the terminating wire center; dialed wire center - the wire center that was actually dialed (nearly always the same as the termination wire center); time - the time when the call was placed; duration - the duration of the call; answerindicator - whether the call was answered or not; and the final handling code - how the call was handled (if it failed, how did it fail). High support associations discovered via Apriori are often trivial, such as association between the final handling code to the answerindicator code. While these two attributes do have a connection, this association is not interesting for an analyst. For data mining techniques to aid in discovering interesting patterns, they must be guided to search for interesting patterns. The concept of interesting rapidly changes though, and is only known by the human. For instance, after 9/11, call records from the areas where the hijackers originated from would be highly interesting, whereas on other days records from these areas would not be interesting. In this preliminary work, we created a system in which the user can guide the Apriori association rule mining algorithm. In our system the user, via the Swift 3D visualization system ( Koutsofios [8]), specifies constraints on values of the attributes of the records. We call these constraints the constraint set. Note that the constraint set is only dependent upon the type of data and not dependent on the data mining algorithm.
An Example
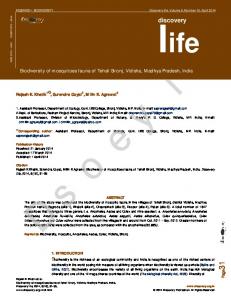
The figure below shows the main view of the Swift 3D visualization (see Koutsofios [8] for more details on the Swift tool)
Figure 17: Swift 3D view Copyright AT&T 2005 used by permission
The user can move, tilt, and zoom. The user has several querying options within Swift 3D, they can choose the top-10 wire centers, or pick a portion of time to search. The user can also query for all wirecenters that are within a geographical area by selecting a rectangular region with the pointer:
There are several extensions that are planned for this this work. Most importantly, the language used to represent a symbolic rule will be made much more powerful. We wil incorporate thresholds of traffic over ports and machines, as well as ranges of ports and protocols. This will necessarily mean a way of inferring the thresholds from the user interaction with NVisionIP. Time based patterns are of great importance to security engineers. In our future work we plan on focusing on time-based patterns that show correlations between events at different times. 7
ACKNOWLEDGEMENTS
Thanks to the SIFT (http://www.ncassr.org/projects/sift/) group members for ideas on this paper. Eleftherios Koutsofios, Chris Olsen, Gregg Vesonder, and Tamraparni Dasu from AT&T Research and Daniel Kiem of the University of Konstanz provided help and feedback on this work. Figure 18: Swift 3D - Selection from the Northeastern portion of the U.S.A. Map Copyright AT&T 2005 used by permission
When an area is selected a list of all the wirecenters from that area is generated. The list of wire centers constitute a set of constraints on the originating wire center, terminating wire center, and dialed wire center attributes of the records. We can use the set of constraints to guide the Apriori algorithm to allow lower support itemsets to be found. This results in itemsets that contain these wirecenters as values in those attributes. When the support threshold is set to .01, the itemsets that are generated are not that interesting. An example itemset that is generated is shown below: ∗, 99999, 99999, ∗, 0, −1, 0 This itemset, with support of .02%, indicates a correlation between the dialed wirecenter (99999), the terminating wire center (99999), the duration of the call (0), the answer indicator (-1), and the final handling code (0). 99999 is used to represent a number that could not be mapped to a wire center, either because the number was misdialed, or because the wire center is not in the U.S.A. Essentially, this itemset says that a call with a misdialed number will have duration 0. The data set used was a portion of the call data for July 13th, 2005. If the user chooses the Los Angeles area of California in Swift 3D, a constraint set will be generated that contains the wire center 567. Any itemsets that satisfy this constraint set on the originating wire center, terminating wire center, or dialed wire center attributes will be considered interesting. Running our apriori algorithm with the constraint sets results in some new itemsets being discovered:
R EFERENCES [1] [2] [3] [4]
[5] [6] [7] [8]
[9]
[10]
[11] [12]
[13]
99999, 567, 567, ∗, ∗, −1, 0 This itemset has support .005, but indicates that some unknown (possibly international) wire center is dialing to a wire center in the Los Angeles area of California. This itemset would be of interest to an analyst who is interested in the call records for the California area.
[14]
[15]
6
C ONCLUSION AND F UTURE W ORK
Security visualizations must incorporate the ability to generate symbolic rules from visual patterns if they are to be practical tools for security engineers. By automatically creating symbolic rules, the security engineers can reduce the amount of effort needed to create signatures. This will allow them to focus on discovering new attacks and interesting patterns, rather than on translating a visual pattern into a symbolic pattern.
www.snort.org. Argus web site. http://www.qosient.com/argus/index.htm. tcpdump. www.tcpdump.org. Greg Conti and K. Abdullah. Passive visual fingerprinting of network attack tools. In Proceeding of the CCS Workshop on Visualization and Data Mining for Computer Security (VizSEC/DMSEC) 2004. Martin Dodge and Rob Kitchin. Atlas of Cyberspace. Addison Wesley, Harlow, 2001. Yiming Gong. Identifying p2p users using traffic analysis. www.securityfocus.com/infocus/1843, July 2004. Jiawei Han and Micheline Kamber. Data Mining: Concepts and Techniques. Morgan Kaufmann, 2001. Eleftherios Koutsofios, Stephen C. North, Russell Truscott, and Daniel A. Keim. Visualizing large-scale telecommunication networks and services. In IEEE Visualization, pages 457–461, 1999. Kiran Lakkaraju, Ratna Bearavolu, Adam Slagell, and William Yurcik. Closing-the-loop: Discovery and search in security visualizations. In Proceedings of the 6th IEEE Information Assurance Workshop, 2005. Kiran Lakkaraju, William Yurcik, Adam J. Lee, Ratna Bearavolu, Yifan Li, and Xiaoxin Yin. Nvisionip: Netflow visualizations of system state for security situational awareness. In Proceeding of the CCS Workshop on Visualization and Data Mining for Computer Security (VizSEC/DMSEC) 2004. Stephen Lau. The spinning cube of potential doom. Communications of the ACM, 47(6):25–26, 2004. Vern Paxson. Bro: a system for detecting network intruders in realtime. Computer Networks (Amsterdam, Netherlands: 1999), 31(23– 24):2435–2463, 1999. Soon Tee Teoh, Kwan-Liu Ma, S. Felix Wu, and Xiaoling Zhao. Case study: Interactive visualization for internet security. In IEEE Visualization, 2002. Soon Tee Teoh, Ke Zhang, Shih-Ming Tseng, Kwan-Liu Ma, and S. Felix Wu. Combining visual and automated data mining for nearreal-time anomaly detection and analysis in bgp. In VizSEC/DMSEC ’04: Proceedings of the 2004 ACM workshop on Visualization and data mining for computer security, pages 35–44, New York, NY, USA, 2004. ACM Press. Xiaoxin Yin, William Yurcik, Michael Treaster, Yifan Li, and Kiran Lakkaraju. Visflowconnect: Netflow visualizations of link relationships for security situational awareness. In Proceeding of the CCS Workshop on Visualization and Data Mining for Computer Security (VizSEC/DMSEC) 2004.