computing by offering affordable desktop access to all, pushing it then to a ... was invented with Tim Berner-Lee's development of the HTTP protocol and the ...
IGI Global Microsoft Word 2007 Template Reference templateInstructions.pdf for detailed instructions on using this document.
Cloud and Mobile Web-based Graphics and Visualization Haim Levkowitz University of Massachusetts Lowell, USA Curran Kelleher University of Massachusetts Lowell, USA
Introduction Cloud computing will likely be the most prevailing computing platform in the next several years. The World-Wide Web has progressed from essentially an electronic bulletin board (with hyperlinking capabilities) to a nearly complete application platform. Cloud+Mobile, the combination of mobile computing and cloud computing, is changing how developers produce, and how users consume computing resources. Visual computing has been, and is being impacted by this same revolution. The recent introduction of HTML5, related graphics technologies, and their rapid penetration, have made high-quality browser-based interactive graphics a reality. Where lightning fast interactivity is required, client-side rendering technologies such as SVG, Canvas, and WebGL can be employed. Where graphical “heavy lifting” is required or if client devices are too slow, rendering can take place on the server side. Regardless of implementation details, we envision that the Cloud+Mobile platform will become the most common platform for computer graphics and visualization in the near future. Furthermore, this platform will democratize the use of advanced graphics and visualization techniques, and it stands to revolutionize mainstream data analysis using interactive visualization. Our goals in this chapter are to make the reader familiar with the underlying technologies that enable computer graphics implementation on the Cloud+Mobile platform.
Background The first computers were extremely large, and access to them was limited to dedicated staff. They possessed less computing power than today’s smartphones. The personal computer “democratized” computing by offering affordable desktop access to all, pushing it then to a briefcase. The Internet connected these computers, and the World-Wide Web (“The Web”) made that connectivity user-friendly enough to expand the Internet’s user base beyond the realm of techies. Recent mobile devices, such as smartphones and tablets, have extended the reach of the Web to people who never imagined they would become computer users. Visual computing (the aggregate of computer graphics, computer vision, image processing, and data visualization) has followed a somewhat parallel path. Although graphics hardware has become more powerful, less costly, and more portable over the years, graphics software has not enjoyed the same reach as Web pages in general until very recently. New technologies such as HTML5 and cloud computing have created a new computing environment that makes it now feasible to build interactive graphics applications that, for example, allow users to view and interact with huge quantities of data in visual form, and control the process from a mobile device in their palm.
A Brief History of Computer Graphics and the World-Wide Web
IGI Global Microsoft Word 2007 Template Reference templateInstructions.pdf for detailed instructions on using this document.
We start with a brief (and incomplete) history of Computer Graphics and the World-Wide Web. For more details, see, e.g., (Foley, van Dam, Feiner, & Hughes, 1990; Shoaff , 2000; Chapman, 2009; Berners-Lee, 2000) The early days: the birth of Computer Graphics Early computers only recognized and displayed alphanumeric text. Ivan Sutherland invented interactive computer graphics in his 1963 MIT Ph.D. dissertation, Sketchpad (Sutherland, 1963). Sutherland’s system used a light-pen to provide input to an interactive vector-graphics display. Around the same time, and into the 1970s, several developments progressed the state-of-the-art of interactive computer graphics. Bresenham (1965; 1977) introduced algorithms to draw line segments, circles, and other primitives efficiently on raster displays. Coons (1966; 1966a; 1968; 1977) and Bezier (Rogers, 2001) developed parametric surface representations and created the foundations of computer-aided geometric design. Appel (1967; 1968) and Crow (1977) developed hidden-surface removal and shadowing. Engelbart invented the mouse. Evans & Sutherland built flight simulators utilizing raster graphics. Gouraud (1971) and Phong (1975) introduced new rendering and reflection models. A paint program was developed at Xerox PARC. Catmull (1974) gave light to parametric patch rendering, the zbuffer algorithm, and texture mapping. Recursive ray-tracing (Whitted, 1980) became the standard for photorealistic rendering. Apple launched the personal computer age with its first computer. The first SIGGRAPH conference offered a meeting place to discuss and exchange ideas about new developments in interactive computer graphics, animation, and related visual computing innovations. The 1980s: CG in film, the PC, the GUI, desktop publishing, Pixar, GL, shaders The 1980s gave rise to fractals (Fournier, Fussell, & Carpenter, 1982) and Adobe Systems with its Postscript page layout language and Photoshop. Computer animation was launched and video arcades became an attraction. Disney released TRON, which had more than 20 minutes of computer-generated animation. IBM introduced the PC. Raiders of the Lost Ark won an Oscar for computer generated visual effects. ILM’s Genesis Effect in Startrek II revolutionized computer-animated special effects for film. Pixar was founded, first as a special-purpose graphics hardware maker, then evolving into a software producer, and finally into a production house, which would produce Toy Story, the first completely computer-animated film. In addition, in 1988 Pixar offered the “RenderMan Interface Specification” to the graphics world (Upstill, 1990). That specification also introduced the use of shaders, which would later become – and remain today – the prevailing way to implement the graphics pipeline. The 1984 launch of the Apple Macintosh opened a new era by popularizing the Graphical User Interface (GUI, also invented at Xerox PARC), which made computers much more accessible to lay people, and the launch of the desktop publishing revolution. (By some estimates, close to 90% of all compute cycles in the world are dedicated to handling GUI-related tasks.) In 1989 the World-Wide Web was invented with Tim Berner-Lee’s development of the HTTP protocol and the HTML markup language and the introduction of the first server and browser (Berners-Lee, 2000). Silicon Graphics, Inc. (SGI) introduced the graphics pipeline in hardware, and gave rise to the graphics library GL, which would lead to OpenGL, OpenGL ES, and eventually WebGL. The 1990s: the WWW, more powerful graphic displays In the 1990s more advanced graphics found its way into more films. Standard graphics hardware provided 24-bit raster displays and much more graphics support. Mosaic, the first widely available graphical Web browser really launched the Web era by bringing the Web to wider populations. The 2000s: interactive CG popularized, the growing and maturing WWW
IGI Global Microsoft Word 2007 Template Reference templateInstructions.pdf for detailed instructions on using this document.
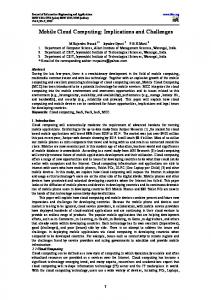
During the 2000s graphics capabilities trickled down from special purpose equipment to the consumer-level PC, while becoming more capable at the same time. A wide variety of input/output devices became standard equipment in almost every office and household. The performance and accuracy of three-dimensional modeling surpassed previous capabilities. Since the mid 1990s, when the Web expanded beyond the academic and military world, it has gone through a progressive transformation from an electronic bulletin board to a full application development platform. The graphics pipeline, shaders, GPUs Traditional computer graphics has been built on the graphics pipeline concept (see Figure 1). The pipeline implements a sequence of steps, accepting as input a description of objects in a 3D world, and producing as output a 2D image on the screen. A 3D scene is defined by its objects’ geometric and other properties (such as color, texture, transparency and translucency, and surface reflectance properties), the scene’s light source positions and properties, and the viewer’s (or camera’s) position. The pipeline’s role is to compute the correct colors, lighting, and shading values for each pixel in the resulting 2D image. Early implementations computed these values at polygon vertices only; during rasterization (the process of determining which pixels need to be painted and where) values between computed pixels were interpolated.
Figure 1. The Rendering Pipeline. Pixar’s introduction of shaders in RenderMan (Upstill, 1990) offered a new and more flexible way to implement the graphics pipeline. Shaders are attached to pixels or vertices. Each shader is responsible for computing the color and lighting values of “its” pixel or vertex. Whereas the implementation of the traditional graphics pipeline is rigid, shader programs can change and provide flexibility in the computation of “their” pixels and vertices. The proliferation of Graphical Processing Units (GPUs) has made it possible to execute shaders for many pixels and vertices in parallel, typically using stream processing techniques within the GPU. While GPUs have been developed for graphic applications, the parallel processing architecture has become immensely popular for solving non-graphic problems that lend themselves to highly-parallel solutions (Ebert, Musgrave, Peachey, Perlin, & Worley, 2002). From text-centered to media-centered computing The continuous trend away from text-only, command-based computing to graphical, visual, and multi-media based computing, both on the desktop and on the Internet, have caused a real revolution in that it has brought a significant portion of the world’s population into the fold of computer users. This progress led the way to the technologies and capabilities we describe below. These new platforms will bring into that fold most of the rest of the world’s population. This revolution is already well on its way.
Web Graphics Technologies
IGI Global Microsoft Word 2007 Template Reference templateInstructions.pdf for detailed instructions on using this document.
HTML5 HTML5 is the latest incarnation of the standard that specifies HTML, the markup language that defines Web pages (Berjon et al., 2012). The HTML5 specification is maintained by the World Wide Web Consortium (W3C), and is guided by input from many stakeholders, including many prominent technology companies and research institutions worldwide. HTML5 contains a number of specific technologies and APIs, several of which provide interactive graphics capability: Scalable Vector Graphics (SVG), Canvas, and WebGL. When loaded by a Web browser, HTML markup defines a Document Object Model (DOM) that can be accessed and manipulated dynamically by JavaScript code. From the application developer’s point of view, the HTML5 specification defines the set of APIs (Application Programming Interfaces) that are available within various DOM elements. SVG SVG (Scalable Vector Graphics) is a W3C standard that defines a retained-mode twodimensional vector graphics API (Dahlström et al. 2011). Retained-mode graphics frameworks such as SVG allow developers to define a high-level representation of the graphical scene, and take responsibility for rendering them to the display. From the developer’s perspective, SVG can be used to build interactive graphics by simply manipulating the DOM tree. The SVG engine inside the browser takes care of rendering the graphics specified in the DOM. Canvas HTML5 Canvas is a W3C standard that defines an immediate-mode graphics API (Hixie, 2012). Immediate-mode graphics frameworks such as Canvas give developers access to the pixels of the image buffer that gets displayed, providing functions for “painting” graphical elements onto the image. See Figure 2 for example code. Figure 2. Example code for HTML5 Canvas. WebGL WebGL is essentially a browser-based JavaScript binding for OpenGL ES (Marrin, 2011). OpenGL is a mature platform for high performance 2D and 3D graphics, and its evolution has paralleled that of graphics hardware. OpenGL ES (Embedded Systems) is a subset of OpenGL suitable for implementation in embedded systems and mobile devices. The OpenGL, OpenGL ES, and WebGL standards are maintained by the Khronos Group. OpenGL and OpenGL ES support developers in taking advantage of the blazingly fast massively parallel rendering and computing capabilities of GPUs (Graphics Processing Units). As a consequence, most rendering operations in WebGL involve the definition of an array of vertices in the CPU, transfer of the vertex array from the CPU to the GPU, and rendering of the vertices on the GPU as defined by OpenGL commands and options. In OpenGL ES (and therefore in WebGL), developers must always define their own shaders. A shader is a program that operates on either vertices or pixels, and gets executed in parallel on the GPU as part of the rendering pipeline. Server-Side Rendering and Hybrid Systems
IGI Global Microsoft Word 2007 Template Reference templateInstructions.pdf for detailed instructions on using this document.
When rendering large quantities of data, it is sometimes more reasonable to perform rendering on the server side and transfer the image to the client for display rather than transfer the data to the client and perform rendering there. Hybrid systems can be constructed in which some parts of the graphic are server-side rendered and other parts are client-side rendered. The most typical use case for this approach is for interactive visualizations with geographic maps as their base layer.
Fundamentals of Web-based Interactive Graphics In this section we discuss fundamental graphics concepts and how they relate to Web-based graphics technologies. A visual illustration of these concepts is included in Figure 3.
Figure 3. Illustrations of fundamental graphics concepts. Fill and stroke style variations include solid colors (a), transparency (b), a gradient (c) and a tiled image pattern (d). Points In most 2D graphics frameworks, including HTML5 Canvas and SVG, points are represented as (x, y) coordinates on a two-dimensional Cartesian plane where integer coordinates correspond to pixels on the screen. The (0, 0) coordinate is at the upper left corner of the display, and the (width, height) coordinate is at the bottom right corner, where “width” and “height” are the dimensions of the available drawing area. This can be confusing at first, because contrary to intuition derived from mathematical convention, an increase in the y coordinate causes the point to move down rather than up. In WebGL, coordinates of points (also called “vertices”) typically have three components (x, y, z). These coordinates are projected to the display for rendering using matrices for projection, translation, and rotation. With 3D coordinates, there is no direct correspondence to pixels, so developers often choose coordinates that are simple to work with (such as the unit cube) or coordinates that correspond to a model of a 3D world. With SVG and Canvas, drawing individual points is usually done by filling a single pixel, or approximating the point with a square or circle. In WebGL, vertices can be rendered as single-pixel points using the POINTS rendering mode. Lines A line in 2D graphics is a straight connection between two points that has color and thickness. Lines also have style attributes such as how they are capped and joined. Cap styles in HTML5 Canvas include “butt”, terminating the line as a rectangle exactly at the endpoints, “round”, capping the ends with circles centered at the endpoints, and “square”, capping the ends with squares centered on the endpoints. SVG provides a line primitive with similar styling options. WebGL supports drawing simple lines using the OpenGL rendering modes LINES, LINE_STRIP, or LINE_LOOP. Styled lines must be created using triangles in WebGL. Polygons
IGI Global Microsoft Word 2007 Template Reference templateInstructions.pdf for detailed instructions on using this document.
Polygons in 2D graphics are closed regions bounded by line segments. SVG allows developers to render polygons by adding lists of 2D coordinate objects to the DOM. Canvas supports polygon rendering by issuing a sequence of commands that begin the polygon definition, add vertices one by one to the polygon boundary, and end the polygon definition. To render polygons (or their 3D variant, meshes) using WebGL, developers must first partition the polygon or mesh into a set of triangles, then render them using the rendering modes TRIANGLES, TRIANGLE_STRIP, or TRIANGLE_FAN. Arcs An arc is a region bounded by a semicircle. A circle is an arc that starts at angle 0 and ends at 360 degrees. Canvas and SVG have special constructs for arcs, but WebGL does not. If arcs and circles are needed when using WebGL, they must be approximated by polygons. Fill and Stroke In 2D graphics, the “fill” of a shape is the graphical content drawn inside of it, and its “stroke” is the graphical content drawn in an outline around the shape. Stroke width can vary. The most common fill and stroke styles are solid colors (with optional opacity), but fill and stroke styles can also be gradients, textures, or tessellated images. SVG and Canvas support rich fill and stroke styles. WebGL does not directly support the notions of fill and stroke, however this functionality can be implemented using the lower-level constructs available. Rasterization Although humans and programs define graphics in terms of geometry and styling, the end result is only visible on a computer display. A computer display is a grid of pixels, each pixel having its own color that can change over time. The typical refresh rate for modern displays is at least 60 FPS (Frames Per Second), meaning that pixels can change color 60 times every second. In Web-based graphics, the developer is given access only to a restricted portion of the display visible inside a Web page. Whichever graphics technology is used, the visible image is ultimately rendered into a grid of colored pixels (often referred to as the “raster buffer”, “image buffer”, or “pixel buffer”). When using SVG, developers define the geometry and style of graphical objects, and the SVG rendering engine takes care of the rendering completely. When using Canvas, developers define algorithms that issue sequences of commands, including commands to clear the bitmap, commands that set the style of the next things to be drawn, and commands to draw objects such as arcs, lines, and polygons. The Canvas implementation provided by the browser is responsible for transforming this sequence of commands into the raster buffer that gets displayed in the page. The rendering implementations for SVG and Canvas typically operate by running rasterization algorithms (that fill in pixels for lines and shapes) in the CPU. This is often referred to as “software rendering”. WebGL operates completely differently, by taking advantage of the parallel processing and rendering capabilities built into the GPU. When using WebGL, the arrays of vertices for graphical elements are defined in the application software running on the CPU, then transferred to the GPU for processing by the OpenGL rendering pipeline. Rendering on the GPU is much faster than on the CPU because massively parallel processors are utilized. Anti-aliasing is a technique for combating artifacts that are the result of sampling a continuous world into a discrete representation. In particular, it is applied to making edges look smooth. By default, lines and polygons are anti-aliased in Canvas, SVG, and WebGL. Rendering with anti-aliasing enabled is slower than rendering without it. When a high frame rate is critical and the number of elements rendered
IGI Global Microsoft Word 2007 Template Reference templateInstructions.pdf for detailed instructions on using this document.
is large, anti-aliasing can be disabled to achieve faster performance in exchange for rougher looking graphics. Animation Animation is achieved by periodically changing the scene and redrawing it. In HTML5, a special function has been introduced for animation timing called requestAnimationFrame. This function enables developers to schedule a rendering function to execute at 60 FPS, synchronized with the refresh rate of the display if possible. Previously, animations in JavaScript were scheduled using the functions setTimeout and setInterval, which are imprecise timer functions built into the browser. Regardless of which rendering technology is used, it is recommended that all animations use requestAnimationFrame for scheduling rendering. When implementing animation using SVG, a developer need only periodically update the SVG elements present in the DOM. The SVG rendering engine will automatically take care of updating the display to reflect the new changes every frame. SVG engines are typically optimized such that they only clear and redraw those regions of the display that have changed (so-called “dirty regions”). When implementing animation using Canvas, developers must manually manage redrawing of dirty regions. The simplest approach is to clear the entire canvas and redraw the scene each frame by traversing a data structure defined by the application developer. For example, one way of implementing a bouncing ball involves incrementing a simple simulation, clearing the canvas, and drawing a circle based on the ball coordinates every frame. When implementing animation using WebGL, care must be taken to avoid costly operations that transfer data to the GPU. Typically, the vertices of a scene are transferred to the GPU only once, and for each frame only updated transformation matrices are transferred to the GPU for use in rendering. Such changes often use the OpenGL uniform construct, which acts as a global variable in the GPU, accessible to all shaders. For example, to implement navigation through a 3D scene, only the new camera location needs to be transferred to the GPU each frame before re-rendering. Double Buffering Double buffering refers to the practice of maintaining two image buffers to achieve seamless animation. While one buffer is being displayed, the scene is re-drawn on the off-screen buffer. Once the scene is fully rendered on the off-screen buffer, the buffers are swapped and the newly rendered scene gets displayed. If double buffering is not used, partially rendered scenes may be displayed in an animation sequence, causing an unpleasant flickering effect. Developers using SVG or HTML5 Canvas usually need not worry about double buffering. SVG rendering engines implement double buffering internally. Canvas supports multiple off-screen buffers, and also implements double buffering by default. The content of a Canvas element is flushed to the display on the JavaScript event loop, taking advantage of the single-threaded nature of JavaScript. This means that any code that clears and re-draws Canvas content will run to completion before the Canvas is redisplayed. Double buffering can be implemented in WebGL using standard OpenGL techniques. Interaction Mouse, keyboard, and multi-touch events are available to HTML5 applications. No matter what underlying graphics technology is used, these events can be registered as JavaScript functions through DOM APIs. It is the responsibility of developers to connect these events to computations that update the graphics appropriately.
IGI Global Microsoft Word 2007 Template Reference templateInstructions.pdf for detailed instructions on using this document.
Let us consider the case of dragging circles around the display. If using Canvas or WebGL, the developer must write code that finds out which circle is clicked on based on the coordinates from the event. Since each SVG element is a DOM node, event listeners can be added to them directly. In this case, detection of which circle is under the mouse is performed automatically by the SVG engine. This is often cited as an advantage of SVG. In scenes that are static except during interactions, it is common practice for event handlers to perform a re-rendering of the scene directly, without an animation loop. In continuously animated scenes, event handlers typically only modify the scene model, and the animation loop takes care of re-rendering.
Libraries
Figure 4. Examples from open source libraries: Three.js (left four), D3 (middle four), Box2d.js (upper right corner), and Ammo.js (lower right corner). So far we have discussed how fundamental graphics concepts relate to the SVG, Canvas, and WebGL Web-based graphics technologies. In order to make these standard APIs easier to work with, developers have produced a number of widely used open source projects that stand between application code and standard API calls. Screen shots of open source examples listed directly on the project pages (Miguel, 2012), (Bostock, 2012), (Resig et al., 2012), (Baranovskiy, 2012), (Yasushi, 2012), (Zakai, 2012) are included in figure 4.
Three.js - a 3D scene graph library backed by SVG, Canvas, or WebGL (hence the name).
D3.js - a data-driven DOM manipulation library designed for creating interactive SVG visualizations.
Processing.js - a port of the popular Processing language and API to JavaScript, utilizing Canvas.
Raphael.js - a library that provides a feature-rich API for working with SVG graphics.
Box2d.js, Ammo.js - 2D and 3D physics engines, ported to JavaScript from C++ projects.
Application Areas and Case Studies In this section, we discuss a selection of projects that exemplify Web-based visual computing.
IGI Global Microsoft Word 2007 Template Reference templateInstructions.pdf for detailed instructions on using this document.
Figure 5. Example applications: Google Maps (upper left), TileMill (lower left), Zygote Body (center), Tableau Public (upper right), and GapMinder (lower right). Mapping Google Maps Perhaps the most well-known and popular, Google Maps provides users with a rich set of features, including map navigation (zooming and panning), directions, 3D buildings, terrain and satellite views, traffic visualization, and search (Google, 2012). Google Maps is also available as a mobile application that provides navigation functionality for users on the go. Google Maps is an example of a hybrid system that renders partially on the server side (the base map layer) and partially on the client (interactive features such as direction paths, search results, traffic patterns, and 3D buildings). OpenStreetMap OpenStreetMap is a project that leverages mass-collaboration for assembling a large global geographic database (OpenStreetMap, 2012). OpenStreetMap clients use Web-based graphics technology to display and navigate server-side rendered map tiles. TileMill and MapNik TileMill is a project providing stylized server-side rendering of map tiles, with additional support for geographically situated data-driven visualizations, such as choropleth maps, heat maps, glyph-based visualizations, and many more (MapBox, 2012). TileMill is built using Node.js, the Carto styling language, and the Mapnik rendering engine. TileMill is developed by MapBox, a company providing cloud-based interactive map design and publication services. Health Zygote Body Zygote Body, formerly Google Body Browser, is a tool for navigating a layered 3D model of the human body (Zygote Media Group, 2012). Users can peel away layers to see skin, muscles, internal organs, the cardiovascular system, and the nervous system. The project utilizes WebGL for client-side 3D rendering and navigation. Data Visualization
IGI Global Microsoft Word 2007 Template Reference templateInstructions.pdf for detailed instructions on using this document.
GapMinder GapMinder is a tool pioneered by Professor Hans Rosling that provides a limited set of interactive visualizations for global socioeconomic indicators covering a wide range of topics (Rosling, 2012). Though GapMinder uses Flash technology rather than Web standards, it is a powerful example of the communicative power of interactive Web-based information visualization. Tableau Public Tableau Public is a publicly accessible deployment of the Web-based version of the Tableau data visualization tool (Tableau Software, 2012). Tableau Public allows users to use their user interface to create and publish interactive Web-based data visualizations. The approach taken by the Web-based variant of Tableau is that the visualizations are rendered on the server-side and transferred to the client as images. Some interactive components (such as tool tips) are rendered on the client side. As anyone can publish interactive visualizations using Tableau Public, it is a great example demonstrating the democratization of visual data analysis. Documents and Publications Traditional paper-based publications are giving way to more capable electronic formats. HTML5 is at the forefront of this transition, with support for rich typesetting and formatting options and with the ability to replace static figures with interactive graphics. For example, newspapers such as the New York Times and the Boston Globe now have departments dedicated to creating interactive graphics and visualizations. Also, many magazines offer both an in-print and tablet-based publication (such as Wired or Popular Mechanics) with the tablet version often and increasingly providing a much richer experience.
Rendering Architectures and Tradeoffs When designing and implementing a project with visual computing on the Cloud+Mobile platform, there are many alternative options available for rendering architectures. These can be broken down in terms of rendering location (client vs. server), hardware utilized for rendering (CPU vs. GPU), and abstraction level (retained-mode vs. immediate-mode). The tradeoffs and considerations for these options are summarized in table 1. Issue
Options Pros Cons Client Instant interaction Limited data scalability Server Delayed interaction Higher data scalability Hardware CPU-based Rendering Strong support for Slower for large loads, (SVG, Canvas) 2D graphics easier to program GPU-based Rendering Strong support for Steep learning curve (WebGL) fast 3D graphics Abstraction level Retained-mode Simpler to program Less rendering control Immediate-mode More to manage More rendering control Table 1. Pros and cons of various rendering architectures for cloud+mobile systems. Location
In general, one can use the following thought process to decide which approach to take. The simplest approach is to use client-side rendered retained-mode graphics. If access to extremely large data is required, consider server-side rendering. If satisfactory performance or flexibility is not possible using retained mode, consider immediate mode. If 3D graphics are required, consider using the GPU (i.e., OpenGL, WebGL). Scenegraph libraries simplify 3D programming (e.g., Three.js). Use of the raw
IGI Global Microsoft Word 2007 Template Reference templateInstructions.pdf for detailed instructions on using this document.
WebGL API gives more fine-grained control over the rendering process but is more difficult to learn and program.
Deployment Strategies for Cloud+Mobile When beginning a project for Cloud+Mobile, the first decisions include “what server-side technology stack to use?” and “how to deploy the client?” There are a plethora of options available. We discuss below a small selection of some of the most promising approaches today. Server Deployment Programming Languages and Frameworks A huge number of open source options are available for authoring software that runs on the server in a cloud environment. The classic combination of Linux, Apache, MySQL and PHP (“LAMP”) is a great option using proven technologies. Ruby on Rails is a high-level Web application framework that emphasizes concise code and software engineering patterns such as convention over configuration. Django is a popular Web framework for the Python language. The Java platform provides a wide variety of server-side tools, such as Java Server Pages, the Spring Framework, and Grails. Node.js, a Unix-based JavaScript runtime environment, is a rapidly growing platform providing rich Web development frameworks including Express and Geddy. One advantage of Node.js for Web application development is that the same programming language is used on both the client and server, making the software development experience seamless and straightforward. Cloud Services Cloud computing services fall within the following general categories:
Software as a Service (SaaS) – Applications are provided (e.g., Google Apps, Salesforce).
Platform as a Service (PaaS) – Execution environments are provided (e.g., Engine Yard, Heroku). These are the most relevant in building scalable cloud+mobile systems.
Infrastructure as a Service (IaaS) – Virtual machines are provided (e.g., Amazon, Rackspace).
Client Deployment HTML5 mobile applications can be run either in the Web browser of the device, installed locally as a “Mobile Web App”, or installed locally as a native application. Of the three strategies, browser-based HTML5 apps are the most straightforward to create, as they are simply Web pages loaded into the browser. “Mobile Web Apps” are essentially links to Web pages that can be situated as icons on the home screen of mobile devices. Addition of only a few mobile-specific HTML tags is all that is required to enable features of mobile Web apps, such as an icon representation, full screen display, and fine-grained control of the viewport. Deployment of HTML5 apps as native mobile apps is also possible, using tools that wrap the app in a native Web view such as PhoneGap and Appcellerator Titanium.
Future Research Directions Many technologies are available today to support the growing Cloud+Mobile platform in general, and supporting visual computing in particular. And many new ones keep appearing every day. As has been the case in the past, not all of these technologies and platforms will survive. The lack of compatibility among many of them will force changes that will allow interoperability across platforms. As is often the case, where they do not currently exist, standards will have to be developed and deployed, and the field will have to converge to those standards. Usability (both for developers and for users) and
IGI Global Microsoft Word 2007 Template Reference templateInstructions.pdf for detailed instructions on using this document.
performance will ultimately dictate which technologies will remain with us for a longer period and which will disappear.
Conclusion When Ivan Sutherland wrote Sketchpad, his Ph.D. dissertation in the early 1960s, very few people had an idea what a computer was. Few had seen one, and even fewer had gotten close to using one. When children and young people started playing video games they rarely gave thought to the fact that they were interacting with a computer, utilizing computer graphics technologies. Likewise, today’s smartphone users do not consider themselves computer- or computer-graphics users. Yet every day more people adopt mobile technologies, and expect more from them. Just as the World-Wide Web gave people the opportunity to easily consume – but also produce – vast amounts of information, today’s mobile devices augment the scope of users’ information consumption, but also their role as data producers. Every mobile device, its sensors, and apps are potential data generators, as is every Web-page visit and hyperlink click. With the cost of storage down to almost zero, it is very easy to gather and store huge amounts of data. And most companies and businesses are putting an ever-higher value on the data they collect. But without ways to analyze that data, its real value is not being extracted. Both enterprises and individual users encounter the need to analyze these growing amounts of data on a daily basis. With a mobile device in the pocket, working in tandem with potentially unlimited cloud-based storage and processing resources, substantial data analysis capabilities are becoming available to anybody, anytime, any place. The technologies surveyed in this chapter provide the fundamental framework for this “democratization of information and knowledge”. That is a real revolution, and it is happening now.
Bibliography Appel, A. (1967), “The notion of quantitative invisibility and the machine rendering of solids,” in Proceedings of the 1967 22nd national conference, ser. ACM ’67. New York, NY, USA: ACM, 1967, pp. 387–393. (http://doi.acm.org/10.1145/800196.806007) Appel, A. (1968), “Some techniques for shading machine renderings of solids,” in Proceedings of the April 30–May 2, 1968, spring joint computer conference, ser. AFIPS ’68 (Spring). New York, NY, USA: ACM, 1968, pp. 37–45. (http://doi.acm.org/10.1145/1468075.1468082) Baranovskiy, D. (2012). Raphaël - JavaScript Library. Retrieved November 12, 2012, from http://raphaeljs.com/ Berjon, R., Leithead, T., Doyle, E., O'Connor, E., Pfeiffer, S. (2012). HTML5, A vocabulary and associated APIs for HTML and XHTML. World Wide Web Consortium. Retrieved November 12, 2012, from http://www.w3.org/TR/html5/ Berners-Lee, T. (2000), “Weaving the Web: The Original Design and Ultimate Destiny of the World Wide Web,” HarperBusiness, 2000, ISBN-13: 978-0062515872 Bostock, M. and collaborators. (2012). Data Driven Documents. Retrieved November 12, 2012, from http://d3js.org/ Bresenham, J. E. (1965). “Algorithm for computer control of a digital plotter,” j-IBM-SYS-J, vol. 4, no. 1, pp. 25–30, 1965.
IGI Global Microsoft Word 2007 Template Reference templateInstructions.pdf for detailed instructions on using this document.
Bresenham, J. (1977), “A linear algorithm for incremental digital display of circular arcs,” Commun. ACM, vol. 20, no. 2, pp. 100–106, Feb. 1977. (http://doi.acm.org/10.1145/359423.359432) Catmull, E. E. (1974), “A subdivision algorithm for computer display of curved surfaces.” Ph.D. dissertation, 1974. Chapman, C. (2009), “The History of the Internet in a Nutshell,” http://sixrevisions.com/resources/thehistory-of-the-internet-in-a-nutshell/, 2009 Coons, S. A. (1966), “Computer graphics and innovative engineering design—super-sculptor,” DATAMATION, vol. 12, no. 5, p. 3234, 1966. Coons, S. A. (1966a), “Uses of computers in technology,” SCIENTIFIC AMERICAN, vol. 215, no. 3, p. 177, 1966. Coons, S. A. (1977), “Modification of shape of piecewise curves,” COMPUTERAIDED DESIGN, vol. 9, no. 3, pp. 178–180, 1977. Crow, F. C. (1977), “Shadow algorithms for computer graphics,” in Proceedings of the 4th annual conference on Computer graphics and interactive techniques, ser. SIGGRAPH ’77. New York, NY, USA: ACM, 1977, pp. 242–248. (http://doi.acm.org/10.1145/563858.563901) Dahlström, E., Dengler, P., Grasso, P., Lilley, C., McCormack, C., Schepers, D., Watt, J., Ferraiolo, J., Jackson, D. (2011). Scalable Vector Graphics (SVG) 1.1 (Second Edition), W3C Recommendation. World Wide Web Consortium. Retrieved November 12, 2012, from www.w3.org/TR/SVG11/ Ebert, D. S., Musgrave, F. K., Peachey, D., Perlin, K., Worley, S. (2002), “Texturing and Modeling, Third Edition: A Procedural Approach,” The Morgan Kaufmann Series in Computer Graphics, ISBN 012-228730-4 Foley, J. D., van Dam, A., Feiner, S., and Hughes, J. (1990), “Computer Graphics: Principles and Practice,” 2nd ed. Reading, MA: Addison Wesley, 1990. Fournier, A., Fussell, D., and Carpenter, L. (1982), “Computer rendering of stochastic models,” Commun. ACM, vol. 25, no. 6, pp. 371–384, Jun. 1982. (http://doi.acm.org/10.1145/358523.358553) Google. (2012). Google Maps. Retrieved November 12, 2012, from https://maps.google.com/ Gouraud, H. (1971), “Continuous shading of curved surfaces,” IEEE Transactions on Computers, vol. C20, no. 6, pp. 623–629, Jun. 1971. Hixie, I. (2012). The Canvas Element. WHATWG . Retrieved November 12, 2012, www.whatwg.org/specs/web-apps/current-work/multipage/the-canvas-element.html MapBox. (2012). TileMill. MapBox. Retrieved November 12, 2012, from http://mapbox.com/tilemill/ Marrin, C. (2011). WebGL Specification. Khronos Group. Retrieved November 12, 2012, from https://www.khronos.org/registry/webgl/specs/1.0/ Miguel, R. and collaborators. (2012), Three.js. Retrieved November 12, 2012, from
IGI Global Microsoft Word 2007 Template Reference templateInstructions.pdf for detailed instructions on using this document.
http://mrdoob.github.com/three.js OpenStreetMap. (2012). OpenStreetMap. The OpenStreetMap Project Retrieved November 12, 2012, from http://www.openstreetmap.org/ Phong, B.-T. (1975), “Illumination for Computer Generated Pictures,” j-CACM, vol. 18, no. 6, pp. 311–317, 1975. Resig, J., Fry, B., Reas, C. (2012). Processing.js. Retrieved November 12, 2012, from http://processingjs.org/ Rogers, D. F. (2001), An Introduction to NURBS with Historical Perspective, Morgan Kaufmann Publishers 2001 Rosling, H. (2012). Gapminder, For a Fact-based World View. Retrieved November 12, 2012, from http://www.gapminder.org/ Shoaff, W. (2000), “A short history of computer graphics,” http://cs.fit.edu/_wds/classes/graphics/History/history/history.html#SECTION00020000000000000000, 30 August 2000. Sutherland, I. (1963), “Sketchpad: A man-machine graphical communication system,” Ph.D. dissertation, Massachusetts Institute of Technology, 1963. Tableau Software. (2012). Tableau Public. Retrieved November 12, 2012, from http://www.tableausoftware.com/public Upstill, S. (1990), “The RenderMan Companion: A Programmer's Guide to Realistic Computer Graphics,” Addison-Wesley, 1990. ISBN 0-201-50868-0 Whitted, T. (1980), “An improved illumination model for shaded display,” Commun. ACM, vol. 23, no. 6, pp. 343–349, Jun. 1980. (http://doi.acm.org/10.1145/358876.358882) Yasushi, A. (2012). Box2D JS. Retrieved November 12, 2012, from http://box2d-js.sourceforge.net/ Zakai, A. (2012). Ammo.js. GitHub. Retrieved November 12, 2012, from https://github.com/kripken/ammo.js Zygote Media Group. (2012). Zygote Body. Zygote Media Group, Inc. Retrieved November 12, 2012, from http://www.zygotebody.com/