Journal of Physics: Conference Series
PAPER • OPEN ACCESS
Cloud Computing: A model Construct of Real-Time Monitoring for Big Dataset Analytics Using Apache Spark To cite this article: Ameen Alkasem et al 2018 J. Phys.: Conf. Ser. 933 012018
View the article online for updates and enhancements.
This content was downloaded from IP address 154.16.46.172 on 04/01/2018 at 00:38
10th International Conference on Computer and Electrical Engineering IOP Conf. Series: Journal of Physics: Conf. Series 1234567890 933 (2017) 012018
IOP Publishing doi:10.1088/1742-6596/933/1/012018
Cloud Computing: A model Construct of Real-Time Monitoring for Big Dataset Analytics Using Apache Spark Ameen Alkasem1, Hongwei Liu1, Decheng Zuo1 and Basheer Algarash1 1
School of Computer Science and Technology, Harbin Institute of Technology, Harbin 150001, China
Email:
[email protected] Abstract. The volume of data being collected, analyzed, and stored has exploded in recent years, in particular in relation to the activity on the cloud computing. While large-scale data processing, analysis, storage, and platform model such as cloud computing were previously and currently are increasingly. Today, the major challenge is it address how to monitor and control these massive amounts of data and perform analysis in real-time at scale. The traditional methods and model systems are unable to cope with these quantities of data in real-time. Here we present a new methodology for constructing a model for optimizing the performance of real-time monitoring of big datasets, which includes a machine learning algorithms and Apache Spark Streaming to accomplish fine-grained fault diagnosis and repair of big dataset. As a case study, we use the failure of Virtual Machines (VMs) to start-up. The methodology proposition ensures that the most sensible action is carried out during the procedure of fine-grained monitoring and generates the highest efficacy and cost-saving fault repair through three construction control steps: (I) data collection; (II) analysis engine and (III) decision engine. We found that running this novel methodology can save a considerate amount of time compared to the Hadoop model, without sacrificing the classification accuracy or optimization of performance. The accuracy of the proposed method (92.13%) is an improvement on traditional approaches.
1. Introduction Large datasets monitored move fast in real-time and tend to be the most valuable as a result [1]. For example, utility cloud service providers may wish to monitor engines to detect faults or anomalies in seconds or quickly engage self-recovery before losing service. To enable these low-latency processing applications, there is a need to design and evaluate a new model to rapidly manage and analyze huge data by means of streaming computation models that scale transparently to large clusters such as Apache Spark [2]. This happens with cheaper applications and low maintenance costs. Among the recent tools and technologies, Apache Spark has become one of the most popular engines for large dataset processing. Evaluating and designing a new model is challenging. Monitoring is an important aspect of systems engineering allowing effective maintenance and evaluation of deployed systems [3]. There is a common set of motivations for monitoring which apply to virtually all areas of computing, including cloud computing; perhaps foremost is capacity planning failure or underperformance
Content from this work may be used under the terms of the Creative Commons Attribution 3.0 licence. Any further distribution of this work must maintain attribution to the author(s) and the title of the work, journal citation and DOI. Published under licence by IOP Publishing Ltd 1
10th International Conference on Computer and Electrical Engineering IOP Conf. Series: Journal of Physics: Conf. Series 1234567890 933 (2017) 012018
IOP Publishing doi:10.1088/1742-6596/933/1/012018
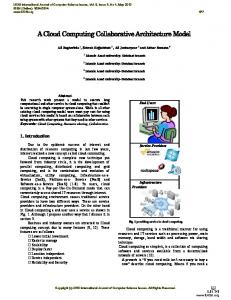
detection, redundancy detection, system evaluation and policy violation detection. At their very simplest, monitoring and control entail a three stage process illustrated in Figure 1: (I) The collection of relevant state (II) The analysis of the aggregated state and (III) Decision making as a result of the analysis [4]. Change to system configuration
System configuration
Decision engine Data sources
Raw state
Data collector
Uniform data
Analysis engine
Result
Visualizations and alerts
Monitored system
Figure 1. A three stages monitoring process technical More precisely, professionals use machine learning technologies such as Bayesian Networks (BNs) extensively for the classification and analysis of datasets due to their “learning” capabilities from the combination of datasets. These are often based on training and tests in order to make relatively highly accurate real-time decisions. Apache Spark is a fast general purpose computing engine designed for large-scale data processing. Spark has the advantages of Hadoop of MapReduce; Spark is different from MapReduce job intermediate results can be stored in the memory, thereby eliminating the need to read and write Hadoop Distributed File System (HDFS), so Spark can be better applied to the big dataset and machine learning iterative MapReduce algorithm. Recently, research in this area has abounded. Zhang, et al. [5] provided a flexible architecture called CloudMonatt to monitor the security health of customers’ VMs within a cloud system. Le et al. [6] developed an efficient multilevel healthy cloud system to analyze data collected from CGU smart clothes using Spark. Aceto et al. [7] surveyed cloud monitoring wherein they identified open issues, main challenges, and future directions in the field. Kumar et al. [8] developed a MapReduce framework for automatic pattern recognition based on fault diagnosis by solving data imbalance problems in cloud-based manufacturing (CBM). Melo et al. [9] developed and proposed a model to evaluate nodes’ capacity in a cloud computing environment based on available hardware resources. Nevertheless, comprehensive analysis yields the fact that these researchers, who work in different research areas, did not take into account other effects, such as efficiency, accuracy, and optimization of performance in real-time monitoring of large datasets analysis and classifiers as they pertain to diagnosing faults and anomalies’ behaviors. The contribution of this paper presents a new methodology which includes machine learning algorithms and the Apache Spark to accomplish fine-grained monitoring and control for the fault diagnosis and recovery of the IaaS clouds in real-time. This paper presents a new methodology for constructing a model that optimizes performance of real-time monitoring and improves prediction accuracy. Also, this research performs scalability monitoring to see the speedup of the big datasets processing and analyze this in real-time based on Spark Streaming. The case study here is the failure of virtual machines (VMs) to start up. The methodology proposition ensures that the most sensible action is carried out during the procedure of fine-grained monitoring and generates the highest efficacy and cost-saving fault diagnosis through three construction control steps: (I) Data collection; (II) Analysis engine; and finally (III) Decision engine, as shown in Figure 2. Results show that running the
2
10th International Conference on Computer and Electrical Engineering IOP Conf. Series: Journal of Physics: Conf. Series 1234567890 933 (2017) 012018
IOP Publishing doi:10.1088/1742-6596/933/1/012018
new model across machine learning algorithms and Apache Spark can save a consider able amount of time compared to running the model against a Hadoop without sacrificing the classification accuracy. It can also optimize analytical performance. Results have proven promising, considering an accuracy of 92.13% with an increase in the size of the datasets. This paper has five sections, beginning with this introduction. In section 2, we describe the tools we used in an empirical evaluation of our methodology. Section 3 focuses on our approach’s materials and methods, and explains the analysis, classifier and decision engine models. Section 4 explicates the experimental results, environment and includes a discussion. Finally, we provide our conclusions and future works in Section 5.
Figure 2. Overview of a new model monitoring workflow based on Apache Spark 2. Tools Used in Empirical Evaluation of Methodology 2.1 Apache Spark Technology Spark is a distributed computing framework like MapReduce, but it score is a flexible distributed data set that provides a richer model than MapReduce. Specifically, it allows iterations of data sets in memory quickly to support complex data mining algorithms and graph calculation algorithms [3]. It provides a simple programming interface (API’s) for various analytics algorithms including real-time data streaming, SQL Queries, graph processing and machine learning. The interface allows for an application developer to easily use the CPU, memory, and storage resources across a cluster of servers for processing large and complex datasets. The advantages of Spark Streaming are:(I) runs on 100+ nodes, and reaches the second delay, (II) memory-based execution engine, with efficient and fault-tolerant features, (III) integration of Spark's batch and interactive queries, and (IV) Up to 10 times faster than Hadoop MapReduce. Apache Spark is a very simple architecture with only two nodes (Master and Worker) that run with a cluster manager such as Spark, Hadoop or others, as shown in Figure 3
Figure 3. Apache Spark architecture
3
10th International Conference on Computer and Electrical Engineering IOP Conf. Series: Journal of Physics: Conf. Series 1234567890 933 (2017) 012018
IOP Publishing doi:10.1088/1742-6596/933/1/012018
The Spark program processes the batch by manipulating the interfaces that RDDs (Resilient Distributed Datasets) provide, such as map, reduce, filter and so on. In Spark Streaming, the interfaces provided by the operation of the DStream (RDD sequence representing the data flow) are similar to those the RDD provides. 2.2 Spark Streaming Framework Spark Streaming is a real-time native computing framework that extends Spark's ability to handle large-scale streaming data. The framework demands data collection from many resources such as TCP sockets, HDFS and Kafka, as well as processing it through complex algorithms expressed with high-level functions such as MapReduce and window [13]. The basic principle of Spark Streaming is to split the input data stream into units of time slices (seconds), and then process each time slice data in a batch-like manner. Figure 4 illustrates the basic principle.
Figure 4. Spark Streaming implementation framework We used Spark Streaming in this work because it allows us to combine applications such as streaming, batch and interactive queries through rich APIs and memory-based high-speed computing engines. Indeed, it is suitable for applications that require historical data and real-time data combination analysis, though real-time requirements do not require particularly intensive application. In addition, the RDD data reuse mechanism can be more efficient and more fault-tolerant processing [13]. 2.3 Structured Streaming Structured stream processing is another engine based on the Spark SQL optimization engine Catalyst optimizer, ensuring its performance is also strong. This kind of processing ensures data is processed only once, while achieving end-to-end data and high fault tolerance by investigating mechanisms like checkpoints and write ahead logs. The current dataset/DataFrame API supports program languages in Scala, Java, and Python. We can implement flow aggregation, event window, join aggregation, and so on [13]. 2.4 Machine Learning with Apache Spark Machine learning is a technology with strong ties to statistics and optimization; these allow learning from existing data to explore hidden valuable information [14]. It has become one of the most popular techniques for knowledge discovery and predictive analytics, especially with the current exponentially growing data derived from various disciplines such as the medical sciences and business. Many
4
10th International Conference on Computer and Electrical Engineering IOP Conf. Series: Journal of Physics: Conf. Series 1234567890 933 (2017) 012018
IOP Publishing doi:10.1088/1742-6596/933/1/012018
applications, like spam filtering, advertisement targeting, computer vision, and bioinformatics, have adopted machine learning algorithms to better guide leadership’s decisions. Apache Spark programming model and the Hadoop platform to analytic and process big datasets in real-time gives a powerful algorithms implementation. Many machine learning algorithms have been investigated to be transformed to the Spark paradigm in order to make use of the HDFS/Kafka resources [15]. The Naï ve Bayes classifier (NBC) is one of the supervised learning classification algorithms one can program along the lines of Spark. Currently, the NBC is a scalable machine learning library that supports large dataset processing [16]. Moreover, one can train the NBC very efficiently. Within a single training pass, it computes the conditional probability distribution of each feature given label and then applies Bayes’ Equation (1) to compute the conditional probability distribution of a label, given an observation, then employs it for prediction [17].
(1) where : is the posterior probability of the class (target) given predictor (attribute). : is the class prior probability. : is the likelihood probability. : is the predictor prior probability (evidence). 3. Our Approach A new methodology model used the advantages NBC models and Apache Spark Streaming technical. This provided a new approach and framework of monitoring and control of a massive amount of datasets and an analysis in real-time at scale. The new model reduces the cost of the time of a fault diagnosis through fast analytic and engages in classifying large testing and training datasets based on the Spark Streaming technical and HDFS or Kafka storage platforms. The new model monitors a wide range of metrics across the VMs as shown in Figure 5. Most prior work monitored metrics based on the risk levels of consequences according to the symptoms [18].
Figure 5. A new methodology proposed framework based on Spark 3.1. The Topology of a New Methodology Proposed 3.1.1. Data Collections for Proposed Model
5
10th International Conference on Computer and Electrical Engineering IOP Conf. Series: Journal of Physics: Conf. Series 1234567890 933 (2017) 012018
IOP Publishing doi:10.1088/1742-6596/933/1/012018
In this paper, we collected data from large monitoring engines to obtain the metrics of interest (numerical predictors or attributes). Then, we collected the metrics of the VMs by running the VMs on the Xen-hypervisor [19] installed on the host server in combination with pre-processing (reported in Table 1) using Ganglia metrics software [20], as shown in Table 2. Because these metrics exist in the form of numerical data, the numerical variables had to be transformed into their categorical counterparts (binning) before constructing their frequency table to use them as input for the proposed model topology structure. Therefore, as shown in Figure 6, the pre-processing step consists of four steps to translate continuous percentage utilization into interval probability values and generate monitoring vectors of events (M-events) by using our method [21]. We adopted this method with a filtering dataset to remove and process the outlier data and noise using the Extended Kalman Filter (EKF) [22]. As a result, we generated a new method algorithm for transformed a numerical data to binning data (Figure 7). Table 1. Fault reasons for the start-up failure of VM/Host metrics Fault category
CPU utilization
Memory usage Network overhead I/O storage usage
Measurement Level
Fault causes % CPU time used by host CPU during normal sampling period (Host CPU usage) % CPU time during which the CPU of the VM was actively using the physical CPU (VM CPU usage) % CPU time during which the CPU of the VM was ready but could not get scheduled to run on the physical CPU (VM CPU Ready-Time) % of used memory (Memory usage)
VM, Host
VM, Host
% of network usage (Bandwidth)
VM, Host
% of disk usage (Throughput)
Host
Table 2. A sample data collection of CPU-utilization (testing dataset) Time- Monitoring 12:02:00 AM 12:07:00 AM 12:12:00 AM 12:17:00 AM
VM-CPU-Ready-Time 30.00 30.00 90.00 31.84
Host-CPU-usage 30.00 35.00 70.00 38.21
VM-CPU-usage 30.93 78.12 92.43 42.19
Figure 6. A process method steps and a sample of tables of the datasets transformed
6
10th International Conference on Computer and Electrical Engineering IOP Conf. Series: Journal of Physics: Conf. Series 1234567890 933 (2017) 012018
IOP Publishing doi:10.1088/1742-6596/933/1/012018
Algorithm 1: Transformed and filtered a data points to data binning Input: Metrics_values[i, j], mean[j], m, r, n, num. Output: Data binning table. 1. For i=0 , i