deferring capital investment will ease out the initial cash flow pressures and ... business paradigm â offers 'deferred CAPEX' driven investment downsizing as its ...
Cash Flow Modelling and Risk Mapping in Public Cloud Computing An Evolutionary Approach ��������� � ��� �������������������(
Introduction Cloud Computing is an on-demand, self-service, location-independent, elastic, measured-meteredpaid, zero asset-ownership, zero capital expenditure, energy efficient, flexible substitute to the traditional platform of own-and-use computer systems. In analogy terms, cloud is to computing industry what vehicle leasing is to auto industry. It brings in all the advantages of utilization without the associated risks of ownership. With state-of-the-art innovations, cloud computing has today made possible the migration of applications, software, storage and even platform management to the ethereal cloud. Though cloud computing can be viewed as both a technology offering and a business alternative, its adoption today is driven more by economic rationale than by technology justifications. In delivery terms, cloud offering is a merger of state-of-the-art concepts like virtualization, server consolidation, interoperability and dynamic CPU provisioning. Yet, its risk-benefit analysis is purely driven by economic and business imperatives. Firms – whether they are constrained for capital or not – would, given a chance, prefer to use up their precious high-cost capital to build assets that drive their revenue growth. In such a capital constrained scenario, any option of deferring capital investment will ease out the initial cash flow pressures and help in better Net Present Value (NPV) modelling. Modern business paradigms like leasing, asset co-ownership and infrastructure outsourcing are all aimed at easing out the upfront capital investment problem. Cloud – as a business paradigm – offers ‘deferred CAPEX’ driven investment downsizing as its
* @
Director Admissions & Associate Professor (Marketing), Great Lakes Institute of Management, Chennai, India Director PGDM & Professor (Marketing), Great Lakes Institute of Management, Chennai, India
84 � Cash Flow Modelling and Risk Mapping in Public Cloud Computing
most tangible gain. The ratio of IT investment to the overall CAPEX investment is the first modelling parameter of this paper for doing a variability study. In addition to downsizing CAPEX investment, cloud adoption also offers the possibility of lowering the total IT operating expenses. This reduction of operating expenses with higher cloud adoption has a beneficial impact in the calculation of the present value of future cash flows. The total operating expenses in the cloud environment has been split into non-cloud related operating expenses and cloud related operating expenses. The non-cloud related operating expenses – as will be discussed later – has to be strategically reduced to fully enjoy the benefits of moving into the cloud. The reduction of the non-cloud related IT operating expenses is posited as the second modelling component in the NPV modelling. The cloud related operating expenses introduces the dimension of unknown risk components associated with cloud adoption. The unknown risks associated with cloud are broadly mapped along 4 vectors (ibid Easwar et al, 19). They are vendor related risk, data security related risk, no-gain risk and system efficiency risk. Fear of lock-in with an incompatible vendor, lack of guarantee of business continuity and service availability, reputation fate sharing with a vendor and unclear licensing issues are some of the components that drive the fear called vendorrelated risk. Similarly confidentiality issues, privacy issues, loss of governance and the likes sum up to data security risk. The gains that cloud platforms purport to offer in terms of reduced capital and operative costs might not be sufficient enough to move from existing systems to cloud platforms is the premise for the no-gain risk. Finally effects of latency, downtime, data bottlenecks and any other efficiency impediments add up to create the last risk vector – efficiency risk. The monetization of these unknown risks will critically regulate the NPV modelling. This nebulous unknown risk is the third modelling component of this paper’s variability study.
Literature Survey Academics have reviewed the emerging area of Cloud Computing along various vectors. This section reviews some of the work that has been already done in terms of definitions of cloud, economics of cloud adoption and risk factors associated with cloud computing. M. Ambrust et al refer to Cloud Computing as a symbiosis of both applications delivered as services over internet and hardware/systems software in the data centres that provide those services1. A paper which has received wide citation, this Berkeley work delineates the roles of the pure cloud provider and the intermediary SaaS model packager. Brian Gammage et al talk about the strategic possibility of the ‘power of IT’ shifting towards external providers and users. The paper, which is essentially a Gartner report, tries to clearly define core vs. non-core strategies in the context of IT asset ownership and utilization2. Talking about the economics of Cloud Computing, Hosseini et al predict that the decision to migrate existing systems to cloud platforms can be complicated since the evaluation of the cost-benefit trade off and the measurement of associated risk in cloud computing adoption is not straight forward3. Another paper by Beaty et al talks about building a viable business case on cloud migration by modelling on cost of transformation, ROI and payback period4. J.C.Pucciarelli et al. write about Cloud being too important to be left to IT Departments alone because it’s as much about business’ agility as it’s about IT cost takeout5. M.
International Journal of Consumer & Business Analytics � 85
Klems et al aver that the valuation of Cloud Computing services must take into account its costs as well as the costs resulting from the underlying business model6. Federico Etro mentions about Cloud Computing as a large pool of easily usable and accessible virtualized resources (hardware, development, storage and/or services) which can be dynamically reconfigured to adjust to a variable load scenario7. This dynamic reconfiguration facilitates the optimal utilization of resources. Moving to area of risks and obstacles involved in Cloud Computing, C. Christauskas et al have talked about fear for safety, internet failure, control loss, dependency and similar exogenous factors that inhibit cloud adoption8. The two extreme options of pure in-house deployment and pure cloud based deployment and the various in-between hybrid options that can offer the best of both worlds have been studied by B.C. Tak et al in the context of certain specific applications9. Chinyao Low et al investigate the factors that affect cloud adoption by firms belonging to the high-tech industry10. Malden AVouk maps the journey of cloud from technology to implementation11. Tara S Behrend et al examines cloud computing initiatives in the education sector12. The paper is in the US context and examines the factors that lead to adoption of this technology from the perspective of both colleges and student community. Vladimir Vujin looks at the education industry and cloud computing, but more from a research support point of view13. The paper talks about a reliable and scalable cloud environment that can foster scientific research and educational progress. Alec Nacamuli in what is essentially an editorial piece stresses on the importance of cloud in banking in the days to come14. The paper cites that regulation, data recovery, customer trust and innovation would be some of the key thrust areas which come in the cusp of cloud computing and banking. Jeanne Capachin in another well researched article on banking focusses primarily on security issues that would be on top of mind for bankers, when they think of 3rd party data storage15. Chris Chatman focusses on another sector which is clearly heading towards cloud adoption – health care sector16. The paper dwells on the dual concerns of data security as well as speed of implementation for the healthcare sector. Edward J Giniat offers more insights in the area of cloud vs. healthcare17. The literature survey section concludes by quoting the previous work done by some of the authors of this work. Easwar et al (in a work to be published in January 2013) looks at the drivers and inhibitors of cloud adoption with a specific SME sector perspective18. The data in this work is Indian SME data. As an extension of this work Easwar et al (another work to be published in May 2013) have compared the relative risk perceptions of cloud adoption across 4 different sectors – SME, BFS, Hospitals and Education19. This paper is finally an evolution of the mathematical model which Easwaret all (published work November 2012) offer for Net Present Value (NPV) analysis in the context of cloud adoption20. The previous study aims at developing a mathematical model that does a revenue–neutral cash flow modelling for fractional cloud computing adoption. The aim is to find a mathematical fraction, other things being equal, for which the Net Present Value (NPV) maximizes with respect to cloud adoption. The current work elaborates on the sub-factors that drive NPV upwards by doing a multi-parameter variability analysis.
86 � Cash Flow Modelling and Risk Mapping in Public Cloud Computing
Problem Formulation and Modelling The dependent variable modelled in this paper is the Net Present Value [NPV] of a firm that is into the adoption of cloud practices. The independent variable is the fractional cloud adoption coefficient a. As mentioned earlier a is a fraction that varies from 0 to 1. a = 0 indicates one extreme of the cloud deployment spectrum – zero acceptance of cloud as a solution. At the other extreme is a = 1 which indicates a deployment of all possible and available cloud options. The movement of a (from 0 to 1) is a reflection of the consumer’s market’s acceptance of a new technology platform. NPV modelling is done as a function of this fraction a. Another fraction that the paper’s modelling takes into account is δ. This fraction is an indicator of the amount of products and solutions options that can actually be moved to the cloud today from the total universe of IT assets. The two fractions are different in the sense that δ indicates a technology limitation and α indicates a behavioural limitation in the context of cloud adoption. Table 1 gives the complete set of equations for the NPV Modelling. Equation (1) is the definition of NPV as the difference between the present values of all future cash flows of the firm and the current up front capital investment. It is a judgmental indicator on the prudence of going ahead with the current investment. Equation (2) indicates that the offset in the current investment is driven by the term aδIit, which is the maximum possible deferrable investment of IT capital
TABLE 1: EQ UA TIONS FOR NPV MODELLING EQUA UATIONS
International Journal of Consumer & Business Analytics � 87
expenses due to cloud adoption. In this equation – as explained earlier – δ gives the technology limit of cloud migration and a gives the behavioural limit of cloud adoption. Equation (3) models the Present Value based on the assumption of an annualized perpetual cash flow for the firm and separately brings out the two components of IT operating costs – the traditional in-house operating costs Onc which will continue even after cloud adoption and the cloud related IT operating cost Oc. For simplifying the model, the authors have ignored the revenue growth of the firm (annual growth rate of R). Else the denominator of equation (3) would have been (r-g) instead of ‘r’, where g is the annual growth rate. This simplification however does not affect the analysis and interpretation of our results as offered in the next section. Equation (4) is a behavioural equation of Onc with the assumption that traditional in-house operating cost would steadily fall with higher cloud adoption because cost elements like maintenance, training, IT staff salary, utilities, supervisory staff salary, hiring, band width and a host of other associated costs would reduce systematically for higher cloud adoption (i.e. as a value moves from 0 to 1). Irrespective of the value of ‘a’ high value of ‘b’ (i.e. a small ‘a–b’ value) will indicate a successful strategic reduction of Onc. Equation (5) explains the behaviour of the cloud related IT operating cost Oc. It again has two components – both driven by a – one of which is monetized (Yk) and the other is currently noncash, but monetizable (Yuk). Yuk represents the hidden cost element associated with cloud adoption and could include factors as diverse as data security cost, data privacy cost, load variability cost, internet down time cost, loss of control cost, redundancy cost, contract breach costs etc – of which some are exogenous and some are endogenous. Equation (6) is the final equation for NPV. The second order differential of this equation is negative and hence this equation is a maximizing equation. The first order differential equation is given in equation (7). Equating it to zero will give the value of α for which the NPV function maximizes. The same is given in equation (8).
Research Analysis and Interpretation The key final equation on NPV, on which all the three variability studies have been done, is reproduced here with the terms explained once more.
NPV : Difference between the present values of all future cash flows and current upfront investment α
: Fractional cloud adoption coefficient
δ
: Fractional indicator of IT products / services that can actually move to cloud today
r
: Discounting rate computed using Weighted Average Cost of Capital [WACC]
88 � Cash Flow Modelling and Risk Mapping in Public Cloud Computing
a
: Maximum value of in-house, non-cloud IT operating costs in the absence of cloud adoption
b
: Fall on IT operating cost with full cloud adoption [i.e. a (α=0) gets reduced to a-b (α=1)]
Itotal
: Maximum upfront total capital investment [IT and non-IT included]
Iit
: Maximum upfront IT capital investment in the absence of cloud [i.e. at α=0]
R
: Annualized perpetual cash flow for the firm for which cloud adoption is considered
Yk
: Annualized payout to the vendor for cloud utilization (at α=1)
Yuk
: Non cash, yet monetizable unknown risk component associated with cloud adoption (at α=1)
As mentioned in the introduction, the variability of the Net Present Value (NPV) is mapped and studied across three parameters, Yuk, b and Iit. The Assigned Value table for doing this study is given in Table 2. NPV (plotted in the y axis) is the dependent variable and α (plotted in the x axis) is the independent variable. The fraction δ has been arrived at by the statistical analysis of data collected from a vendor sample space. The value of δ obtained was 0.595 which has been approximated to 0.6 for plotting. The value of r (the WACC function) has been set at 10%, a value which is in approximately sync with the Indian market’s cost of capital. TABLE 2: ASSIGNED V ALUE T ABLE ON WHICH THE V ARIABILITY STUD Y IS DONE VALUE TABLE VARIABILITY STUDY
The firm under consideration for NPV analysis is posited to have an annual revenue of 1000 Crore INR [One crore is 10 million]. The nature of the firm and its growth in revenue does not
International Journal of Consumer & Business Analytics � 89
change/affect the modelling. The firm is assigned to have a total CAPEX outlay of 200 crores INR. The IT CAPEX, which is a part of the overall CAPEX is one of the study variables. The annual cash out for cloud usage plus costs that are directly allocable to cloud is 5 crore INR. The total non-cloud IT operating cost is assigned as 12 crore INR. The fall in operating expenses ‘b’ is another study variable. Finally, the nebulous unknown risk component associated with cloud adoption Yuk is the last study variable.
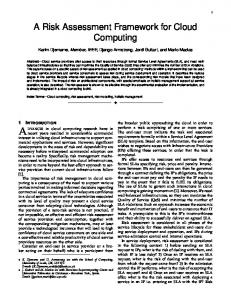
Variability of NPV with ‘Yuk’ Equation 8 of Table 1 gives the value of α for which the NPV function maximizes. In the equation, the factor rδI it is the opportunity saving from not investing in upfront capital. Iit is the total IT expense and δIitis the maximum fraction of IT expense which can be deferred from immediate investment. If that is treated as a notional saving, then rδIit is the notional positive cash flow where r is discounting rate driven by weighted average cost of capital (WACC). In the real scenario, this savings is larger than the cash payout term Yk. This is because the cloud utilization charges Yk will continue to be small because the cloud vendors have scale, higher capacity utilization, higher risk spread across multiple users, better fixed cost spread and better negotiation for bulk buying of IT assets. Also, cloud is in its nascent phase as far as Product Development Life Cycle (PDLC) goes and vendor firms will go soft on pricing to ensure higher adoption. Hence the term (rδIit - Yk) is positive. The actual value of α for which the function maximizes is now critically hinged on the unknown risk component associated with cloud adoption Yuk. The plot of NPV maximization for different levels of Yuk is given in Figure 1. Each of the 4 curves is explained below:
FIGURE 1: VARIABILITY OF NPV WITH YUK
90 � Cash Flow Modelling and Risk Mapping in Public Cloud Computing
If Yuk is set to zero (or has a small inconsequential value) then mathematically, the value of α for which the NPV function maximizes is ‘greater’ than 1. This possibility is plotted as the top curve (Yuk = Small). What it implies is that there will be no hiccups in a monotonic NPV increase when α moves from 0 to 1, if the costs associated with unknown fears are fully contained. This is an idealistic situation. A more realistic situation is plotted for Yuk = Medium. Here, Yuk and Yk have been ‘assigned’ the same value of 5 crore INR. In this case the NPV peaking occurs for a α value of 0.8. For curve #3 (Yuk = Large), a value of 10 crore INR has been assigned to Yuk. Now the NPV curve peaks at an even smaller α value of 0.5. What these two curves indicate is that when significant risks come into play – yielding significant values for Yuk - NPV starts falling after a certain level of cloud adoption. Higher the risk value, earlier the fall. The last curve (Yuk = Very Large) has a hypothetical value of 25 crore INR assigned to Yuk. In such a scenario, there is no NPV increase at all. There is a monotonic fall of NPV for any level of cloud acceptance. Let us revisit Figure 1 now from a totally non-mathematical point of view. In order to model the cost associated with unknown fears (Yuk), we need to closely examine the Industry vs. Fear Matrix (for cloud adoption). For different industries / businesses, the fears of cloud adoption would be very different. As previously explained, from data security to privacy to intolerance of down time to latency problems, every fear is associated with a cost element. For those industries that are significantly resisting cloud adoption, the cost association of one or more of these risk elements would be significant. This will yield a high Yuk value and thereby the NPV maximization value of α can slip below 1. Hence, if only fractional adoption of cloud is happening in some sectors, then beyond the current levels of adoption, the industry perceives a high amount of risk. Though it is beyond the scope of this paper to describe all possible cloud adoption risks – real, latent or perceived – a brief of three random risk factors are summarized below. This will give a feel of the valuation of Yuk.
Risk of Lock-in with an incompatible Vendor - Vendor lock-in is a situation in which a customer using a product or service cannot easily transition to a competitor’s product or service. The complexities of cloud service migration mean that many customers stay with a provider who doesn’t meet their needs, just to avoid the cumbersome process of changing vendor. Risk of loss of Data Confidentiality - Data confidentiality is a property of data resulting from legislative measures, which prevents unauthorized disclosure. It is a parameter which indicates whether the information stored on a system is protected against unintended or unauthorized access. In a public cloud, the fear of data loss / theft will be on the higher side for data sensitive sectors like banking sector. Response time/Latency effects - In a cloud scenario, response time is the sum of network and transaction response time. On the server side, server latency (the time it takes for processing and I/O), application latency (the time it takes the application to respond) and database latency (assuming one is part of the design) are all key contributors to server response time. For sectors where data changes dynamically and snap shot decisions are required, any response slackness due to latency will critically affect operations. Summing up, for ensuring higher cloud adoption, the onus is on the cloud vendor to assuage the fears related to Yuk on a sector by sector basis to all cloud adopters.
International Journal of Consumer & Business Analytics � 91
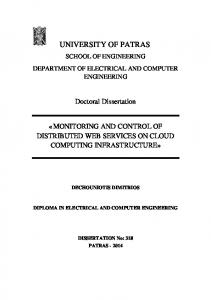
Variability of NPV with ‘Iit’ The total CAPEX deployed in any firm is a sum of IT CAPEX and non-IT CAPEX. Non-IT CAPEX goes into land, building, plant and machinery and has no bearing on cloud computing driven calculations. Thus, for gaining tangible increase in NPV by way of deferred CAPEX driven investment downsizing, a significant percentage of the total CAPEX has to move to IT. Figure 2 gives a variability analysis of NPV for different levels of Iit / Itotal. Plotted are 4 curves at 4 levels of Iit/Itotal– 0.25, 0.5, 0.75 and 0.95. When the IT CAPEX is only a quartile of the total CAPEX, then the fraction of that quartile that can be clouded is also very small. Thus the possible gain in NPV is very small. For this variability study, Yuk has been taken as ‘large’ to get the inverted parabola shaped curve. For every increase in IT CAPEX, there is a jump up in the NPV curve. This is fairly intuitive in the sense that a significant gain in Net Present Value can be obtained only for those firms whose IT investment is a large fraction of the total CAPEX investment of the firm. Even from a mathematical point of view, a curve of Iit / Itotal = 1.0 is not plotted since there can be no firm having a 100% IT only investment. There is an important note to be added here. Firms / industries who’s IT CAPEX would only be a small fraction of their total CAPEX would still stand to gain all the advantages that the cloud platform offers. Figure 2 is not a contradiction to that. Gains like server consolidation, last mile customization, ease of deployment, up/down scalability and the likes are open to all user classes irrespective of their Iit / Itotal values. What Figure 2 indicates is that for getting a tangible NPV gain in the process of cloud adoption, the IT CAPEX has to be significant fraction of the total CAPEX.
FIGURE 2: VARIABILITY OF NPV WITH IIT
92 � Cash Flow Modelling and Risk Mapping in Public Cloud Computing
Variability of NPV with ‘b’ For all the gains of an NPV increase because of deferred CAPEX, unless conscious efforts are taken in systematically reducing the non-cloud operating expenses (Onc), the true gains of cloud computing cannot be realized. The fall in Onc has to be driven by a strategic initiative. It only implies that when higher cloud adoption happens, there has to be a conscious effort to trim down the traditional in-house operating costs. The step function indicated in Figure 3 is actually the posited outcome of such a strategic initiative to phase out the value of Onc in a step-wise manner. In the absence of such a strategic initiative, the NPV maximization through cloud adoption cannot be completely achieved. The equation ‘bα2 – 2bα + a’ and the plot of the same is an approximation of the step-wise cost fall behaviour. ‘a’ is the no-cloud operating cost and ‘a-b’ is the full-cloud operating cost. Thus ‘b’ is the fall in operating cost.
FIGURE 3: PLO T OF FFALL ALL OF NON-CLOUD OPERA TING COSTS PLOT OPERATING
Figure 4 plots the variability of NPV for different values of ‘b’. For all the three curves, Yuk has been taken as ‘Large’ and Iit / Itotal= 0.5. This is to ensure that the reverse parabola curve is maintained. The top curve is for a hypothetical 100% operating cost reduction. In this case a≈b and hence the operating cost at full cloud adoption is a-b≈0. Thus maximum NPV boosting is obtained. The second curve is for a more realistic and achievable reduction of 83.33%. ‘a’ is assigned the value of 12 crore INR and ‘b’ is assigned the value of 10 crore INR. Unless such realistic reductions are aimed at, the gains in NPV would not be there. The bottom curve gives a conservative and lethargic approach in reducing Onc. Here, ‘b’ is assigned a value of 5 crore INR. So the fall in Onc is only from 12 crore to 7 crore. Since the operating costs do not fall in step with higher cloud adoption, NPV refuses to go up for any levels of adoption. This brings us back to the fact that Onc reduction is not something that naturally happens. It has to be strategically made to happen. Some of the elements of Onc which can be brought down consciously and aggressively are maintenance costs, training costs, IT staff salary costs, utilities cost, supervisory staff salary costs, hiring costs, band width costs and a host of other associated costs. The authors recommend that these cost cutting decisions should not be left to the IT department since they are more users than policy makers. There are systematic ‘people and process’ transformations required to cut costs and gain the full benefits of cloud computing.
International Journal of Consumer & Business Analytics � 93
FIGURE 4: VARIABILITY OF NPV WITH B
Future Directions of Research Two clear future directions of research are possible to take this mathematical modelling to the next level of completeness. The measurement and quantification of Yuk has been abstract and mathematical in this paper. On a sector by sector basis, one can segment and then do a weightage assignment for the possible risk factors that critically affect cloud adoption. Then, each of these weighted risks can be assigned a probability of the risk occurrence. This duality of relative weightage and probability will help in quantifying the effect of the individual risk. An aggregation of such risks elements – as applicable to a given sector – will yield a realistic value for Yuk. The authors of this work are pursuing the segmentation, weightage assessment and probability assignment of cloud adoption risk for the BFS sector – a sector which has got clear risk perceptions (ibid Easwar et al, 19). Similarly, the non-cloud operating cost reduction drivers can be modelled to find an equation that closely approximates the step function shown in Figure 3. Very preliminary work is on in that direction also.
94 � Cash Flow Modelling and Risk Mapping in Public Cloud Computing
References A. Khajeh-Hosseini, D. Greenwood, J.W. Smith and I. Sommerville, “The Cloud Adoption Toolkit: Supporting Cloud Adoption Decisions in the Enterprise,” In Press, Software: Practice and Experience, 2011. M. Armbrust, A. Fox, R. Griffith, A.D. Joseph, R. Katz, A. Konwinski, G. Lee, D. Patterson, A. Rabkin, I. Stoica, and M. Zaharia, “A view of Cloud Computing,” Communications of the ACM, vol. 53, 2010. Alec Nacamuli,”An Editorial on Cloud Adoption in BFS”, Journal of Payments Strategy & Systems, Vol. 4, No. 4, 2010 B.C. Tak, B. Urgaonkar, A. Sivasubramaniam, “To move or not to move: The Economics of Cloud Computing,” Third USENIX Workshop on hot topics in Cloud Computing (HOTCLOUD 2011), Portland, Oregon. Beaty, Naik, Perng, “Economics of Cloud Computing for enterprise IT,” IBM Journal of Research & Development, Nov. 2011. Brian Gammage et al, “Gartner’s Top Predictors for IT Organizations and Users, 2010 and Beyond: A New Balance”, A Gartner Research Report, ID no. G00173482, December 2009 C. Christauskas, R. Miseviciene, “Cloud Computing Based Accounting for Small to Medium Businesses,” lnzinerineEkonomika-Engineering Economics, 2012, 23(1), 14-21. Chinyao Low, Yahsueh Chen, “Understanding the determinants of cloud computing adoption”, Industrial Management and Data Systems, Vol. 111, Issue 7, 2011 Chris Chatman, “How Cloud Computing is changing the face of Health Care Information Technology”, Journal of Healthcare Compliance, May-June 2010 Easwar Krishna Iyer et al, “Decision variables influencing Cloud adoption by SME sector: A Conjoint Analysis Mapping”, Accepted for publication in National Conference on Business Analytics and Business Intelligence, January 2013 Easwar Krishna Iyer et al, “Analysis of Dissatisfiers that Inhibit Cloud Computing Adoption across Multiple Customer Segments”, Accepted for publication in The International Conference on Information Management and Evaluation (ICIME) Vietnam, May 2013 Easwar Krishna Iyer et al (2012), “Cloud Computing and Modelling of Cash Flows for Full vs. Fractional Adoption of Cloud”, Proceedings of the International Conference on Business Management and Information Systems (ICBMIS) Singapore, November 2012 Edward J Giniat, “Cloud Computing: Innovating the Business of Health Care”, Healthcare Financial Management, May 2011 Federico Etro, “The Economics of Cloud Computing”, Annual Conference on European Antitrust Law, 2011. J. C. Pucciarelli, “IT Cloud Decision Economics: Customer Needs and Strategies,” IDC vol. 1, July 2011. Jeanne Capachin, “Change on the horizon: The impact of Cloud Computing on Treasury and Transaction Banking”, Journal of Payments Strategy & Systems, Vol. 4, No. 4, 2010 M. Klems, J. Nimis, S. Tai, “Do Clouds Compute? A Framework for estimating the value of Cloud Computing,” FZI ForschungszentrumInformatik Karlsruhe, Germany. Mladen A. Vouk, “Cloud Computing – Issues, Research and Implementations”, Journal of Computing and Information Technology, CIT 16, Vol 4, 2008 Tara S Behrend et al, “Cloud Computing adoption and usage in community colleges”, Behavior and Information Technology, Vol. 30, No. 2, March – April 2011 Vladimir Vujin, “Cloud Computing in Science and Higher Education”, Management, Issue No. 59, 2011