utilized a new 21-sensor network (LINET, lightning detection network) to obtain ... In accordance with general expectations, high IC event rates have been found ...
Journal of Lightning Research, Volume 2, 2007, pages 1-17 © JOLR 2007 (www.jolr.org)
Cloud Lightning: Detection and Utilization for Total Lightning Measured in the VLF/LF Regime H.-D. BetzA, K. SchmidtA, B. FuchsA, W. P. OettingerA, and H. HöllerB A. Physics Department, University of Munich, Germany. B. Institut für Physik der Atmosphäre, DLR-Oberpfaffenhofen, Germany.
Abstract Lightning detection networks operating in the VLF/LF-regime have been traditionally designed to report cloudto-ground (CG) strokes with currents above ~5 kA while they suppress recording of all types of cloud discharges (IC) by special methods. Efficient detection and reporting of IC emission has been achieved mainly with VHF arrays. The Munich group studies VLF/LF radiation with methods equally sensitive to CG and IC signals and utilized a new 21-sensor network (LINET, lightning detection network) to obtain total lightning data by means of a single technique. Three important network features are i) the measurement of estimated currents as low as ~1 kA, a range which has attracted little experimental attention in the past, ii) discrimination of IC events from CG strokes by means of a special 3D-feature in the location algorithm, and (iii) the reporting of IC emission heights. In accordance with general expectations, high IC event rates have been found at low amplitudes. Typical IC’s exhibit multi-polar pulse-trains which defy assignment of a clear-cut sign for the amplitude; however, there is also a large portion of IC events which are sufficiently mono-polar to allow classification as having positive or negative polarity. In most storm cells an excess of positive polarity IC (IC+) events is found; together with negative polarity IC (IC-) events promising information is obtained about discharge types, identification of storm cells and of the onset of super-cell storms and severe weather conditions. Index Terms Lightning Detection, Total Lightning, Cloud Discharges, VLF/LF-Network, Severe Weather. 1
INTRODUCTION
In many countries lightning detection is routinely performed by means of VLF/LF-networks. One prominent feature of these systems is that they cover large areas in a continuous mode so that quite a complete picture about the entire lightning activity is obtained in real time. Prominent examples are the NLDN (National Lightning Detection Network) in the United States [10, 11, 33, 59] and the technically almost identical EUCLID (European Cooperation for Lightning Detection) network in Europe. For historical reasons the network output was focused on the reporting of cloud-toground strokes (CG), while all types of cloud events (IC) are either not listed or only partially reported. For example, during some 15 years of operation the NLDN provided only CG strokes; in late 2005 it announced to begin delivery of limited cloud lightning information in Submitted: 25/01/2006
2006 [12, 31]. Since IC discharges often radiate in the VLF/LF range all customary antennae are as sensitive to these IC signals as to CG strokes. For this reason, and because one finds a large range where respective signal amplitudes overlap, identification of IC events requires application of specific discrimination procedures. The usually employed method utilizes differences in the shapes of the recorded time-dependent waveforms. As a result, lightning maps and distributions of normalized current amplitudes have been provided and published widely for CG strokes, but correspondingly comprehensive statistical information on IC events in the VLF/LF range was extremely sparse. Furthermore, operational networks report only the stronger strokes above 5 kA or even higher currents, so that median current values lie sometimes around, but mostly well above 10 kA. Due to the lack of sensitivity in the low-current range where the majority of IC activity occurs, a highly interesting Accepted: 25/10/2006
Betz et al: Cloud Lightning: Detection and Utilization for total lightning measured in the VLF/LF regime Volume 2, 2007, pages 1-17 © JOLR 2007 (www.jolr.org)
and easily accessible class of IC events has not been located and analyzed comprehensively by VLF/LF networks. In the radio frequency range advanced techniques have been developed for the detection of IC sources, with remarkable applications for both research and operational purposes. After the pioneering work of Proctor [37] continued progress was achieved. For example, the ONERA team presented the interferometric system named SAFIR [40-42], and the New Mexico group developed LMA, a time-of-arrival Lightning Mapping Array [47, 54]. Likewise, the VHF system LDAR (Lightning Detection and Ranging, operated at the Kennedy Space center, Florida) provides extensive data on cloud lightning. These systems succeed to map flashes in surprisingly fine details; especially when based on high-precision time-of-arrival (TOA) techniques with an inherent timing accuracy of 50 ns, IC radio sources became detectable with a spatial resolution which may reach down to 50 m. Due to a tremendous number of located source points, many branches of cloud flashes can be traced as well as those parts of CG strokes which radiate in the VHF range (such as preliminary breakdown, stepped leader phase). However, due to short sensor baselines, the need to select sensor locations with small RF noise levels (still producing up to 1,000 triggers per second in the absence of lightning [54]), limitations of wave propagation (line of sight) and very large data rates it remains a challenging task to monitor continuously complete storms occurring over large geographical areas and to deliver results in real time. Undoubtedly, the attainable level of information from VHF-arrays is extremely useful for basic studies of discharge processes. It is a different matter, though, to collect total lightning data for practical routine purposes, such as serving the needs of operational weather services, where this high level of information is not required; usually, cloud activity is sufficiently described by reporting time and (2- or 3-dimensional) location of IC events, which occur separated in time and space, provided that the system produces adequate detection efficiency and a time resolution of, say, 1 ms. With respect to reporting of total lightning it may be added that the necessary CG data is more difficult to obtain from VHF systems. Although 3D-networks can map channels extending down to ground, the required reliability to confirm a CG stroke and, thus, to provide total lightning, is not readily attained; for example, the distinction between channels connecting to ground and attempted leaders remains difficult and positive leader channels
2
are not readily detected. For this reason, SAFIR systems add an independent VLF/LF sensor at each site aimed at obtaining higher sensitivity for CG strokes. When systems of this kind are used for research purposes, employment of two different frequency ranges is advantageous: it allows to obtain complementary information about the discharge processes, because different parts of flashes are traced which may occur at different microphysical time intervals. LINET, by comparison, provides total lightning by utilizing solely VLF/LF sources, and reports events not commonly used in the past, but it produces fewer details about IC processes. Ample data exists on electric and magnetic field records for CG strokes and much effort has been spent to describe successfully the decisive steps of the discharge processes. The main stages in the evolution of a CG stroke have been detailed in standard literature and textbooks [29, 39, 55], comprising excellent descriptions of initial in-cloud activity with break-down processes, development of a stepped leader, attachment and, finally, the return stroke. For many decades various technical methods have been efficiently applied to obtain electrical and magnetic field records which can be used to demonstrate the validity of the quoted principal discharge mechanism. By comparison, occurrence of IC events in the VLF regime has received less attention though field records contain both CG and IC signals. One of the reasons for this lies in the difficulty to take measurements with the corresponding information on discharge locations [39, 46]. Of course, electric field pulses in cloud lightning discharges have been recorded and used to determine pulse occurrence statistics and wave-shape characteristics [57]. Chaotic pulse trains generated by lightning flashes have been reported by Gomes et al. [21], and signatures of IC electric field pulses have been presented by Sharma et al. [46]. All authors agree that IC events inherently exhibit more variability than CG strokes. Our experimental findings on IC events with different characteristics are compatible with these previous observations, and we can add information about the statistics of their production during entire storms. Interestingly, a class of IC events exhibits waveforms which are less complex and look similar to CG strokes. Although much knowledge has been accumulated about the general occurrence of IC discharges [39], detailed explanations of the various IC types observed in the VLF/LF regime, pulse shapes of single events and pulse trains, frequency of occurrence and repeated similarities to CG strokes are not yet at hand.
Betz et al: Cloud Lightning: Detection and Utilization for total lightning measured in the VLF/LF regime Volume 2, 2007, pages 1-17 © JOLR 2007 (www.jolr.org)
Very large amplitude IC events have received more attention, namely the relatively short pulses which represent a particular and quite uncommon class of IC events, usually termed as narrow bipolar events (NBE) and observed along with strong VHF pulses [16, 28, 48]. We will explain later that this class of rare events, though covered by our measurements, is different from the bulk of IC events reported in this paper. For more than 10 years the Munich group has detected large numbers of low-current events in the VLF/LF regime [4-5, 17] but was unable to provide a clear identification of the origin. In the meantime, technical progress was achieved and the Munich network has been expanded to LINET, an operational European lightning detection network, which allows reliable measurements of total lightning in the VLF/LF regime. Although it is generally known that weak IC discharges exist abundantly and that IC discharges in general are of meteorological significance, among others for the recognition of severe weather conditions, conventional operational VLF/LF networks do not yet exploit these low-amplitude events. By contrast, we use LINET in its continuous mode for monitoring of thunderstorms and present statistically significant information about the occurrence of both CG strokes and IC signals in the VLF/LF range. For storms in the observation area the entire IC event activity is reported in terms of coordinates, emission height and current. In general, the observed IC events show higher abundance and lower strength as compared to CG strokes, but some features are similar to the ones known from flashes containing return strokes, so that IC-CG distinction often becomes a tedious task. As regards theoretical descriptions, lightning parameters of the reported kind appear to be useful as input for numerical cloud models aimed at an improved understanding of the mechanisms governing discharge processes in convective clouds. 2 MUNICH LIGHTNING DETECTION NETWORK LINET
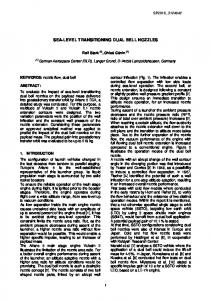
Fig. 1 shows the network configuration used to monitor the thunderstorms of 2005 in the South of Germany. In total 21 identical sensors are distributed over an area of ~300 x 400 km and connected by internet to a central processing unit. Six of the sensors were part of the DLR-operated network which was utilized in Brazil in early 2005 [45], in the Darwin area in Australia in late 2005 and early 2006, and moved in May 2006 to Benin for observations of the African monsoon. A relatively short sensor baseline of ~25 km was chosen in the Mu-
3
nich area with the intention of observing signals simultaneously at a large number of narrowly spaced sensor stations to provide highly redundant information especially for the investigation of the low-current range. This configuration accommodates the conditions necessary to achieve three goals: 1) detection of very small signals, search for physically caused peaks in the IC and CG current distributions, and quantitative investigation of the differences between IC and CG amplitude distributions; 2) CG-IC discrimination with maximum reliability and a minimum of adjustable parameters; 3) check of locating accuracy and data consistency: inside the dense part of the network an optimum location accuracy is feasible which reflects the inherent quality of the network components and analysis procedures. Furthermore, the performance of the customary ‘operational’ network with much larger baselines can be evaluated by comparison with an additional data analysis which utilizes all sensors in the presently described network.
Fig. 1. Network configuration for the thunderstorm season 2005 in Southern Germany. In total, 21 sensors have been used with baselines around 25 km in the Munich area and some 120 km otherwise. Sensor sites are indicated by triangles.
The sensor technology and measurement procedures have been described in several previous contributions [6, 44]. In brief, LINET measures continuously the components of the magnetic induction without any deadtime and records full waveforms for all analyzed signals with a digitizing rate of 1 MHz and a GPStiming error of less than 0.1 µs. It is important to note that a favorable signal-to-noise ratio is achieved also for signals just above the noise level due to the fact that the magnetic induction is sensed directly rather than the time derivative of the field, i.e. no integrating circuit is
Betz et al: Cloud Lightning: Detection and Utilization for total lightning measured in the VLF/LF regime Volume 2, 2007, pages 1-17 © JOLR 2007 (www.jolr.org)
needed. Stroke locating is performed by means of timeof-arrival and – to some extent – direction finding, while IC-CG event discrimination is executed with a 3D analysis [7] specially developed for application in VLF/LF networks. This procedure utilizes the fortunate circumstance that all four types of return strokes (with negative and positive downward and upward leader, respectively, as defined by MacGorman and Rust [29], Fig. 5.9) emit the maximum VLF/LF radiation near ground level. This remarkable fact becomes also obvious from the observation that multiple ground connections for different strokes in a flash can be distinguished in VLF/LF measurements even when the higher lying main part of the channel is the same for all strokes. By contrast, any IC event emits necessarily from a high altitude and, thus, IC signals reach a sensor with a time delay as compared to emission near ground, occurring at the same time and at the same 2D coordinates. This delay amounts to more than 1 µs for typical IC events which radiate from a height of 8 km and are observed at distances of less than 100 km. For reasonably well identified signals our network exhibits an effective eventtime resolution of ~ 0.2 µs, enabled by accurate distance calculations and consideration of propagation speeds approximately corrected for dispersion and typical ground conductivities [58]. As a consequence, reliable discrimination becomes feasible inside the network for distances up to ~100 km between lightning and closest sensor; accordingly, the network baseline should not be much larger than 200 km. Along these lines, the choice of very low sensors distances in the South of the network is not absolutely necessary, but serves the purpose to remove any ambiguity with respect to the detection of the quoted time delays, in the attempt to achieve highly reliable IC-CG discrimination. The network is equally sensitive to IC and CG signals so that a good indication of total lightning can be obtained in the range of detectable VLF/LF lightning current amplitudes. Most important, the short baselines and over-determined data sets for each discharge not only provide a reliable basis for the discrimination required in view of the large number of detected and located signals, but also enable measurement of very weak IC events with normalized currents down to ~1 kA. Concerning goal 3, inside the network a statistical average 2D-location accuracy for CG strokes is attained which reaches values of ~100 m, consistent with the quoted small residual time errors, and as deduced from comparison with several well documented strike locations (damaged buildings). Due to natural conditions and un-
4
avoidable systematic errors, this high level of accuracy is not always attained and it would be unrealistic to try for further improvements. As is typical, many storms developed during the 2005 season; on July 25 and 29 extremely heavy storms covered large parts of the observation area and resulted in more than 100,000 and 700,000 localized CG strokes and IC events, respectively. Sensor responses of up to 100 events/second were frequent and in rare cases 5minute total lightning rates above 12,000 localized events were reported in real-time. Fig. 2 presents an example of observations obtained during a 5-minute time interval for one of the storms producing very intense cells. One can discern event clusters that appear to have dimensions similar to the cells of a multi-cell storm. In the shown segment, the number of IC events exceeds the number of CG strokes by roughly an order of magnitude, though some of the weaker IC events may have been misclassified as CG strokes.
Fig. 2. Lightning map for a cell with strong convection during a thunderstorm on July 29, 2005, for the 5-minute period from 17:00 to 17:05 UTC. Vertical and horizontal axis refer to latitude and longitude, respectively. In the shown segment, points identify 7,760 IC events and 1,060 CG strokes. Some very weak IC events with currents below 3 kA may have been misclassified as CG strokes. In the entire observation area (Fig. 1) 12,600 lightning events have been localized within the 5 minute interval. Sensor sites are indicated by triangles.
3
OCCURENCE AND LOCATING OF IC EVENTS
To our knowledge and in line with statements by Rakov and Uman [39] IC discharges have been less well studied than CG flashes because of (i) the difficulty of
Betz et al: Cloud Lightning: Detection and Utilization for total lightning measured in the VLF/LF regime Volume 2, 2007, pages 1-17 © JOLR 2007 (www.jolr.org)
securing photographic records of IC channels and (ii) the inability to measure directly the currents and charge transfers associated with IC flashes, as has been done on towers for ground discharges. When this statement is applied to the VLF/LF part of IC discharges we may add that (iii) for relatively weak channel currents it is more difficult to measure and locate the bulk of IC events. Let us explain why LINET succeeds to measure IC’s with high efficiency even for low amplitudes. There are mainly three reasons: first, small signals just above the noise level can be handled (see preceding section). Second, each signal is treated independent of its waveform so that any IC event, whether of chaotic form or more CG-like, has a high chance to be identified and located by the 3D-algorithm. Third, the baseline of the employed network configuration was relatively small. As a result, IC events could be recorded quite comprehensively. The IC-related field records often differ from the ones for CG strokes, but in many cases there are similarities in the respective waveforms which render a discrimination on the basis of signal shapes quite difficult. We observe different classes of IC events which will be detailed below; interestingly, in many cases IC events are not correlated with CG strokes – note that during a storm IC often outnumbers CG – and are sufficiently prominent to give the impression that lightning discharges can end up not only with a return stroke, but as well with an IC event of the types discussed here. Among those, one particular though small class of IC pulses consists of NBE’s. An IC flash produces substantial electric cloud activity for a time span often extending to about 1 second, a process which comprises a number of different steps described, for example, by Rakov and Uman [39]. They distinguish an early (active) stage, where most of the activity is observed, followed by a late (final) stage, involving initial breakdown with the inclusion of NBE, stepped leader, J- and K-, and a variety of transient processes. It may be added that more recent findings describe NBE’s as isolated processes, not associated with ordinary lightning [25]. The K-processes are often called recoils streamers or, according to Proctor [38], Qstreamers; Volland [58] describes the prominent cloud events as K-strokes. With the exception of NBE’s, the named steps of a discharge can also occur when a CG stroke becomes an intermediate or final part of the flash, but they are very different from a return stroke; most important, the associated movement of the involved charges takes place over relatively short distances so that mainly, though not exclusively, VHF signals are
5
emitted. By contrast, VLF/LF radiation signifies bridging of longer distances, well known from return strokes. The distinct IC events in the VLF/LF regime, sometimes observed with substantial currents comparable to the ones of CG strokes, are thought to represent spatially extensive discharge steps with channel lengths in the km range. Both vertically and horizontally oriented channels are expected to be observed, but both a distinction between different orientations from recorded waveforms and a more detailed description of the differences among the respective radiation patterns are not attempted here. Let us now turn to LINET characteristics which allow recording and localization of IC events and CG strokes. At each lightning sensor the data stream is monitored and whenever the signal exceeds a threshold value a 512 µs time window is analyzed without interrupting data collection. The largest peaks are marked and serve as input for the locating algorithm in the central processing unit. Each time window of length 512 µs can lead to the report of one event. In case of return strokes and for most IC activities this length of time is sufficient to identify just one event, well separated by preceding and subsequent pulses. In some cases, though, IC signals do not drop to the noise level within ~ 0.5 ms; then, the analyzed window is extended but the IC count remains limited to one event for the entire pulse train. Similar findings have been reported by Gomes et al. [21] who give examples for ‘chaotic’ pulse trains generated by lightning flashes which exhibit a most probable duration of ~500 µs and may reach much longer time spans, mostly associated with subsequent return strokes, caused by a physical process not yet identified. An IC discharge can produce one or significantly more VLF/LF signals which we measure as IC events well isolated in time from other and similar events. Since we observe fast field records and apply no waveform analysis the discrimination between IC and CG is performed later-on in the central processing unit. This implies that each sensor station initially treats all pulses alike, no matter whether they turn out to be IC or CG, negative or positive. It is worthwhile to note that amplitude distributions of IC signals and CG strokes overlap, so that an individual IC-CG discrimination for a given signal is not efficiently possible on the basis of measured normalized event currents, despite the fact that IC event amplitudes are generally lower than CG stroke amplitudes.
Betz et al: Cloud Lightning: Detection and Utilization for total lightning measured in the VLF/LF regime Volume 2, 2007, pages 1-17 © JOLR 2007 (www.jolr.org)
6
After having established the described network geometry, we examined the lightning data for internal consistency and found that inside and near the inner part of the network the employed 3D-technique for IC-CG discrimination works sufficiently well so that few doubts remain on the classification of analyzed signal types. The location analysis yields an emission height which is either near zero (CG stroke) or above a few km (IC event). A closer inspection can be performed as follows: for each event reported by a sufficient number of sensors the location algorithm tries to find the best strike coordinates. Hereby, the solution is first calculated for the 2D-case which assumes a CG stroke, and becomes accepted when the normalized χ²-value remains below a pre-selected limit which may be set to 3 (the statistical average value is unity). For larger χ²values a 3D-solution is attempted which assumes an IC event and becomes likewise accepted when the new χ²value falls below 3, but we also demand that the individually resulting height error lies below 15%, which corresponds to approximately 1.5 km uncertainty in the vertical dimension. When the decision between the CG and IC-event solution becomes uncertain, while at least one of the χ²-values remains below 6 and ensures acceptable 2D-coordinates, we assign a third status ‘undetermined’. Otherwise, a final solution is completely rejected; in this way misclassifications are minimized and we achieve a high probability for not producing grossly erroneous locations. As a further result, storm cells mostly exhibit quite compact shapes.
was almost negligible, i.e. assignment of the type ‘undetermined’ or ‘no solution’ was rare and of little statistical significance. This implies that in the vast majority of cases the type assignment does not depend on details of the acceptance criteria. All together, reliable CG-IC discrimination power turns out to persist up to distances of ~100 km between lightning and closest sensor, in line with our estimate from above. It is important to stress that IC-CG separation and high 2D-location accuracy are inherently connected and depend directly on the quoted timing accuracy; in case that the latter would not be reached, the 3D-discrimination technique could not work effectively. Comprehensive statistical descriptions of successful CG-IC discrimination, specific network detection efficiency, assignment of IC classes, and detailed comparisons with CG waveforms and current distributions will be published separately.
Fortunately, it turned out that the choice of the quoted adjustable limits for χ²-values is not very critical. In fact, the typical results are as follows: for a CG stroke the first χ²-analysis leads to acceptance; by contrast, for an IC-event the first (2D) χ²-value lies totally outside any acceptable range while the second (3D) χ²-value leads to acceptance. In some cases an ambiguous situation may arise, caused by two reasons: first, reported event time values can be in error so that no satisfactory solution can be attained. Second, the distance between lightning and the closest sensor may be too large to produce the necessary difference of the two χ²-values. Naturally, a situation of this kind arises when the lightning occurs well outside or near the borders of the network area. Due to the unsymmetrical network geometry there is a border area in the North-West (see Fig. 1) where the discrimination can become uncertain; the considered storms, though, did not cover this area. As a result of favorable sensor geometry in most parts of the network the number of questionable location solutions
Fig. 3. Waveforms of IC activity and subsequent return stroke. Parts a) - c) reproduce the signals detected at three sensor sites with distances to the lightning which amount to 83 km, 91 km and 155 km, respectively. In each plot, the two curves represent the two orthogonal components of the measured magnetic induction; d.u. indicates “digitizer units”. The zero point of the horizontal axis is labelled with the corresponding time (UTC). LINET automatically identifies the first wave train as an IC event radiating from a height of 8 km, and the second pulse as a CG stroke.
In accordance with longstanding observations VLF/LF waveforms of IC events have no unique signature but exhibit a variety of patterns. Fig. 3 reproduces the field record for a return stroke with preceding IC activity; similar pulse patterns are observed at different sensor sites. The corresponding location analysis classified the first feature as an IC event with an emission height of ~8 km, and the second pulse as a CG return stroke. In this example, the time interval between the IC pulse train and the subsequent CG stroke is too short to interpret the IC signal as last stage of preliminary breakdown, although the waveform is typical for such a proc-
Betz et al: Cloud Lightning: Detection and Utilization for total lightning measured in the VLF/LF regime Volume 2, 2007, pages 1-17 © JOLR 2007 (www.jolr.org)
ess [56]. In our data, the stepped leader process prior to a CG stroke is not always discernible, and IC signals display various typical pulse shapes. Fig. 4 reproduces three frequently observed types which may result from different parts of electrical discharge processes: 1)
multi-polar signal trains, sometimes followed by a return stroke;
2)
signals with one prominent peak and some similarity to CG strokes;
3)
series of distinct signals which cannot be termed multi-polar as in case 1 and are mostly of a bipolar nature. They show some similarity to return strokes, but appear in more or less pronounced sequences untypical for return strokes.
7
the pulses shown in Fig. 4 have been clearly identified as IC events with emission heights around 8 km above ground level.
Fig. 5. Series of magnetic field records in a 200 ms time window (top). The largest 16 signals were recorded at several sensor sites and reflect normalized lightning currents above 1.5 kA. In all cases the location algorithm identified IC events. Enlarged scales show the signal group containing pulses #6 to #10 (bottom, left: time span 7 ms), and #7 and #8 (bottom, right: time span 1 ms). In each plot, the two curves represent the two components of the measured magnetic induction.
Fig. 4. Three examples for IC event waveforms. The multi-polar pulse (top) is easily understood as an IC event, while the bipolar signals (mid, bottom) show some similarity to CG strokes. LINET clearly assigns IC character to all the shown signals. In each plot, the two curves represent the two components of the measured magnetic induction.
As a consequence of complex wave-forms, particular efforts must be spent in attempts to match the various signals from different sensors to the same lightning event, necessary to extract event times of sufficient precision for both IC-CG discrimination and flash locating by TOA techniques. For this reason, in each waveform more than one peak value is time-stamped so that there is an improved chance for the central processing algorithm to find the group with matching time marks. In general, large or unacceptable χ²-value signify the use of inconsistent time marks. Despite all precautions, some systematic errors persist such as asymmetric radiation patterns due to non-vertical channels or the wellknown change of wave trains with distance which results from frequency-dependent signal attenuation. Utilizing the described LINET 3D-analysis procedure, all
Fig. 6. Spatial distribution of 16 consecutive IC events identified in Fig. 5. The 2D zero coordinate point corresponds to longitude and latitude of 11.2° and 47.9°, respectively. The flash may be divided into two groups of events which occur almost 10 km apart but overlap in time.
In Figs. 5 and 6 we exploit the power of the IC identification procedure a step further and show an example for a series of events which occurred in rapid succession. Display of the waveforms on different time scales illuminates a complex structure. Out of a 180 ms time interval, a duration not untypical for an IC flash, we select the signals with amplitudes corresponding to currents larger than 1.5 kA; these are 16 prominent events
Betz et al: Cloud Lightning: Detection and Utilization for total lightning measured in the VLF/LF regime Volume 2, 2007, pages 1-17 © JOLR 2007 (www.jolr.org)
for which the location algorithm returns identification as IC. The extracted emission heights are sufficiently accurate to display the results in Fig. 6 with respect to longitude, latitude and altitude. The 16 discharges (numbered in order of event time) occur mainly in two spatial areas and in varying heights. Events #6 to #12 proceed within 30 ms and show an interesting feature: the effective emission height increases successively from 7.8 km for event #6 to 10.9 km for #11; only #12 yields 10.4 km, slightly out of trend, but inside the mean error of ~1.5 km. Among the 16 events most are of positive polarity, except for #4, #12, #13 and #14. In line with the sign-discussion from above, we do not want to over-interpret this detail, because the sign of IC events is not always determined without ambiguity. To better understand the event series and assess its significance it will be necessary to inspect our data pool more extensively with the inclusion of different storms. In the past, acquisition of detailed IC height information was restricted to the employment of VHF measurements, which can map radio source emission with much higher resolution, but at the expense of increased experimental efforts [3].
Fig. 7. Range normalized current amplitude distribution of IC events detected on July 29, 2005 in southern Germany (bin size 0.5 kA). The IC- distribution exhibits a peak near 2.5 kA. In the IC+ distribution no physically caused peak is found because the decrease of the curve is caused by deteriorating detection efficiency below ~1.5 kA. Among all VLF/LF signals IC+ dominates, especially in the very low current range where almost no CG strokes occur. Above ~5 kA CG strokes become dominant (not shown here).
In all storms studied we confirmed earlier statistical observation that amplitudes of series of subsequent return strokes within a flash do not depend strongly on the stroke order [15, 45]. The same trend is observed for IC event series grouped to flashes. Sufficiently charged zones are readily available for subsequent events which
8
occur after a preceding event within a time interval too short to separate charges anew. Tentatively, this finding leads to the conclusion that a single event does not deplete large volumes out of charge; it is more likely that lightning neutralizes only relatively small volumes with separated charges. Apparently, there are large charge reservoirs in extended cloud regions not removed by typical discharge events, and neutralization by lightning may have to be complemented by additional ‘silent’ recombination processes. At present, we have no information about the quantitative importance of this effect. A statistical analysis of current distributions from the data collected on July 29, 2005 is presented in Fig. 7. Regarding the determination of currents in IC lightning channels we apply the same procedure as for subsequent CG strokes. This needs some justification: since VLF/LF-signals are detected with wavelengths of about 30 km it seems justified to assume that the observed discharges occur inside reasonably long channels. As a consequence, the physical transport of substantial amounts of charge is expected to proceed similarly to the one taking place during return strokes in channels contacting the ground. Of course, the relevant velocities of the current waves for IC discharges must be known which enter the well-known relation between primary discharge current and measured EM field amplitude. For CG return strokes a wide interval of velocities is observed (2.9-24x107 m/s [24, 60]); it is reasonable to assume that relevant velocities for IC events fall into the same range. For example, Eack [16] reported influential discharge wave front velocities near 15x107 m/s, though initial leader velocities may be much lower [3]. Current determination based on measured and range normalized signal strengths is further complicated due to frequent occurrence of non-vertical IC channels and spatial anisotropies especially in the near-field range. For these reasons one must reckon with differing detection efficiencies for vertical and horizontal discharges. Thus, the determined current values contain some degree of uncertainty. Nevertheless, it seems justified to argue that the present results are reasonably meaningful, because their interpretation and use for further scientific evaluations does not depend on precise current values. In a practical approach we define the polarity of an event by the part of the waveform where the maximum amplitude occurs. A customary alternative consists in utilization of the initial polarity, but this definition often leads to inconsistencies, especially for small and chaotic pulse trains, so that we discarded this procedure. Still, as is evident from Fig. 3 (left part) and Fig. 4a, a class
Betz et al: Cloud Lightning: Detection and Utilization for total lightning measured in the VLF/LF regime Volume 2, 2007, pages 1-17 © JOLR 2007 (www.jolr.org)
of multi-polar pulses cannot be classified unambiguously into positive or negative events. Similarly, bipolar signals are difficult to classify, especially when the first peak is not much larger than the second one, or when one of the peaks is not the dominant one at all sensor sites. Consequently, for a non-negligible class of events the sign-assignment assumes a largely random character. By contrast, the simpler pulse types such as the ones shown in Fig. 4c can be classified with a significance which is comparable to the one obtained for CG strokes. As a result, a large part of IC events can be divided into positive and negative signals. In these cases, in analogy to CG+ and CG- strokes, it seems fair to assume that the measured IC+ and IC- events lower positive and negative charge downwards, respectively. As a further result we find that the relative occurrence of IC+ and IC- turns out not to be random at all; for example, for the storm data shown in Fig. 7 we find a clear excess of IC+ events which would be even more prominent if the many ambiguous cases were left out. Of course, the relation between IC+ and IC- numbers is not necessarily unique and may vary for other storm cells and geographical regions. In the low-current range we find mostly IC+ events (Fig. 7) with a trend to increase further towards even smaller currents. We note, though, that the underlying number of cells studied is too small to allow for generalization. The maximum found near 1.5 kA is certainly not real but enforced by the limits of network detection efficiency. By contrast, the IC- distribution peaks near the larger value of ~2.5 kA so that the decrease towards smaller currents must be viewed as significant. The IC+ distribution shows a small shoulder near 2.5 kA which indicates an incomplete separation of IC+ and IC- signals; this is not surprising when one considers the partial complexity of the waveforms. Measurements of low-current IC events and their sign offer several opportunities because the types of IC events presented here occur abundantly and characterize cloud activities. Of course, more studies are required to establish the significance of IC+ and IC- numbers in different storms or life cycles of convective cells. Our detection system is capable of locating the majority of prominent VLF/LFIC events observed even during very strong storms when sensor rates rise to several hundred IC events/ second. Thus, LINET might be useful for a variety of both scientific storm studies and operational meteorological applications.
9
Fig. 8. Field records of four sensors closest to an NBE with amplitude 17.4 kA, which was detected on July 16, 2005, 01:33:46:496 UTC at 12.193°/48.599°. The height determination from the 3Danalysis of the main peaks yielded 7.8 km, in reasonable agreement with the value from the two reflections (IC- and ionospheric height amount to 8 km and 90 km, respectively).
Fig. 9. CG return stroke observed at 12 sensor sites on July 16, 2005, 15:57:51:128 UTC, with a single sky-wave reflection. The structure of the reflection reproduces the one of the main peak, but a second reflection with a further time lag of about 50 µs is absent, confirming the CG nature of the stroke.
Since our data is expected to include NBE’s a first visual search among waveforms was undertaken and revealed possible candidates. As an example, Fig. 8 displays the four closest sensor responses to an event which we interpret as an NBE candidate, because it occurred isolated in time from other signals and exhibits the typical structure. The signals contain the wellknown two peaks due to sky-wave reflection paths with characteristic time delays indicative of an IC lightning source origin [49]. Utilization of this feature in the field records allowed independent determination of the IC emission height: here, the derived height amounts to 8 km (for a ionospheric altitude of 90 km) and turns out to be compatible with the 3D-height localization of 7.8
Betz et al: Cloud Lightning: Detection and Utilization for total lightning measured in the VLF/LF regime Volume 2, 2007, pages 1-17 © JOLR 2007 (www.jolr.org)
km; the current amplitude was 17.4 kA. For comparison, Fig. 9 depicts a relatively strong signal which also shows the typical waveform of a CG stroke; in this case, the 3D-analysis with up to 12 participating sensors identified a CG stroke, compatible with the fact that the wave train shows only one sky-wave reflection while a possible second one with a further time delay of some 50 µs, expected for an IC event in typical heights, is absent. At present, we cannot comment on the abundance of real NBE-type signals because a systematic search for these events has not yet been carried out. In any case, NBE’s are rare among the entire class of IC events. 4 COUNTING IC EVENTS AND COMPARIOSN WITH CG STROKES
In many publications numerical information on the number of IC flashes is given and sometimes IC/GC or IC/(IC+CG) ratios have been quantified [18, 53]. Undoubtedly, numerical data of this kind is particularly helpful for a variety of purposes such as, for example, recognition of severe weather or attempts to determine absolute lightning-induced NOx production [18, 36]. For many purposes, measurement of the time-variation of IC activity satisfies the needs; then, the efficiency of the detection system is relatively unimportant. In other circumstances, it is sufficient to give the flash numbers, ignoring the fine structure and event numbers within the discharges. By contrast, when quantitative IC activity or comparison with CG strokes are aimed at, or when results from different observation techniques are compared, well defined counting becomes necessary and the underlying procedures need to be discussed. In a first approximation one may count IC and CG flashes. Obviously, an IC flash is a complete discharge process which does not contain any CG stroke, while a CG flash contains at least one ground stroke, irrespective of the (possibly large) number of associated IC events. CG flashes are well defined by the requirement that the discharge – whatever its complexity – touches ground at some time. In principle, thus, a CG flash count should not be difficult. However, when comparing counts from different systems, one must consider the effect of varying signal thresholds and criteria for detection of lightning events. In many systems, theses influential parameters are not easily available because ground truth data is difficult to obtain. Employment of independent networks helps to resolve the issue, but is no easy task. For example, during the international TROCCINOX campaign in Brazil, where a major focus
10
concerned counting of lightning events in order to derive estimates for lightning induced NOx production, a LINET system was temporally installed [45] and compared with the local RINDAT network, which also operates in the VLF/LF range and is similar to NLDN [3435]. For currents above ~12 kA both systems delivered comparable stroke counts, but for lightning with lower amplitudes LINET detected an order of magnitude more events. According to our 3D-analysis inside the central area where LINET was highly effective, the additional signals contained dominantly IC events but also showed a substantial number of weak subsequent and, to a lesser amount, first CG strokes. This example illustrates the differences between detection systems and the practical hurdles to arrive at true lightning counts. At a first glance, IC flash counting too appears as an easy task, because it suffices to catch at least one part of the flash activity. In a closer view, though, it might not be straightforward to distinguish between different flashes during heavy activity, when many branches develop and both in-cloud and intra-cloud discharges occur within overlapping time intervals, or to exclude flashes which finally produce a weak return stroke and, thus, should be counted as CG flash. Also, it is known that VHF systems do not respond as effectively to positively as to negatively charged channels or leaders. In the present paper we prefer an event count procedure, i.e. we count all time-separated IC events and all first and subsequent return strokes, independent of grouping to flashes. As long as the same observation technique (VLF/LF) is used for the detection of both IC events and return strokes, a well-defined and consistent counting becomes possible. As regards counting efficiency, thresholds are influential (see Fig. 5 where only 16 out of many more signals have been located), but it is advantageous that only one count is obtained per VLF/LF-event. The counted events reflect similar electromagnetic emission effects though the underlying discharge processes and their initiation may be very different for IC events and CG strokes. Since LINET exhibits comparable efficiency for both IC- and CG detection, count numbers and ratios become meaningful and can be used for further analysis such as calculation of lightning-induced NOx production [23]; we do not dwell on the open question to what extent specific processes in a flash contribute to NOx. Still, one principal shortcoming must be mentioned: due to the abundance of weakcurrent IC events their detection is limited by the sensor baseline in the considered network area; the larger the baseline, the fewer low-amplitude IC events will be
Betz et al: Cloud Lightning: Detection and Utilization for total lightning measured in the VLF/LF regime Volume 2, 2007, pages 1-17 © JOLR 2007 (www.jolr.org)
captured. Consequently, ‘true’ IC event fractions hardly exist and comparisons of IC event counts in different environments must take into account the respective collection efficiencies. In addition, there may be cloud activity which does not give rise to substantial VLF/LF emission. Use of different techniques for the determination of ‘total’ lightning, e.g. by means of simultaneous VHF and VLF/LF observations for the detection of IC events and CG strokes, respectively, encounter some problems. First of all, VHF mapping produces source points which must be grouped to ‘larger’ discharge steps and associated channels, not necessarily related to VLF/LF events; of course, the VHF technique must be truly 3-dimensional in order to relate, for example, a stepped-leader source-point series to either IC activity or a subsequent return stroke. Second, VHF and VLF/LF observations are sensitive to different steps in the breakdown processes and, thus, produce inherently incompatible event numbers. Third, the detection efficiency of the employed technologies must be known. As an example, VHF mapping systems such as some versions of the SAFIR system are limited to signal rates of 100 IC source points/second and 20 CG signals/second from the attached VLF sensor (used as CG indicator) and, thus, may miss significant parts of intensive discharges [2, 19]. Likewise, VLF/LF detection procedures are limited to event amplitudes above a certain threshold which depends on network geometry and details of signal handling.
11
expected [25, 52], but it is not yet known how often and under what circumstances these events are produced. In a significant number of storms particularly massive convection rapidly develops and, in rare cases, leads to supercells.
Fig. 10a. IC event and CG stroke rates of lightning representing a very strong cell observed on July 25, 2005. IC event rates dominate from 11:15 to 13:15 UTC.
All together, both relative and absolute IC-CG event numbers are important for a variety of applications. Absolute numbers are difficult to determine and quotation requires an accurate description of the employed detection techniques. Relative and incomplete numbers, which may result from partially ineffective networks or the use of different techniques, remain useful for an assessment of time-evolutions of event rates. 5
IC DISCHARGES AND SEVERE WEATHER
It is well known that IC activity and especially shorttime large increases of the IC flash rate often correlate with the advent of severe weather [62]. Heavy thunderstorms have been investigated thoroughly by Lang et al. [27], who give also an overview of the well-known STEPS field campaign; further details can be found in Wiens et al. [30, 43, 61]. As regards the special class of strong and bipolar IC (NBE) lightning, meteorological significance for the recognition of strong convection is
Fig. 10b. Density of IC and CG lightning for the strong cell from Fig. 10a. The large difference in IC and CG densities results from the differing spatial extension of the respective emission areas.
A typical example of strong convection is depicted in Fig. 10a for the storm on July 25, 2005; both the flash rate and the density of the lightning increase steeply at
Betz et al: Cloud Lightning: Detection and Utilization for total lightning measured in the VLF/LF regime Volume 2, 2007, pages 1-17 © JOLR 2007 (www.jolr.org)
11:30 UTC and reach a maximum at 12:30 UTC. The number of IC events becomes much larger than the one for CG strokes. The German Weather Service reported for this area in the quoted time interval strong winds and micro-bursts, heavy rain and hailstones on the ground with sizes up to 2 cm. The density of events is depicted in Fig. 10b; since the storm covered a larger area (500 x 150 km) and the massive IC events occurred within a more compact area (100 x 50 km), the IC and CG densities differ greatly and may be viewed as not fully compatible, but for practical reasons the chosen data representation enhances the chance to recognize unusual cell developments. For the sake of completeness we add that the polarities of the involved CG strokes were mostly negative and did not show any trend to reverse. Our data in Fig. 10b is similar to basic features of lightning source density plots derived from the North Alabama Lightning Mapping Array [20]. We add the observation that the commercially operating VLF/LF lightning detection network in Germany, which – according to its design – reports primarily CG strokes and limited numbers of IC discharges for currents above ~5 kA (median ~10 kA), was unable to detect the extreme increase of the IC activity for the case from above. Thus, effective recognition of IC discharges, along with the reporting of CG strokes in a current range above ~2 kA, is a feature of LINET not commonly available before. Of course, CG strokes with currents above ~10 kA are detected in both networks with practically the same efficiency. In a further attempt to support nowcasting of thunderstorms, the ‘total lightning’ ability of LINET has been used to develop a cell-tracking module which allows to monitor both the total lightning density and the fraction of IC events relative to CG strokes. The high detection efficiency and accurate locating capability of LINET are particularly advantageous to achieve fast identification of cells, cell contours, and cell propagation, and to extract information on life cycles. First results indicate that the tool is helpful when decisions have to be made with respect to the definition of warning levels for severe weather conditions. Fig. 11a displays the distribution of observed emission heights for another, similarly strong cell observed on July 29, 2005; IC+ emission is centered around 8 km height, and IC- events peak at slightly higher altitudes, although the small difference is hardly significant. In line with the height observations shown in Fig. 6 one
12
must realize that IC emissions can occur within the entire updraft region so that no distinct maximum is to be
Fig. 11a. Distribution of 8,245 emission heights from IC events radiated from a strong-convection cell on July 29, 2005, in the area 11°-11.5°/47.6°-48.1°, corresponding to an area of more than 2,000 km² (height bin size 0.5 km). No significant difference of emission heights for IC+ and IC- is discernible. During the entire storm LINET localized more than 700,000 lightning events.
Fig. 11b. Distribution of 381,000 emission heights from IC events located within the observation area on July 29, 2005 (height bin size 0.5 km). Since large time intervals and space regions are summed it is not possible to discern fine details of emission heights as depicted in Fig. 6. High-altitude emission is detected but awaits an explanation.
found when data are accumulated over large areas and time intervals. For comparison, Fig. 11b shows the accumulated height distribution for all IC discharges located in the observation area on July 29, 2005. No emission height below 2 km is obtained, although the evaluation procedure could give rise to any positive height value. By contrast, very high emission altitudes are repeatedly produced by the locating algorithm, which extend above typical cloud tops of severe storms (12-15 km above mean sea level, see Fig. 13) and, thus, are difficult to accept. At a first glance one may attribute the effect to increasing statistical height errors, especially of the weaker events which are detected by a
Betz et al: Cloud Lightning: Detection and Utilization for total lightning measured in the VLF/LF regime Volume 2, 2007, pages 1-17 © JOLR 2007 (www.jolr.org)
more limited number of sensors. Although errors of this kind must be expected the internal consistency of the TOA-results is too high to fully explain the problematic heights along these lines. In a forthcoming contribution a further possibility for systematic errors will be examined which relates to differing propagation conditions for high- altitude and ground emission within the nearfield region and may lead to an overestimate of the larger height values.
Fig. 12. Reflectivity scan by the DLR research radar (POLDIRAD) for a storm cell on July 8, 2004, 16:11 UTC. Prominent areas of higher and lower reflectivity exhibit dominant IC events (white dots) and CG strokes (green and red dots), respectively. The radar site is situated in the South-West of Munich (11.28° / 48.06°, see Fig. 1).
Fig. 13. Reflectivity from a vertical scan of the POLDIRAD radar at an azimuth of 100° from DLR for a storm cell on June 29, 2005, 13:22-13:24 UTC. It can be seen that IC events (red dots) occur right in the area and height region with high reflectivity. CG strokes are shown in the bottom part (green dots).
In this connection, it may be mentioned that Smith et al. [49] report VLF/LF emission heights up to 30 km
13
for NBE’s. However, these are strong events with amplitudes above ~15 kA which represent, in the author’s analysis, only ~1% of all detected waveforms. The authors suggest that the surprisingly high altitudes may be associated with discharges between the upper charge layer of a storm and a screening layer of charge above the storm. More recently, the NBE’s in question are believed to reflect cosmic-ray induced discharges which differ from ordinary lightning [25] and may be related to severe weather. We can not yet tell in what way the measured VLF/LF emission heights are geometrically related to the corresponding channel; while for CG strokes the contacted ground provides a fixed boundary condition, IC channels develop ‘electrodeless’ in the clouds in between relevant charge regions. For this reason, the most simple assumption is to attribute the emission heights to the geometrical center of the channel, but at present it can not be completely ruled out that, depending on the detailed breakdown process, one or the other end of the channel emits dominant VLF/LF radiation; in analogy to the asymmetric situation for CG strokes one may speculate that this part of an IC channel dominates where the detected current wave starts to flow. Clearly, this topic needs further attention. Along these lines the question arises whether there is a statistical correlation between channel length and observed current. There is some hope that these issues can be investigated by our ongoing endeavor for simultaneous observations utilizing LINET and high-resolution 3D-VHF arrangements. It is elucidating to consider overlays between lightning and radar images; this method is quite common in severe weather observation and allows better assessment of acquired data [43]. Fig. 12 presents a comparison between LINET lightning locations and 2D radar observations of a storm cell scanned on July 8, 2004, 16:11 UTC, utilizing high-resolution instrumentation (POLDIRAD) at the DLR research laboratory in the southwest of Munich. Two cell regions are discernible: the one in the southwest shows moderate reflectivity and contains mainly CG strokes, while the second cell in the North-East exhibits very high reflectivity and contains mainly IC events. In Fig. 13 the reflectivity is depicted as a function of the height (100° azimuth) for a storm cell observed on June 29, 2005, during the 2minute time interval 13:22 – 13:24 UTC. It can be seen that the IC events occur right inside the volume with highest reflectivity in altitudes between 5 and 9 km. Clearly, the combination between radar images and lightning locations offers valuable insight into the evo-
Betz et al: Cloud Lightning: Detection and Utilization for total lightning measured in the VLF/LF regime Volume 2, 2007, pages 1-17 © JOLR 2007 (www.jolr.org)
lution of storm cells and proves the usefulness of combined observation techniques. 6 CONCLUSION AND PERSPECTIVES
In the past, emphasis in VLF/LF lightning detection was put on the measurement of CG return strokes while the potential of IC discharges in this frequency domain was not greatly exploited. With LINET we provide an additional tool for quantitative detection of IC activity and, together with the equally efficient CG identification, for total lightning observations in real time and in large surveillance areas. For a number of applications, thus, VLF/LF detection of ‘total lightning’ represents an alternative to VHF systems. For the sake of clarity we note that the presently described dense part of the network is not vital to obtain the quoted advantages. Excellent IC-CG discrimination remains possible inside the network area as long as sensor baselines do not exceed ~200 km. Of course, larger baselines necessarily raise the lower amplitude threshold for detectable events and increase the height error. With the given dense network, it is shown that large numbers of IC signals can be measured especially in the low-current range down to ~1 kA. We demonstrated that there is a large class of IC radiation which allow meaningful definition of the sign of recorded amplitudes. In addition, for each located IC event an emission height can be determined which reflects a yet unknown part of the discharge channel. Event rates, current distributions and height information are well suited to provide benefit for numerical thundercloud models with respect to all involved electrification processes; the adjustment of model input parameters is facilitated by a comparison between quantitative model output and corresponding experimental results. Theoretical cloud models for ordinary lightning such as, for example, EMTM (Explicit Microphysics Thunderstorm Model, [32, 50-51]) with lightning parameterization could be used for a quantitative calculation of charge separation and subsequent neutralization processes. Among many microphysical output quantities charge density, electric field and charge in the lightning channels are computed and the actually observed IC rates could be exploited for adjustment of influential input parameters. In particular, the separate observation of a group of IC+ and IC- events and the associated current distributions may represent useful scaling data for numerical model calculations of the evolution of electrification and lightning processes. Another application of the increased LINET detection efficiency refers, for example, to the determination of
14
lightning-induced NOx production. The recent EU campaign TROCCINOX – Tropical Convection, Cirrus and Nitrogen Oxides – in Brazil is now under evaluation; lightning measurements have been described [45] and comprehensive results in atmospheric chemistry may be expected, especially on NOx-production based on airborne measurements and generalized on the basis of lightning event counts [13, 23]. Since LINET has been utilized for a variety of research projects in Germany, Brazil, Australia, Africa, and started a permanent operation in thirteen European countries in 2006 [8], lightning data of almost identical quality has become available in different climate regimes. This enables interesting comparisons between the respective lightning parameters of thunderstorms [22]. In addition, results from local networks can be studied and compared with LINET data. A challenging task is given by the scaling of global lightning detection networks by means of LINET. A first attempt was pursued regarding ZEUS, a long-range lightning detection system with 5 sensors in Europe [1]. Since ZEUS, just as other global networks, does not report signal amplitudes, sign, IC-CG discrimination, and exhibits limited location accuracy, it is not known how many and what kind of events are actually measured. In order to shed light on the performance of ZEUS, a detailed comparison with LINET in Germany was carried out [14]. Again, it was advantageous to use LINET because of its high efficiency, ‘total-lightning’ capability, location accuracy, and the ICCG discrimination power. Further work concerns the global scaling of NOx production based on a number of local measurements and scaled by means of LINETcalibrated global networks [13]. Finally, it is worthwhile to draw attention to practical and operational applications of total lightning. We observe various types of IC waveforms in line with numerous previous findings by many authors, but automated the detection procedure for continuous observation. Together with the high network efficiency for the reporting of low-amplitude signals we provide statistically significant signal classifications, representative for the larger part of actually occurring IC events. Among other applications, the described network features lead to easier and faster recognition of storm cells, and allow relatively simple cell-tracking and some nowcasting of storm evolutions. Furthermore, registration of fast changes of IC event rates, including IC+ and IC- components, and their relation to CG stroke rates offer additional decision criteria for identification
Betz et al: Cloud Lightning: Detection and Utilization for total lightning measured in the VLF/LF regime Volume 2, 2007, pages 1-17 © JOLR 2007 (www.jolr.org)
of severe weather conditions and definition of warning levels.
12
Cummins K. L., J. A. Cramer, C. Biagi, E. P. Krider, J. Jerauld, M. A. Uman, and V. A. Rakov, “The U.S. National Lightning Detection Network: Post-Upgrade Status”, 2nd Conference on Meteorological Applications of Lightning Data, Jan. 29 – Feb. 02., 2006, Atlanta (USA).
13
Defer E., V. Kotroni, H. Huntrieser, H.-D. Betz, and K. Schmidt, „Regional ZEUS lightning distribution in Europe and inferred NOx production“, EGU General Assembly, April 2-7, 2006a, Vienna.
14
Defer E., K. Schmidt, and H.-D. Betz, “Concurrent VLF/LF lightning observations from ZEUS and LINET Networks”, EGU General Assembly, April 2-7, 2006b, Vienna.
15
Diendorfer, G., W. Schulz, and V. A. Rokov, „Lightning Characteristics Based on data from the Austrian Lightning Location System“, IEEE Transactions on Electromagnetic Compatibility, Vol. 40, No. 4, 452-464, 1998.
7 ACKNOWLEDGEMENT
The authors thank NowCast mobile GmbH, Münchener Universitätsgesellschaft, Dr. PritzscheStiftung, and Deutsche Forschungsgemeinschaft for partial support of this work. Valuable clarifications and comments have been provided by Eric Defer, especially with respect to VHF system performances. 8 REFERENCES
15
1
Anagnostou, E. N., T. Chronis, and D. P. Lalas, “New Receiver Network Advances Long-Range Lightning Monitoring”, EOS-transactions, Vol. 83, No. 50, 589, 594-595, 2002.
2
Beekhuis H., “Upgrade and Evaluation of a Lightning Detection System”, 18th International Lightning Detection Conference, 7-9 June 2004, Helsinki (Finland).
16
Eack K. B., “Electrical characteristics of narrow bipolar events”, J. Geophys. Res. Lett., Vol. 31, L20102, doi:10.1029/ 2004GL021117, 2004.
3
Behnke, S. A., R. J. Thomas, P. R. Krehbiel, and W. Rison, “Initial leader velocities during intracloud lightning: Possible evidence for a runaway breakdown effect”, J. Geophys. Res., Vol. 110, D10207, doi: 10.1029/2004JD005312, 2005.
17
Eisert B., W. P. Oettinger, A. Gerl, R. Kulzer, and H.-D. Betz, „Investigation of Strokes in Natural Lightning Events“, Proc. 24th International Conference on Lightning Protection, Birmingham, p. 88-91, 1998.
4
Betz H.-D., W. P. Oettinger, B. Eisert, and A. Gerl, „Threshold Dependency of Lightning Detection“, Proc. 26th General Assembly URSI, Toronto, p. 270, 1999.
18
5
Betz H.-D., W. P. Oettinger, B. Eisert, and A. Gerl, „Amplitude and Event-time Distribution of Sferics”, Proc. 25th International Conference on Lightning Protection, Rhodos, p. 188191, 2000.
Fehr, Th., H. Höller, and H. Huntrieser, “Model study on production and transport of lightning-produced NOx in a EULINOX supercell storm”, J. Geophys. Res., Vol. 109, D09102, doi:10.1029/2003JD 003935, 2004.
19
Finke, U., Th. Hauf, and O. Kreyer, “A SAFIR lightning network in Northern Germany”, Meteorol. Appl., submitted, 2005. Goodman, S. J., R. Blakeslee, H. Christian, W. Koshak, J. Bailey, J. Hall, E. McCaul, D. Buechler, C. Darden, and J. Burks, “The North Alabama Lightning Mapping Array: Recent severe storm observations and future prospects”, Atmospheric Research, Vol. 76, No. 1-4, 423-437, 2005.
6
Betz H.-D., K. Schmidt, W. P. Oettinger, and M. Wirz, „Total VLF/VF-Lightning and Pseudo 3D-Discriminatuion of IntraCloud and Cloud-to Ground Discharges“, 18th International Lightning Detection Conference, 7-9 June 2004a, Helsinki (Finland).
20
7
Betz H.-D., K. Schmidt, P. Oettinger, and M. Wirz, „Lightning Detection with 3D-Discrimination of Intracloud and Cloud-toGround Discharges“, J. Geophys. Res. Lett., Vol. 31, L11108, doi:10.1029/2004GL019821, 2004b.
21 Gomes, Ch., V. Cooray, M. Fernando, R. Montano, and U. Sonnadara, J. Atmosph. and Solar-Terrest. Physics 66, 17331743, 2004.
8
Betz H.-D., P. Oettinger, K. Schmidt, and E. Defer, „A New Lightning Detection Network in Central Europe“, AGU Fall Meeting, AE42A-08, 11-15 December, San Francisco, 2006.
9
Cooray V., “Electrical field at the discharge tip couples the speed and currents of dart leaders, return strokes and Mcomponents”, J. Electrost., Vol. 40-41, pp. 85-90, 1997.
10
Cramer J. A., K. L. Cummins, A. Morris, R. Smith, and T. R. Turner, “Recent Upgrades to the U.S. National Lightning Detection Network”, 18th International Lightning Detection Conference, 7-9 June 2004, Helsinki (Finland).
11
Cummins K. L., E. P. Krider, and M. D. Malone, “The U.S. National Lightning Detection Network and Applications of Cloud-to-Ground Lightning Data by Electric Power Utilities”, IEEE Trans. Electromagnetic Compatibility, Vol. 40, no. 4, pp. 465-480, 1998.
22 Höller H., H.-D. Betz, and K. Schmidt, „LINET lightning observations in different climate regimes“, EGU General Assembly, April 2-7, 2006, Vienna. 23
Huntrieser H., H. Schlager, H. Höller, U. Schumann, H.-D. Betz, D. Bocippio, D. Brunner, C. Forster, and A. Stohl, „Lightning–produced NOx in tropical, subtropical and midlatitude thunderstorms: New insights from airborne and lightning observations“, EGU General Assembly, April 2-7, 2006, Vienna.
24
Idone V. P., and R. E. Orville, “Lightning Return Stroke Velocities in the Thunderstorm Research International Program (TRIP)”, J. Geophys. Res., Vol. 87, No. C7, pp. 4903-4915, 1982.
25
Jacobson, A. R., and M. J. Heavner, “Comparison of Narrow Bipolar Events with Ordinary Lightning as Proxies for Severe
Betz et al: Cloud Lightning: Detection and Utilization for total lightning measured in the VLF/LF regime Volume 2, 2007, pages 1-17 © JOLR 2007 (www.jolr.org) Convection”, Monthly Weather Review, Vol. 133, 1144-1154, 2005. 26
27
Krehbiel P. R., R. J. Thomas, W. Rison, T. Hamlin, J. Harlin and M. Davis, “GPS-based mapping system reveals lightning inside storms”, Eos, Trans, Am. Geophys. Union, Vol. 81, (3), 21-25, 2000. Lang, T. J., L. J. Miller, M. Weisman, S. A. Rutledge, L. J. Barker, V. N. Bringi, V. Chandraseka, A. DetWiler, N. Doesken, J. Helsdon, Ch. Knight, P. Krehbiel, W. A. Lyons, D. MacGorman, E. Rasmussen, W. Rison, W. D. Rust, and R. J. Thomas, „The Severe Thunderstorm Electrification and Precipitation Study“, Bull. Am. Met. Soc., p. 1107-1125, August 2004.
28
Le Vine D. M., “Sources of the Strongest RF Radiation From Lightning”, J. Geophys. Res., Vol. 85, No. C7, pp. 4091-4095, 1980.
29
MacGorman, D. R., and W. D. Rust, “The Electrical Nature of Storms”, 422 pp., New York: Oxford University Press, 1998.
30
MacGorman, D. R., W. D. Rust, P. Krehbiel, W. Rison, E. Bruning, and K. Wiens, “The Electrical Structure of two Supercell Storms during STEPS”, Monthly Weather Review, Vol. 133, 2583-2607, 2005.
31 Murphy M. J., N. W. Demetriades, R. L. Holle, and K. L. Cummins, “Overview of capabilities and performance of the U.S. National Lightning Detection Network”, 12th Conference on Meteorological Applications of Lightning Data, 29.01.02.02.2006, Atlanta (USA). 32
33
Norville K., M. Baker, and J. Latham, “A Numerical Study of Thunderstorm Electrification: Model Development and Case Study”, J. Geophys. Res., Vol. 96, 7463-7481, 1991. Orville R.E., G.R. Huffines, W.R. Burrows, R.L. Holle, and K.L. Cummins, “The North American Lightning Detection Network (NLDN) – First Results: 1998-2000”, Monthly Weather Rev. 130, 2098-2109, 2002.
34
Pinto I. R., and O. Pinto, “Cloud-to-ground lightning distribution in Brazil”, J. Atmos. Sol. Terr. Phys., 65, 733-737, 2003.
35
Pinto O., K. P. Naccarato, M. M. Saba, I. R. Pinto, R. F. Abdo, S. A. Garcia, and A. C. Filho, “Recent upgrades to the Brazilian Integrated Lightning Detection Network”, 19th International Lightning Detection Conference, April 2006, Tucson (USA).
16
41
Richard P., A. Delannoy, G. Labaune, and P. Laroche, “Results of spatial and temporal characterization of the VHF-UHF radiation of lightning”, J. Geophys. Res., Vol. 91 (D1), 12481260, 1986.
42
Richard P., “Operational Applications of the SAFIR System”, International Aerospace and Ground Conference on Lightning and Static Electricity”, KSC Florida, April 16-19, 1991.
43
Rust, W. D., D. R. MacGorman, E. C. Bruning, S. A. Weiss, P. R. Krehbiel, R. J. Thomas, W. Rison, T. Hamlin, and J. Harlin, “Inverted-polarity electrical structures in thunderstorms in the Severe Thunderstorm Electrification and Precipitation Study (STEPS)”, Atmospheric Research, Vol. 76, 247-271, 2005.
44
Schmidt K., W. P. Oettinger, H.-D. Betz, M. Wirz, and G. Diendorfer, “A New Lightning detection Network in Southern Germany”, 27th Int. Conf. on Lightning Protection (ICLP), Sept. 2004, Avignon (France).
45
Schmidt K., H.-D. Betz, W. P. Oettinger, M. Wirz, O. Pinto, K. P. Naccarato, H. Höller, Th. Fehr, and G. Held, “A Comparative Analysis of Lightning Data during the EU TROCCINOX / TroCCiBras Campaign”, VIIIth International Symposium on Lightning Protection, 21st-25th November 2005, Sao Paulo, Brazil.
46
Sharma, S. R., M. Fernando, and C. Gomes, “Signatures of electric field pulses gebnerated by cloud flashes”, J. Atmosph. and Solar-Terrst. Physics 67, 413-422, 2005.
47
Shao X. M., and P. R. Krehbiel, “The spatial and temporal development of intracloud lightning”, J. Geophys. Res., Vol. 101, N0. D21, pp. 26641-26668, 1996.
48
Smith D. A., K. B. Eack, J. Harlin, M. J. Heavner, A. R. Jacobson, R. S. Masse, X. M. Shao, and K. C. Wiens, “The Los Alamos Sferic Array: A research tool for lightning investigations”, J. Geophys. Res., Vol. 107, No. D13, 10.1029/2001 DJ000502, 2002.
49
Smith D. A., M. J. Heavner, A. R. Jacobson, X. M. Shao, R. S. Massey, R. J. Sheldon, and K. C. Wiens, “A method for determining intracloud lightning and ionospheric height from VF/LF electric field records”, Radio Science, Vol. 39, RS1010, doi:10.1029/2002RS002790, 2004.
50
Solomon R., and M. Baker, “A One-Dimensional Lightning Parameterisation”, J. Geophys. Res., Vol. 101, 14983-14990, 1996.
51
Solomon R., and C. Adamo, “A lightning initiation mechanism: application to a thunderstorm electrification model”, C. R. Physique 3, 1325-1333, 2002.
36
Price C., J. Penner and M. Prather, “Nox from lightning: 1. global distribution based on lightning physics”, J. Geophys. Res., Vol. 102, 5727-5941, 1997.
37
Proctor D. E., “VHF radio pictures of cloud flashes”, J. Geophys. Res., Vol. 86, 4041-4071, 1981.
52 Suszcynsky M., and M. J. Heavner, “Narrow Bipolar Events as indicators of thunderstorm convective strength”, J. Geophys. Res., Vol. 30, 1879, doi :10.1029/2003GL017834, 2003.
38
Proctor D. E., “Lightning flashes with high origin”, J. Geophys. Res., Vol. 102, 1693-1706, 1997.
53
39
Rakov, V. A., and M. A. Uman, “Lightning: Physics and Effects”, 850 pp., Cambridge Univ. Press, New York, 2003.
40
Richard P., and G. Auffray “VHF-UHF interferometric measurements, applications to lightning discharge mapping”, Radio Science, Vol. 20, 171-192, 1985.
Théry, C., “Evaluation of LPATS data using VHF interferometric observations of lightning flashes during the Eulinox experiment”, Atmospheric Res. 56, 397-409, 2001.
54 Thomas R. J., P. R. Krehbiel, W. Rison, S. J. Hunyady, W. P. Winn, T. Hamlin, and J. Harlin, “Accuracy of the Lightning Mapping Array”, J. Geophys. Res., Vol. 109, D14207, 2004, 34 p.
Betz et al: Cloud Lightning: Detection and Utilization for total lightning measured in the VLF/LF regime Volume 2, 2007, pages 1-17 © JOLR 2007 (www.jolr.org) 55
Uman, M. A., “The Lightning Discharge”, 377 pp., Orlando, Florida: Academic Press, 1987.
56
Ushio T., Z.-I. Kawasaki, K. Mutsu-ura, and D. Wang, “Electric fields of initial breakdown in positive ground flash”, J. Geophys. Res., Vol. 103, No. D12, pp. 14135-141395, 1998.
57
Villanueva, Y., V. A. Rakov, and M. A. Uman, “Microsecondscale electric field pulses in cloud lightning discharges”, J. Geophys. Res., Vol. 99, No. D7, 14,353-14,360, 1994.
58 Volland, H., Ed., Handbook of Atmospherics, CRC, Boca Raton, Florida, 1982. 59
Wacker R.S., and R.E. Orville, “Changes in measured lightning flash count and return stroke peak current after the 1994 U.S. National Lightning Detection Network upgrade – Observations and Theory”, J. Geophys. Res. 104, No. D2, 21592162, 1999.
60
Wang D., N. Takagi, T. Watanabe, V. A. Rakov, and M. A. Uman, “Observed leader and return-stroke propagation characteristics in the bottom 400 m of a rocket-triggered channel”, J. Geophys. Res., Vol. 104, No. D12, pp. 14369-14376, 1999.
61
Wiens, K. C., S. A. Rutledge, and S. A. Tessendorf, “The 29 June 2000 supercell observed during STEPS. Part II: Lightning and charge structure”, J. Atmospheric Sciences, Vol. 62, No. 12, 4151-4177, 2005.
62
Williams E., B. Boldi, A. Matlin, M. Weber, S. Hodanish, D. Sharp, S. Goodman, R. Raghavan, and D. Buechler, “The behaviour of total lightning activity in severe Florida thunderstorms”, Atmospheric Research 51, 245-265, 1999.
17