2 4 1 5 2 8 3 0 3 1 6 0 5 3 1 3 1 9 8 9. 2 4 2 1 9 9 7 0 1 6 ... 9 5 5 3 1 4 1 1 5 7 1 1 1 3 ..... These expanded topics were input to the TRECcer program in step 3. 3.
Cluster-Based Adaptive and Batch Filtering David Eichmann, Miguel Ruiz, Padmini Srinivasan School of Library and Information Science University of Iowa
1 – Introduction Information filtering is increasingly critical to knowledge workers drowning in a growing flood of byte streams [6, 8, 9]. Our interest in the filtering track for TREC-7 grew out of work originally designed for information retrieval on the Web, using both ‘traditional’ search engine [5] and agent-based techniques [6, 7]. In particular, the work by Cutter, et. al. in clustering [3, 4] has great appeal in the potential for synergistic interaction between user and retrieval system. Our efforts for TREC-7 included two distinct filtering architectures, as well as a more traditional approach to the adhoc track (which used SMART 11.3). The filtering work was done using TRECcer – our Java-based clustering environment – alone for adaptive filtering and a combination of TRECcer and SMART for batch filtering.
2 – Adhoc Track 2.1 – Adhoc Methodology Our overall approach is to apply Rocchio-based retrieval feedback [11] for query expansion. The second run submitted (Iowacuhk2) is simply such a run with the top 10 documents from an initial retrieval run assumed relevant and the best 350 terms extracted from these documents. Documents and queries were weighted using the Lnu.ltu scheme [12] which had yielded good results in previous TREC runs [e.g., 2]. For our primary run (Iowacuhk1), we focussed on improving the initial retrieved set that is assumed relevant during retrieval feedback. The following steps describe our approach. 1. Retrieve 10 documents using the initial query (Lnu.ltu) weights. Call this set A. 2. Identify the top 3 documents for each query. 3. Treat these top 3 documents as pseudo-queries, index them against the same database and retrieve 100 documents for each pseudo query (Lnu.ltu weights with pivot average document size of 126 and a slope of 0.2). 4. Merge the 100 documents from the three pseudo-queries and eliminate duplicates. Call this set B. 5. Find the intersection of sets A and B for each topic. Use this set for retrieval feedback to expand the query. Call this set C. 6. Expand the original query by 350 terms using alpha = 8, beta = 8 and gamma = 8 with set C and using Rocchio's algorithm. 7. Retrieve the final set of 1000 documents using the expanded query (Lnu.ltu weights using the above parameters). 2.2 – Results and Analysis Figures 1 through 3 compare the performance of the two Iowa runs against the minimum, maximum and median scores for the adhoc track. Table 1 below summarizes this performance. It shows the number of topics in which the corresponding Iowa run performs at or better than the median value. Table 1: Adhoc Performance >= Median, Top 100 Retrieved
>= Median, Top 1000 Retrieved
>= Median, Avg. Precision
Avg. Precision (non-interpolated)
Exact Precision
Iowacukh1
37
32
32
0.2221
0.2680
Iowacuhk2
39
34
35
0.2260
0.2754
Thus in 64 to 78% of the topics, the Iowa runs are at or above the median performance. It is also seen that our second run, i.e., the straight Lnu.ltu and Rocchio-based retrieval feedback approach is slightly better for each measure than our primary run in which we tried to refine the set of documents used for retrieval feedback. Although somewhat
–1–
Cluster-Based Adaptive and Batch Filtering
1.2
1
Average Precision
0.8 Max Min
0.6
Median Iowacuhk1 Iowacuhk2
0.4
0.2
0 1
2
Max
0.772
0.49
Min
0.009
0
4
5
6
7
9
10
11
12
14
15
16
17
19
20
21
22
24
25
Median
0.406 0.035 0.082 0.168 0.034 0.251 0.034 0.285 0.353 0.124 0.488 0.736 0.296
Iowacuhk1
0.547 0.206 0.113 0.214 0.057 0.224 0.151 0.172 0.409 0.046
0.45
0.618 0.088 0.084 0.483 0.259 0.016 0.244 0.186 0.329
Iowacuhk2
0.539
0.47
0.619 0.264 0.101 0.518 0.259 0.014
26
27
29
30
0.356 0.379 0.078 0.573 0.157 0.592 0.602 0.359 0.707 0.984 0.575 0.262 0.561 0.444 0.114 0.506 0.398 0.616 0.518 0.463 0.436 0.428 1E-04 7E-04
0.14
0
0
0
0.006
0
0
1E-04
0.109 0.224 0.057 0.226 0.157 0.179 0.381 0.079
0
0.002 0.002
0
0.07
0
0
0
0
0
0
0.005
0
0
31 0.07 0
32
34
35
36
37
39
40
41
42
44
0
0
0
0
0
0
0.005
0 . 3 1 2 0 . 1 0 7 0 . 0 1 3 0 . 1 2 5 0 . 2 3 1 0 . 2 2 5 0 . 0 3 1 0 . 2 6 6 0 . 0 4 4 0 . 1 8 7 0 . 0 4 4 0 . 37 1 0 . 1 9 3 0 . 1 9 8 0 . 0 1 6 0 . 1 2 5 0 . 0 0 1 0 . 1 4 2 0 . 1 4 9 0 . 3 0 3
0.23
0.04
45
46
47
49
50
0 . 6 85 0 . 2 7 1 0 . 5 7 9 0 . 0 6 1 0 . 3 4 2 0 . 0 6 1 0 . 4 8 9 0 . 5 2 6 0 . 5 1 3 0 . 1 6 6 0 . 2 8 1 0 . 6 0 9 0 . 4 9 1 0 . 3 4 9 0 . 5 1 9 0.006 0.003
0
0.002 0.001
0
0
0.02
0.143 0.344
0.03
0.002
0.103 0.366
0.264 0.053 0.022 0.044
0.35
0.193 0.199 0.029 0.297
0
0.313 0.254 0.291 0.083 0.149 0.535 0.027 0.235 0.464
0.192 0.348 0.023 0.295 0.054 0.037 0.044
0.35
0.197
0
0.259 0.289 0.311 0.078 0.154 0.531 0.041 0.243
0.2
0.029 0.307
0.46
Topic
Figure 1: Adhoc Retrieval, Average Precision
300
Number Relevant Retrieved
250
200 Max Min
150
Median Iowacuhk1 Iowacuhk2
100
50
0 1
2
Max
48
233
Min
2
0
3
4
Median
40
43
72
131
30
8
156
48
16
103
7
24
14
33
35
76
72
48
11
158
7
Iowacuhk1
43
123
68
145
36
12
135
49
26
101
9
24
15
28
30
31
60
53
13
198
9
Iowacuhk2
43
98
67
140
36
12
134
49
26
103
9
27
15
29
30
67
65
53
13
198
9
24
121 236 0
5
5
6
7
8
9
10
11
12
13
14
15
16
17
18
19
20
21
22
23
24
25
26
27
28
29
30
31
32
33
34
35
36
37
38
39
40
41
41
15
234
51
27
133
9
37
16
35
35
97
105
61
13
273
15
44
30
203
80
98
39
75
16
7
17
22
66
51
83
16
77
49
48
127
156 104
2
0
1
0
0
10
0
0
1
2
1
3
16
1
0
2
0
0
0
0
0
0
6
0
0
0
0
4
0
5
0
0
0
0
0
0
0
42
3
43
44
45
46
47
48
49
50
46
10
171
57
26
133
87
117
1
0
4
2
0
1
2
30
24
157
51
24
34
24
9
7
11
20
34
50
61
9
69
34
9
76
104
24
21
99
70
16
33
36
13
3
13
20
54
45
71
12
72
42
1
101
119
93
14
5
125
33
17
80
39
106
77
31
7
95
53
14
115
71
113
21
102
70
15
34
36
13
4
13
20
53
45
69
12
74
42
1
90
130
79
23
7
103
55
16
115
73
112
5
Topic
Figure 2: Adhoc Retrieval, # Relevant Retrieved in Top 1000 Documents disappointing, this performance sets an internal baseline against which we hope to show improvements in our future TREC efforts.
3 – Adaptive Filtering Track Our existing approach to Web search/filtering involves a dynamic clustering technique where the threshold for formation of new clusters and the threshold for visibility of ‘sufficiently important’ clusters can be specified by the
–2–
Cluster-Based Adaptive and Batch Filtering
100 90
Number Relevant Retrieved
80 70 Max
60
Min 50
Median Iowacuhk1
40
Iowacuhk2
30 20 10 0 1
2
3
4
5
6
7
8
9
10
11
12
13
14
15
16
17
18
19
20
21
22
23
24
25
26
27
28
29
30
31
32
33
34
35
36
37
38
39
40
41
42
43
44
45
46
47
48
49
50
Max
42
66
63
67
25
10
87
33
16
72
8
21
11
33
35
55
46
54
13
63
6
30
23
54
51
55
32
34
12
7
7
17
18
28
49
7
35
33
19
51
70
56
29
6
41
38
19
62
46
61
Min
1
0
0
0
1
0
0
0
0
4
0
0
0
0
0
2
0
0
0
0
0
0
0
0
0
0
0
0
0
0
0
1
0
0
0
0
0
0
0
0
0
2
0
0
2
0
0
0
0
2
Median
26
15
42
29
15
5
54
21
5
40
7
11
5
30
31
37
19
34
9
24
2
12
16
36
27
7
19
3
4
4
3
16
9
19
25
2
16
15
2
21
31
40
11
2
27
23
2
24
19
44
Iowacuhk1
35
48
33
36
22
8
53
27
16
31
7
9
6
23
25
18
24
43
9
55
4
17
16
40
33
8
22
5
7
2
2
15
11
24
28
4
35
25
0
41
46
41
9
2
34
38
6
53
28
57
Iowacuhk2
35
38
32
39
22
8
54
29
16
31
7
11
6
23
25
36
25
43
9
56
3
17
15
42
35
7
22
5
7
2
2
15
12
24
28
4
35
25
0
36
47
41
9
2
34
37
7
53
26
56
Topic
Figure 3: Adhoc Retrieval, # Relevant Retrieved in Top 100 Documents user when the topic is presented to the system. As documents are retrieved and clusters form, the user can select interesting clusters for further exploration through the links contained in member documents [7]. The TREC requirements for multi-query support and simulation of user judgment responses led us to modify the single set-ofclusters model, creating a two-level scheme. Similarity between documents and clusters is measured using a straight-forward vector cosine measure: Nd
Nc
∑ ∑
sim(d, c) =
( TF (W i) ⋅ TF (W j) ) i = 1j = 1 -------------------------------------------------------------------Nd Nc
∑ TF(W i) ⋅ ∑
i=1
TF (W i)
j=1
Term frequencies are built up incrementally as a given run progresses and cluster term weights are adjusted every ten input files. This approach is therefore somewhat inaccurate in the initial phases of a run, but quickly reaches a point of reasonable stability with respect to term frequencies and has the added benefit of requiring no fore-knowledge of the vocabulary. All vocabulary is stemmed using Porter’s algorithm [10]. We prune document term vectors to the 100 most weighty terms and cluster vectors to the 200 most weighty terms. This proves to have no significant effect on the accuracy of our results, but a significant effect on both memory requirements and execution time, the latter due to a corresponding reduction in the cost of dot product calculations. The primary cluster level corresponds to the internal representation of a topic definition. The original threshold specifications were retained here to allow specification of the first-order recall of the system. We experimented with a variety of means of generating a primary similarity measure, but settled on one based upon the text of the topic's concept definitions for the submitted runs. The secondary level is where the adaptive portion of the system functions and where we found the most benefit in parameter tuning. Each primary cluster (and hence, each topic) has a private set of zero or more secondary clusters. When a document clears the threshold for a primary cluster, it either joins an existing secondary cluster or forms a new one, based upon a membership threshold. The shift from a single membership threshold to a primary/secondary pair
–3–
Cluster-Based Adaptive and Batch Filtering
500
500
400
400
300
300
200
200
100
100
Score
Max
49
46
43
40
37
34
31
28
25
22
19
16
13
7
10
- 100
4
0 1
0
-1 0 0
Min Median Iowa Theoretical
- 200
-2 0 0
- 300
-3 0 0
- 400
-4 0 0
- 500
-5 0 0
Max Min Median Iowa
1 2 3 4 5 6 7 8 9 10 11 12 14 15 16 17 18 19 20 21 22 23 24 25 26 27 28 29 30 31 32 33 34 35 36 37 39 40 41 42 43 44 45 46 47 48 49 50 109 76 6 23 50 45 82 6 10 69 60 151 15 33 31 78 11 13 65 53 478 162 39 6 6 6 2 6 0 3 0 3 0 0 9 0 0 100 12 51 0 14 37 30 16 7 18 3 -112-119-663-110-256-554-268-505-200-109-201-175-316-341-249 -55 -960-189 -76 -21 -5 -67 -227-122 -56 -199-114-156-570 -45 -200-142-174 -38 -66 -906-114-200-198-478-247-124-199-288-325-670 -31 -246 3 9 8 1 5 0 0 0 5 -5 -14 -22 -23 -1 -18 -3 -24 -19 16 -10 22 -11 -13 -5 31 -13 -15 0 21 182 72 -7 -24 -2 -2 -24 -20 -20 -15 -16 -16 -22 -20 -24 -6 -34 0 -14 4 -12 -15 -4 -15 -13 -20 1 -4 -9 -16 -32 -119 -6 -78 -181 -24 -50 -11 -201 22 -31 -144 -24 37 -166 -90 7 36 42 21 -41 -28 -2 0
-2 -18 -4 0
Theoretical 366 780 180 90 84 213 348 84 84 255 375 540 129 177 84 267 186 177 141 63 118 231 333 69 21 21 21 12 0 5
3
-6 0
0
0
0
0
0 12 0
9
0
0
-2 -114 1 -44 -12 -40 -4 -48 -47 0
7
0
0 222 36 198 75 84 153 78 78 18 45 15
Topic
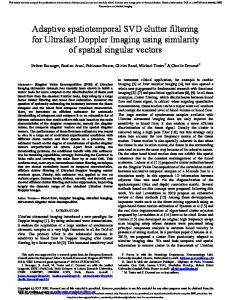
Figure 4: Adaptive Filtering, AP’88 F1 Results allowed us to achieve a tunable level of recall (by using a lower primary threshold, as mentioned above) while teasing out distinctions between candidate document clusters through use of a higher secondary threshold. Introduction of a visibility threshold for secondary cluster similarity to the primary then gives us a means for adaptation. When a secondary cluster's similarity first exceeds the visibility threshold, its member documents are declared to the user and relevance judgments are obtained. The secondary is then colored appropriately. Secondary clusters containing relevant (and unjudged, if any) documents are colored green and have all subsequent members declared as relevant. Secondaries containing non-relevant (and potentially, unjudged) documents are colored red and declare no further members. Adaptation then occurs over time as secondary clusters exceed the visibility threshold and are colored, with red secondary clusters mitigating the lack of precision provided by the recall-centric primary threshold. Secondary clusters exceeding the visibility threshold potentially contain a mix of different document types (relevant, non-relevant and unjudged). We currently address this in the following, conservative manner: if a secondary cluster contains • one or more relevant documents, no non-relevant documents and zero or more unjudged documents, color it green; • one or more non-relevant documents, no relevant documents and zero or more unjudged documents, color it red; • one or more relevant documents, one or more non-relevant documents and zero or more unjudged documents, color it gray, but treat it as green; • fewer than a specific number (currently 10) of unjudged documents and no relevant or non-relevant documents, leave it uncolored until the first relevant or non-relevant document is added, then color it appropriately (note that this optimistic stance has a distinct effect w.r.t. false positives); and finally, • more than a specific number of unjudged documents and no relevant or non-relevant documents, color it red (we do this pessimistically due to the low density of judged documents in the corpus). We selected a primary similarity threshold of 0.18, secondary similarity threshold of 0.5 and visibility threshold of 3 in our preliminary experiments with the Wall Street Journal corpus, but used a primary similarity threshold of 0.15, secondary similarity threshold of 0.4 and visibility threshold of 2 based upon an assumption that the WSJ corpus involved a more restricted vocabulary than the AP vocabulary. Figures 4, 5, and 6 show our results for AP88, AP89,
–4–
Cluster-Based Adaptive and Batch Filtering
500
500
400
400
300
300
200
200
100
100
Score
Max 0
0
-100
-100
-200
-200
-300
-300
-400
-400
Min Median Iowa Theoretical
-500
-500 1 2 3 4 87 3 26 8
Max Min Median
5 6 7 8 9 10 11 12 14 15 16 17 18 19 20 21 22 23 24 25 26 27 28 29 30 31 32 33 34 35 36 37 39 40 41 42 43 44 45 46 47 48 49 50 42 107 32 3 49 126 147 196 5 22 13 150 10 84 111 0 463 195 90 18 9 12 6 4 -6 0 9 9 0 3 3 19 0 77 18 0 24 82 0 29 4 2 17 0
-143-619-105-171-286-454-482-339-124-710-319-309-730-546-202 -28 -931 -97 -67 -46 -303 -2 -211 -30 -11 -27 -58 -56 -418 -38 -19 -82 -72 -58 -62 -279 -58 -529-136-424-593-256-324-106-298 -70 -114 -57 26 8 -2 -12 0 -12 10 0 0 -8 2 78 8 29 0 3 0 5 0 7 22 -4 128 78 1 -2 0 3 0 -12 -28 -8 0 2 -9 -1 -9 6 -6 0 -3 -14 0 0 -10 0 -3 -4 4 -2 -6 -34 -8 -195 -21 -84 -482 -23 25 26 -104 54 -126-173 -8 14 -110 -97 105 -5 113 78 -26 -25 -4
Iowa Theoretical
0
0 -10 -12 -10 -6 -10 0
405 390 285 84 75 387 258 72 144 336 522 804 144 123 183 318 108 432 189 6 157 339 339 69 69 15 75 9 2
0
0 12 30 3
0 -10 6
0 -50 -2 -35 -37 -78 -24 -57 -51 -4 -2
3
0 354 90 180 147 201 3 57 120 48 78 3
6 21
0
Topic
Figure 5: Adaptive Filtering, AP’89 F1 Results
500
500
400
400
300
300
200
200
100
100
Score
Max 0
0
- 100
-1 0 0
- 200
-2 0 0
- 300
-3 0 0
- 400
-4 0 0
- 500
-5 0 0
Min Median Iowa Theoretical
Max
1 2 3 4 5 6 7 8 64 0 10 30 22 47 25 0
9 10 11 12 14 15 16 17 18 19 20 21 22 23 24 25 26 27 28 29 30 31 32 33 34 35 36 37 39 40 41 42 43 44 45 46 47 48 49 50 5 83 46 123 2 0 7 23 0 18 78 16 230 59 5 6 10 3 1 0 0 0 0 0 3 0 6 0 7 0 0 0 9 15 0 25 11 0 14 0
Median
-280-255-926-144-285-700-470-204 -83 -762-708-342-621-588-130-110-466-287 -55 -26 -536 -10 -466 -25 -10 -26 -50 -54 -261 -34 -50 -160 -70 -42 -39 -106 -62 -910-251-684-539-366-192 -85 -245 -80 -92 -80 5 8 0 -2 0 3 0 1 -2 -2 -2 17 -2 0 0 -51 0 1 -2 -2 6 0 70 6 -2 -3 0 0 0 -2 -22 -10 0 -4 0 0 0 -2 0 -2 -1 -16 0 0 -2 3 0 -5 0 0
Iowa
-42 -3 -9 -122 -81 -23 -470 -30 -23 17 -247 27 2 -222 3
Min
0
0
0
0
0
0
0
Theoretical 261 207 195 108 45 210 327 42 93 204 384 528 75 21 159 87 96 198 144 18 957 141 228 57 93 24 102 0
4 -75 -181 30 -2 70 45 -26 -15 0
0
0
3
0
6
0
3
0 12 0 12 132 96 75 84 171 0 87 69 24 42 0
0
0
0
0
0
0
0
0
0
0
0
0
0
0
Topic
Figure 6: Adaptive Filtering, AP’90 F1 Results and AP90, respectively for the F1 measure. The vertical bars indicate the min, max and median scores for a given topic, the circles our score, and the diamonds the theoretically possible score. Table 2 shows the number of topics for which we score at or above the median for each of the three years. –5–
Cluster-Based Adaptive and Batch Filtering
Table 2: Adaptive Filtering Result Comparison Year
# of scores above median
AP88
23
AP89
15
AP90
31
200
0
F1 Score
-200
-400
15.4.2 preliminary 15.4.2 official 15.4.2 revised
-600
-800
-1000
-1200 1
2
3
4
5
6
7
8
9 10 11 12 13 14 15 16 17 18 19 20 21 22 23 24 25 26 27 28 29 30 31 32 33 34 35 36 37 38 39 40 41 42 43 44 45 46 47 48 49 50 Topic #
Figure 7: F1 Scoring Shifts Due to QRel Coverage
With a few notable exceptions (e.g., Topic 7), our approach scores very near the best performance recorded in the official runs. This includes the topics with extremely low density of relevant documents. Our performance in suppressing the negatively judged documents in topics 26-50 appears to train well in ‘88-’89, but at the cost of missing relevant documents in ‘90 in topics 40-50. This could well be an artifact of the trade-off between the number of secondary clusters formed and their resulting specificity. A smaller number of more general clusters suffers from lack of focus, but also declares fewer negatively judged documents in coloring a cluster. A larger number of more specific clusters improves cluster specificity, but can cause the declaration of a greater number of negatively judged documents as clusters corresponding to fine discriminations in concepts present in the corpus are colored. These effects will require substantially more experimentation. The points in time at which feedback occurs has significant effect upon the performance of the clustering algorithm. Figure 7 shows the results for our preliminary run (with original qrels for ‘88 and ‘89 only), the official run (with original qrels for all years) and a revised run (with revised qrels for all years). In virtually all topics the cumulative F1 score is higher for both the official runs and the revised qrel run over the preliminary run with qrels for only ‘88 and ‘89. Note however, that there are numerous cases where the official run outperforms the revised qrel run. We suspect that this is due to shifts in cluster declaration patterns across the changing qrel patterns. As an example of this, consider the pattern of black cluster declaration for Topic 5 as shown in Figures 8 and 9. As the preliminary run exhausts its qrels at snapshot 69 (the end of ‘89), no additional black clusters are declared until the end of ‘90. The revised run, with additional judgments for ‘90, continues to declare a substantial number of negative clusters, but at the same time, scores better than the preliminary run. The growth in the number of negative clusters is due to the relatively high density of negative judgements compared to positive judgements in ‘90. Figures 10 and 11 show a somewhat different situation for Topic 12. While the density of all judgements varies more substantially in ‘90, the number of both positive and negative clusters declared does not substantially differ from the preliminary run to the revised run. The cumulative F1 score, however, shows a distinct improvement, capitalizing on already declared clusters to suppress non-relevant documents and declare relevant documents. –6–
Cluster-Based Adaptive and Batch Filtering
50
30
+ judgement delta + match delta
count
10
- judgement delta F1 delta
-10
F1 cumulative -30
black clusters white clusters
-50
105
97
101
93
89
85
81
77
73
69
65
61
57
53
49
45
41
37
33
29
25
21
17
9
13
5
1
-70
Snapshot
Figure 8: Topic 5, Preliminary QRels
50 30 + judgement delta + match delta
103
97
91
85
79
73
67
61
55
49
43
37
31
25
19
13
7
- judgement delta
-10
1
count
10
F1 delta F1 cumulative
-30
black clusters white clusters
-50 -70 Snapshot
Figure 9: Topic 5, Revised QRels
4 – Batch Filtering Track For this subtrack we decided to use Rocchio's query expansion method to build an initial profile for each topic, and then let the adaptive system learn on the training before processing the test set. The following steps describe our methodology: 1. Index the training set (AP88, topics, and relevance judgments of AP88) using SMART. We used the pivoted normalization weighting scheme (Lnu.ltu), stop words, and no stemming. 2. Expand the topics using relevance feedback on the training dataset. For this, the initial retrieval run extracted the top 100 documents. Rocchio's method was used with parameters alpha=8, beta=8, and gamma=8. The top 200 terms were used for expansion. These expanded topics were input to the TRECcer program in step 3. 3. Run the TRECcer program. Originally we intended to generate IDF statistics on all the AP88 train set for the TRECcer program. However, due to lack of time we selected a subset of files and used only those files for IDF statistics and initial cluster formation with the TRECcer. For each topic, the first file in the training collection that
–7–
Cluster-Based Adaptive and Batch Filtering
50
30
+ judgement delta + match delta 10 count
- judgement delta F1 delta -10
F1 cumulative black clusters -30
white clusters -50
105
97
101
93
89
85
81
77
73
69
65
61
57
53
49
45
41
37
33
29
25
21
17
9
13
5
1
-70
Snapshot
Figure 10: Topic 12, Preliminary QRels
50 30 + judgement delta + match delta
103
97
91
85
79
73
67
61
55
49
43
37
31
25
19
13
-10
7
- judgement delta
1
count
10
F1 delta F1 cumulative
-30
black clusters white clusters
-50 -70 Snapshot
Figure 11: Topic 12, Revised QRels contains a relevant document was identified. This procedure generated a subset of 26 files. The parameters used in the batch filtering TRECcer runs were tuned using the training set AP88. We obtained the following settings: • F1 run (shown in Figure 12): primary cluster membership= 0.25, secondary membership threshold= 0.5, visibility threshold = 0.25. • F3 run (shown in Figure 13): primary cluster membership= 0.2, secondary membership threshold= 0.5, visibility threshold = 0.25. We ran the TRECcer program on 20 machines (a mix of HP and SGI workstations), assigning 5 topics to each. 4.1 – Results Unfortunately, the official results included partial results for many of the queries (only queries 36-50 for the F1 run had been completed). We did complete the runs later using the entire AP88 subset for training the system before starting to process the test set (AP89-90).
–8–
Cluster-Based Adaptive and Batch Filtering
800
600
400
200
0 F1
Max Min
-200
Median IAHKbf11
-400
-600
-800
-1000
49
47
45
43
41
39
37
35
33
31
29
27
25
23
21
19
17
15
13
9
11
7
5
3
1
-1200 Topic
Figure 12: Batch Filtering, F1 Results 2000
1500
F3 Score
1000
Max
500
Min Median IAHKbf32
0
final run
-500
-1000
49
47
45
43
41
39
37
35
33
31
29
27
25
23
21
19
17
15
13
9
11
7
5
3
1
-1500 Topic
Figure 13: Batch Filtering, F3 Results Table 3 summarizes the results of our F1 runs. In the official run 17 of the topics were above or equal to the median(12 of them the maximum), while in the unofficial but complete run this improved to 23 (13 of the maximum). Table 3: Performance of the Batch Filtering Runs >= Median
Maximum in
F1 (official)
17
12
F1 (complete)
22
13
F3 (official)
12
7
F3 (complete)
23
7
–9–
Cluster-Based Adaptive and Batch Filtering
In the official F3 runs 12 of the topics were above the median (7 of them the maximum), whereas in the unofficial run 23 topics were above the median (7 of the maximum). The results obtained in our F3 runs indicate that the unofficial run significantly outperforms our official run. This improvement is justified in part by the fact that the unofficial runs include more declared documents that eventually will increase the chance of retrieving relevant documents. In the case of the F1 runs the unofficial run is better but the improvement is smaller. We attribute this to the fact that our official F1 run already had 15 completed topics. There is also a difference in the training examples used. The Official run uses a subset of 26 files, while the unofficial run uses the entire training set. We compared the results obtained in the subset of queries 36-40. In the official run 10 of these topics are above the median (6 at the maximum), while in the unofficial run 12 of the topics are above the median (8 at the maximum). We also observe that there are differences in the number of declarations – 7 topics increase the number of declarations while 2 decrease. This is because a different training set induces a different secondary cluster structure.
5 – Conclusions and Future Plans Our preliminary experience with two-level clustering and a mixed architecture of TRECcer and SMART have been encouraging. We expect that with further tuning of primary/secondary cluster interaction we will achieve significantly better results. Our performance on the Wall Street Journal corpus during our earlier experiments with clustering lead us to believe that similarity thresholds are sensitive to vocabulary diversity, particularly compared to the more diverse vocabulary of the AP corpus. We are quite interested in exploring a blend of lower primary thresholds and higher secondary thresholds. This should improve our recall, but only at the cost of early training of negative examples.
6 – References [1] [2]
[3] [4]
[5] [6] [7]
[8] [9] [10] [11] [12]
Baclace, P. E., “Competitive Agents for Information Filtering,” Communications of the ACM, v. 35, n. 12, December 1992, p. 50. Buckley, C., M. Mitra, J. Walz, and C. Cardie, “Using Clustering and SuperConcepts within SMART,” Proc. of Sixth Text REtrieval Conference (TREC-6), Gaithersburg, Maryland, November 19-21, 1997. http:// trec.nist.gov/pubs/trec6/papers/index.track.html Cutting, D. R., D R. Karger and J. O. Pedersen, “Constant interaction-time scatter/gather browsing of very large document collections,” Proc. of SIGIR’93, June 1993. Cutting, D., D. Karger, J. Pedersen, and J. W. Tukey, “Scatter/Gather: A Cluster-based Approach to Browsing Large Document Collections,” Proceedings of the 15th Annual International ACM/SIGIR Conference, Copenhagen, 1992. Eichmann, D. “The RBSE Spider – Balancing Effective Search Against Web Load,” First International Conference on the World Wide Web, Geneva, Switzerland, May 25-27, 1994, pages 113-120. Eichmann, D., “Search and Metasearch on a Diverse Web,” First W3C Workshop on Distributed Indexing and Search, Boston, MA, May 28-29, 1996. Eichmann, D., “Ontology-Based Information Fusion,” Workshop on Real-Time Intelligent User Interfaces for Decision Support and Information Visualization, 1998 International Conference on Intelligent User Interfaces, San Francisco, CA, January 6-9, 1998. Lieberman, H., “Letizia: An Agent That Assists Web Browsing,” Proceedings of the International Joint Conference on Artificial Intelligence, Montreal, August 1995. Lieberman, H., “Autonomous Interface Agents,” Proceedings of the ACM Conference on Computers and Human Interfaces (CHI’97), Atlanta, GA, March 1997. Porter, M. F., “An Algorithm for Suffix Stripping,” Program, v. 14, no. 3, 1980, p. 130-137. Rocchio, J., “Relevance feedback in information retrieval,” in The SMART Retrieval System: Experiments in Automatic Document Processing, G. Salton (ed.), Prentice-Hall, p. 313-323. Singhal, A, G. Salton, M. Mitra and C. Buckley, “Document Length Normalization,” Information Processing & Management, v. 32, no. 5, Sept. 1996, p. 619-633.
– 10 –