Cluster versus grid for large-volume hyperspectral image preprocessing Jason Brazilea , Michael E. Schaepmanb , Daniel Schl¨apfera , Johannes W. Kaisera , Jens Niekea , and Klaus I. Ittena a
Remote Sensing Laboratories, Dept. of Geography, University of Zurich, Winterthurerstrasse 190, CH-8057 Zurich, Switzerland b Centre for Geo-Information, Geo-Information and Remote Sensing, Wageningen University, Droevendaalsesteeg 3, 6708 PB Wageningen, Netherlands ABSTRACT The handling of satellite or airborne earth observation data for scientific applications minimally requires pre-processing to convert raw digital numbers into scientific units. However depending on sensor characteristics and architecture, additional work may be needed to achieve spatial and/or spectral uniformity. Standard higher level processing also typically involves providing orthorectification and atmospheric correction. Fortunately some of the computational tasks required to perform radiometric and geometric calibration can be decomposed into highly independent subtasks making this processing highly parallelizable. Such “embarrassingly parallel” problems provide the luxury of being able to choose between cluster or grid based solutions to perform these functions. Perhaps the most convenient solutions are grid-based, since most research groups making these kinds of measurements are likely to have access to a LAN whose spare computing resources could be non-obtrusively employed in a grid. However, since many higher level scientific applications of earth observation data might be composed of more highly interdependent subtasks, the parallel computing resources allocated for these tasks might also be made available for low level pre-processing as well. We look at two modules developed for our prototype data calibration processor for APEX, an airborne imaging spectrometer, which have been implemented on both a cluster and a grid leading us to be able to make observations and comparisons of the two approaches. Keywords: hyperspectral, cluster, grid, MODTRAN, APEX
1. INTRODUCTION The Airborne Prism EXperiment (APEX) is currently being built as a demonstrator and calibrator for potential future European spaceborne imaging spectrometers.1 In addition to supplying well-calibrated imaging spectroscopy data for use in earth observation applications, the APEX project also supports development of new processing algorithms and techniques. One desirable technique to investigate is the possibility of the distribution of large volume computation to multiple compute nodes in a way that can be integrated into a standard product operational framework. While processor speed and input/output capacity are growing at an impressive rate, processing algorithms are becoming increasingly more computationally intensive. A historical view of processing times for a typical airborne imaging spectrometer data acquisition is shown in Table 1. We believe the trend will continue in the diction of more complex computation in standard product generation. Therefore, we start to look at particular pieces in a standard production chain that can already easily themselves to a distributed computing solution. Send correspondence to
[email protected]
48
Atmospheric and Environmental Remote Sensing Data Processing and Utilization: an End-toEnd System Perspective, edited by H.-L. A. Huang, H. J. Bloom, Proc. of SPIE Vol. 5548 (SPIE, Bellingham, WA, 2004) · 0277-786X/04/$15 · doi: 10.1117/12.559849
Table 1. Downward trends in operating times vs. upward trends in processing complexity Year
Download/Archive
Product Generation
Module
Per Scene Per CPU
19872
9 working days
60 working days
Parametric orthorectification
1-2 days
19923
5 working days
5-10 working days
Atmospheric LUT generation
1-2 days
19964
3-4 working days
5-7 working days
Feature based calibration
1-2 day
Spatial/Spectral uniformity
1 day
1998
2 working days
(a) Published AVIRIS “full flight tape” processing times
(b) Estimated time for selected APEX modules
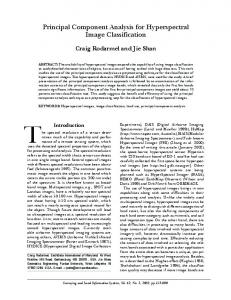
2. PROCESSING MODULE CANDIDATES A high level overview (up to level 2) of the data processing chain being developed for the APEX processing and archiving facility is shown in Figure 1. Raw data files are provided on tape (or alternatively transferred from the acquisition computer via gigabit ethernet) and combined with data obtained from the calibration home base, a level 0 product is produced consisting primarily of segregated image cube scenes and laboratory-based calibration parameters. Minimally, these level 0 products are used by the APEX PAF to produce radiometrically calibrated (but not spatially/spectrally uniform) level 1A at-sensor radiance. When spatially/spectrally uniform level 1 data is desired (at the expense of resolution lost due to re-sampling), uniform level 1C data can also be produced. An optional, work-in-progress processing path involves automatic detection of anomalies such as smile/frown5 and keystone6 derived from the spectral measurements themselves rather than from laboratory calibration data. This requires the generation of a large lookup table (LUT) used for analysis of Fraunhofer lines and atmospheric absorption features7 as an additional high resolution data calibration source. Raw Data
Level 0
Level 1
Level 2
1A
Per Frame positional maps
Positional
Image
Acq Meta
Segregation & quality flagging
11111 00000 00000 11111 00000 11111 00000 11111 calibration parameter generation
Scenes
Lab Calibration Parameters
Sensor
lookup table generation
Lab
LUT
radiometric calibration w/o re−sampling
smile/frown & keystone detection
1111 0000 0000 1111 0000 1111 complete uniformity w/re−sampling
Non−uniform at sensor Radiance
2A Atmospheric correction & orthorectification
Surface Reflectance
Smile/Frown maps
other anomaly mappings 2C
1C
Spectrally & Spatially Uniform
Atmospheric correction & orthorectification
Surface Reflectance
Figure 1. Simplified overview of the APEX airborne pushbroom imaging spectrometer data processing chain and 2 specific modules addressed in this work.
Proc. of SPIE Vol. 5548
49
2.1. Atmospheric Lookup Table Generation The use of a lookup table has long been used to ease the computational requirements of retrieving surface reflectance from airborne and spaceborne hyperspectral data. Common dimensions of such a table consist of attributes such as wavelength, pixel position, atmospheric water vapor content, aerosol optical depth, and terrain elevation.8 A parametric fit of table entries can be used instead of running jobs on a per pixel basis and yet remain within respectable margins of error. Since the work for generating this table is already done for level 2 atmospheric processing, it was determined that the same work can be used to provide an alternative high resolution source of calibration data based on known atmospheric features and Fraunhofer lines. One such use of this data is detection of spectral line curvature.5 A typical lookup table generated for this use might involve generating entries that vary water vapor values over a range suitable for the given scene. One such table as generated by the ISDAS9 image analysis system involves hundreds of calls to a radiative transfer program such as MODTRAN. In operation, this stage of processing typically requires 2-3 working days and was therefore chosen as a candidate for speedup via distributed computing.
2.2. Radiometric Processing The current scheme for generating the APEX radiance data product involves radiometric data calibration as well as an optional step for assuring spatial and spectral uniformity. Since APEX provides programmable spectral binning, an initial step of un-binning must also be performed. This leads to the following processing sequence10 : • Undo binning • Correct the readout smear effect of the VNIR detector • Correct for dark current • Invert pixel response to physical units • Replace bad pixels • Correct straylight and optionally, ghost images • Optionally correct spectral and spatial non-uniformity • Redo binning The uniformity of pushbroom imaging spectrometers is affected by spectral and spatial misregistration within each detector array as well as by coregistration between the VNIR and SWIR spectral range. Since the correction of this non-uniformity involves interpolation/re-sampling, the resulting reduction in resolution suggests that correction may be undesirable in certain situations. Therefore two possibilities for APEX level 1 products have been defined as shown in 1. In the 1C product where full uniformity is desired, preliminary analysis shows that uniformity processing is another suitable candidate for a distributed solution since the current code is decomposable into independent frame-by-frame subtasks.
3. PARALLELIZABILITY ANALYSIS When analyzing a problem for discovery of potential parallelizability, there are a few standard characteristics that can measured which can give some idea of parallel computation potential. Two such characteristics are examined below.
50
Proc. of SPIE Vol. 5548
36782 36782 36782 36782 ... 36782 36782 36782 36782 36782 36782 36782 36782 36782 36782 36782 36782 36782 36782 36782 36782 36782 36782 36782 36782 36782 36782 36782 36782 36782 ... 36782 36782 36782 36782 36782 36782 36782 36782 36782
ktrace RET ktrace 0 ktrace CALL execve(0xbfbffb0f,0xbfbffa18,0xbfbffa20) ktrace NAMI "../bin/modtran" modtran RET execve 0 modtran modtran modtran modtran modtran modtran modtran modtran modtran modtran modtran modtran modtran modtran modtran modtran modtran modtran modtran modtran modtran modtran modtran modtran modtran
CALL RET CALL RET CALL RET CALL RET CALL RET CALL RET CALL NAMI RET CALL NAMI RET CALL NAMI RET CALL NAMI RET CALL
fstat(0x2,0xbfbff910) fstat 0 ioctl(0x2,TIOCGETA,0xbfbff8b4) ioctl 0 fstat(0,0xbfbff900) fstat 0 ioctl(0,TIOCGETA,0xbfbff8a4) ioctl 0 fstat(0x1,0xbfbff910) fstat 0 ioctl(0x1,TIOCGETA,0xbfbff8b4) ioctl 0 stat(0xbfbfd9d0,0xbfbfd920) "modroot.in" stat -1 errno 2 No such file or directory stat(0xbfbfd9d0,0xbfbfd920) "MODROOT.IN" stat -1 errno 2 No such file or directory stat(0xbfbfd980,0xbfbfd8d0) "tape5" stat 0 access(0xbfbfd980,0) "tape5" access 0 readlink(0x80e91b4,0xbfbfd8d0,0x3f)
modtran modtran modtran modtran modtran modtran modtran modtran modtran
CALL NAMI RET CALL RET CALL NAMI RET CALL
open(0xbfbfd980,0x2,0x1b6) "tape5" open 3 fstat(0x3,0xbfbfd8e0) fstat 0 stat(0xbfbfd980,0xbfbfd8d0) "tape5" stat 0 fstat(0x3,0xbfbfd8d0)
(a) Output of system call trace for modtran process
... enum iosyscalls {_OPEN, _CLOSE, _FSTAT, _LSEEK, _ACCESS, _STAT, _READ, _WRITE}; ... #define _LSEEKSIZE 5 ... int ops[] = { _FSTAT,2,0x0, /* "stderr" */ _FSTAT,0,0x0, /* "stdin" */ _FSTAT,1,0x0, /* "stdout" */ _STAT,(int) "modroot.in",2, _STAT,(int) "MODROOT.IN",2, _STAT,(int) "tape5",0x0, _ACCESS,(int) "tape5",0,0x0, _OPEN,(int) "tape5",0x2,0666,0x4, _FSTAT,4,0x0, /* "tape5" */ _STAT,(int) "tape5",0x0, _FSTAT,4,0x0, /* "tape5" */ _LSEEK,4,0x0,0,0x0, /* "tape5" */ _OPEN,(int) "tape6",0x2,0666,2, ... }; int main(void) { int i, size = sizeof(ops) / sizeof(int); for(i=0; i