Clustering algorithm based on molecular dynamics with Nose-Hoover thermostat. Application to Japanese candlesticks. Leszek J Chmielewski, Maciej Janowicz ...
FULL-LENGTH REPRINT – differs from the original in layout but not in contents Chmielewski L., Janowicz M., Orlowski A., Clustering algorithm based on molecular dynamics with Nose-Hoover thermostat. Application to Japanese candlesticks. In L. Rutkowski et al., eds., Artificial Intelligence and Soft Computing: Proc. ICAISC 2015, Part II, Zakopane, Poland, 14-18 June 2015. vol. 9120 of Lecture Notes in Artificial Intelligence, pages 330-340. The copyright owner of the paper is Springer. The final publication is available at SpringerLink
via doi:10.1007/978-3-319-19369-4 30
Clustering algorithm based on molecular dynamics with Nose-Hoover thermostat. Application to Japanese candlesticks Leszek J Chmielewski, Maciej Janowicz, and Arkadiusz Orlowski Faculty of Applied Informatics and Mathematics (WZIM), Warsaw University of Life Sciences (SGGW), ul. Nowoursynowska 159, 02-775 Warsaw, Poland {leszek_chmielewski,maciej_janowicz,arkadiusz_orlowski}@sggw.pl
http://www.wzim.sggw.pl Abstract. A hybrid pattern clustering algorithm connecting Particle Swarm Optimization with Simulated Annealing is proposed. The swarm particles are directly associated with the centroids of each cluster. They are assumed to move in the phase space associated under the influence of a potential generated by each pattern to be partitioned and interacting with each other. Thus, the problem of partitioning acquires a direct physical interpretation. The motion of swarm particles is simulated with the help of a thermal bath represented by one additional dynamical variable within the Nose-Hoover formalism. The temperature is decreased at each step in the dynamics of the swarm providing the resemblance to the Simulated Annealing. Clustering of the Japanese candlesticks which appear in the dynamics of assets in the Warsaw stock market is used as an example. Keywords: clustering, molecular dynamics, Japanese candlesticks
1
Introduction
Clustering denotes the partitioning of a set of data into groups of similar objects. Each group, called a cluster, consists of objects that are similar between themselves and dissimilar to objects of other groups. In the past few decades, cluster analysis has played an important role in a broad range of scientific disciplines including engineering, computer science, life and medical sciences, social sciences, and economics, as documented, e.g., in [1,2,3,4,5,6]. Even though human brains are well-known to have excellent abilities in clustering of various types of objects, this becomes rather problematic if the data set to be partitioned is large and the number of features according to which the cluster analysis has to be performed is larger than, say, three. Under such circumstances, the use of computers with implementation of some efficient algorithms appears to be necessary. As a matter of fact, the task of computerized data clustering has been approached from diverse domains of knowledge like graph c Springer International Publishing Switzerland 2015
L. Rutkowski et al. (Eds.): ICAISC 2015, Part II, LNAI 9120, pp. 330-340, 2015. DOI: 10.1007/978-3-319-19369-4 30
.
Clustering algorithm based on molecular dynamics. . .
331
theory, statistical multivariate analysis, artificial neural networks, fuzzy set theory, etc. [7,8,9,10,11,12,13,14,15,16,17]. One of the most popular approaches in this direction has been the formulation of clustering as an optimization problem. That is, the best partitioning of a given dataset is obtained by minimizing or maximizing one or more objective functions. As a result, a variety of methods and techniques known from the optimization domain can be applied to the partitioning problem provided that a useful objective function to be optimized is found. Among the efficient optimization methods the so-called swarm intelligence algorithms have recently attracted considerable attention. Two examples of particularly successful research directions in swarm intelligence are Ant Colony Optimization (ACO) [18,19] and Particle Swarm Optimization (PSO) [20]. In the context of cluster analysis, the PSO-based method was first introduced by Omran, Salman, and Engelbrecht in [21]. The results of Omran et al. [21,22] suggest that PSO-based method can outperform k-means, fuzzy c-means (FCM), and a few other state-of-the-art clustering algorithms. A very useful survey of the application of PSO to the cluster analysis has been given (together with original results) in [23]. In this work we attempt to develop a clustering algorithm which is very much in the spirit of PSO, but still similar to the Simulated Annealing techniques in that the concept of temperature and its lowering during simulation is introduced. The swarm particles are to represent the centroids of each cluster. Each particle is subject to a force field generated by objects which should be partitioned. In addition, the particles repel each other. Since the particles should visit a sufficiently large subset of the configuration space, their interaction with a thermal bath is introduced. This bath, however, is modelled deterministically with the help of an additional dynamical variable as described by Nose [24] and Hoover [25]. We have found that a related approach to the optimization problems has been developed earlier by Fukuda [26], who, however, has used temperature-dependent potential function and sampling under finite temperature rather than annealing. Our simulations have one feature very unusual from the point of view of PSO: the elements of the swarm are single particles rather than the whole bunch of particles. The only reason for that is our wish to make the simulations very similar to the standard molecular dynamics ones. As a non-trivial application of our PSO-like procedure, we have chosen clustering of the Japanese candlesticks having in mind their possible use in the field of technical analysis of assets in the stock market. It is often claimed by the technical analysts (see, e.g., [27]) that some particular sequences of candlesticks with a given shape (which is obviously a fuzzy concept) can be used to predict, e.g., the breaking or continuation of a trend. Now, clusterization of candlesticks for a given asset allows one to ascribe labels to candlesticks. This, in turn, makes it possible to investigate how their sequences with given labels have performed in the past and what is the predictive power (if any) of sequences with particular labels.
332
L. Chmielewski, M. Janowicz, A. Orlowski
The main body of this work is organized as follows. In Section 2 we recall the definition of the Japanese candlesticks which form our working example. In Section 3 we present our hybrid algorithm in some detail. Section 4 contains the results of our variant of PSO simulation. Finally, Section 5 comprises some concluding remarks.
2
Japanese candlesticks as a representation of value of assets in stock market
The Japanese candlestick is a sequence of four numbers (O(a, t), X(a, t), N (a, t), C(a, t)), where O denotes the opening value of the asset a at the trading day t, X is the maximum value (high) reached during the trading session, N is the minimum (low), and C is the closing value. There exist a well-known graphical representation of the candlestick [28] often considered important in the so-called technical analysis of stock markets. In what follows below we employ a sequence of five elements (O, X, N, C, V ) which we call an augmented Japanese candlestick where V represents the transaction volume associated with the asset and the trading day. An augmented candlestick of the asset a on the day t can be denoted as a 5-tuple y(a; t) = (O(a, t), X(a, t), N (a, t), C(a, t), V (a, t)) .
(1)
In the following we shall call it simply a candlestick. The time series of n + 1 candlesticks, called otherwise a sequence, can be written down as Sn (a; t) = (y(a; t), y(a; t + 1), ..., y(a; t + n)) . Each sequence has its own starting time t and ending time t + n. We define the (non-Euclidean) distance between two candlesticks as X 2 d(y1 , y2 ) = 1 − exp − (A1 − A2 ) /(2b) ,
(2)
(3)
A1 ,A2
where A1 and A2 are corresponding components of y1 and y2 respectively, i.e., they run through the elements of appropriate sets {O, X, N, C, V }, and b is a constant. In order to consider this formula meaningful, the values of the asset and the transaction volume must be comparable. To achieve this, we normalize all time series by subtracting the closing values from the opening ones as well as from the maxima and minima, and dividing O, X, N , and C by the standard deviation of C. Similarly, the volume is also divided by its standard deviation. This way, the standard deviations of renormalized C and V are exactly 1. All candlesticks analysed further are normalized in the above sense. The reason for introduction of the above non-Euclidean metric is that in the following we use the notion of potential energy, and we want that potential energy to be expressed simply as a sum of the distances (up to an additive
Clustering algorithm based on molecular dynamics. . .
333
constant). Such a formulation allows one to keep the physical analogy of the cluster centroids as “particles” and the vectors to be clusterized as “centers of potential”. Indeed, the potential energy should become zero or a constant in the worst case when the “particle” is very far away from the “centers of potential”. There would be, of course, nothing wrong in writing the potential energy as a more complicated function of Euclidean distances.
3
Molecular Dynamics-based variant of the Particle Swarm Optimization
Let us denote by yn , n = 1, 2, ..., N the objects to be partitioned into the clusters. Each object possesses a number of features; it is assumed that the features can be quantified and labelled with the help of a real number. All objects are assumed to have the same number d of the features. Thus, the whole dataset is characterized by N · d real numbers. Let us assume that we need to partition the data into Lk number of clusters. For a time being we assume that Lk is fixed (specified by the user of the algorithm). The goal is to partition the N objects in such a way that the following requirements are met: – The distance between the objects and their centroid within the cluster is minimized. This can accomplished by requirement that a centroid is attracted by the objects to which it is similar while its interaction with dissimilar objects is negligible. – The distance between different clusters (represented by their centroids) is maximized. This can result from the requirement that the centroids repel each other. From these requirements it follows that we have to optimize the following function (cf. [21]): f (X, Y ) ≡ UY (X) = w1 U1 + w2 U2 ,
(4)
where U1 =
Lk X X
d(yni , xi ) ,
(5)
d(xi , xj ) .
(6)
i=1 ni ∈Ci
U2 = Z −
Lk X i,j=1
In the above equations the centroids are represented with the help of d-dimensional vectors xi , i = 1, 2, ..., Lk ; X denotes the whole set of those vectors, Y denotes the set of vectors representing the to-be-partitioned objects, and Z is a constant chosen such to make U2 non-negative. The symbold Ci represents the ith cluster and ni enumerates the vectors belonging to that cluster. The parameters w1 and w2 are relative weights assigned to the attraction of centroids to the candles (i.e.
334
L. Chmielewski, M. Janowicz, A. Orlowski
sources of potential) vs. repulsion among the centroids themselves. The skillfull choice of these weights can sometimes lead to the improvement of the results of optimization. However, in our simulations we have not seen any particular influence of those weights (unless one of them has been very close to zero). The fitness function f (X, Y ) defines a multi-objective optimization problem, which minimizes the intra-cluster distances and maximizes inter-cluster separation. In order to solve the above optimization problem, we propose to apply the following dynamical scheme. Let the centroids be represented with the help of both xi (called coordinates of the centroids) and associated momenta pi , i = 1, 2, ..., Lk . The coordinates and momenta exhibit dynamics in continuous pseudo-time τ generated by the Hamiltonian: H=
Lk X Ps2 p2i + U (X) + + gkB T ln(s) , Y 2ms2 2M i=1
(7)
where g is a constant which may be the number of independent momentum degrees of freedom of the system (Lk in our case), kB is a constant that is an analog of the Boltzmann constant, T is the temperature, s is an additional dynamical variable to represent the influence of the thermal bath on the system of centroids, Ps is the associated momentum, and m and M are constants (called “masses”). Let us notice here that all the quantities which appear in the Hamiltonian above are dimensionless, and that the product gkB can be included into the dimensionless temperature. The time evolution of the above variables is given by the Hamilton equations of motion: ∂H d xi = , dτ ∂pi
(8)
∂H d pi = − , dτ ∂xi
(9)
∂H d s= , dτ ∂Ps
(10)
d ∂H Ps = − . dτ ∂s Let us now define the velocities vi and Vs as: vi =
pi , ms2
Ps . M Then the Hamilton equations take the form: Vs =
d xi = vi , dτ
(11)
(12)
(13)
(14)
Clustering algorithm based on molecular dynamics. . .
335
d 1 ∂UY 2vi Vs vi = − 2 − , dτ ms ∂xi s
(15)
d s = Vs , dτ
(16)
ms X 2 gkB T d Vs = v + . dτ M i i Ms
(17)
The temperature measures the mean kinetic energy of the system (given by the second term in the Hamiltonian). If the temperature approaches zero, the dynamics of the system variables gradually becomes frozen, and the coordinates of the centroids approach a minimum of the potential function UY . Obviously, this characteristic of the algorithm resembles the Simulated Annealing (SA). It is to be noted, however, that there are significant conceptual differences since SA is clearly associated with Monte Carlo simulations and no time is involved. Here, it is the Molecular Dynamics which is at the root of the algorithm, and time (or pseudo-time) evolution is essential. Needless to say, there is no guarantee that that minimum is global. However, since the system can be kicked off by thermal fluctuations from a shallow local minimum, one might hope that at least a deep local minimum is achieved as the temperature goes to zero. Let us notice that the specific values of g and kB are irrelevant here as the temperature enters the dynamics only via the product gkB T so that we always deal with a scaled temperature. There are at least two very difficult questions related to the above procedure. Firstly, one has to specify the parameters wi of the potential function UY , the masses m and M (more precisely, only their ratio m/M is important), and the parameter b. The second question is what is the best starting temperature and how it should be made lower. We are at the moment not able to offer any recommendation except of the trail-and-error procedure which has been used by us in this work. Let us also briefly mention the problem of choice of the number of clusters Lk . Actually, every reasonable clustering analysis method should provide some means to find the proper Lk . Here, we propose the following “soft” rule to obtain Lk . One has to start with a quite large number and look whether the centroids tend to coalesce as the pseudo-time grows and the temperature is lower. If the final distance between two or more centroids is smaller than some prescribed value (being, for instance, a fraction of the maximal distance between the objects), one should launch a new simulation with a smaller value of Lk .
4
Clustering of candlesticks: results
To illustrate our clustering algorithm, we have used the augmented Japanese candlesticks as they arise in the dynamics of the stocks registered in Warsaw stock market (GPW). Thus, the set of objects which is to be partitioned is the
336
L. Chmielewski, M. Janowicz, A. Orlowski
set of vectors representing the candlesticks, and each vector has five components. To evolve the system in time, a modified version of the velocity Verlet algorithm [29,30] has been used. Given that we know the coordinates and velocities x and v at the pseudo-time τ , they can be computed at the time τ + ∆t in the following steps: 1. Using xi (τ ), the forces Fi (τ ) have to be computed as Fi (τ ) = −
1 ∂UY . s2 ∂xi
(18)
Also, the force Fs is computed according to: Fs (τ ) = ms
X i
vi2 +
gkB T . s
(19)
Then, the accelerations ai (τ ) are obtained as Fi (τ )/m and as (τ ) = Fs (τ )/M . New coordinates are then computed from the equations: 1 ai (τ ) ∆t2 , 2 1 s(τ + ∆t) = s(τ ) + Vs (τ ) ∆t + as (τ ) ∆t2 . 2
xi (τ + ∆t) = xi (τ ) + vi (τ ) ∆t +
(20) (21)
2. Using xi (τ + ∆t) and s(τ + ∆t) we get new forces Fi (τ + ∆t) and Fs (τ + ∆τ ) as well as new accelerations ai (τ + ∆t) = Fi (τ + ∆t)/m and as (τ + ∆τ ) = Fs (τ + ∆τ )/M . 3. New velocities are obtained according to the formulas: 1 (ai (τ ) + ai (τ + ∆t)) ∆t , 2 1 Vs (τ + ∆t) = Vs (τ ) + (as (τ ) + as (τ + ∆t)) ∆t . 2 vi (τ + ∆t) = vi (τ ) +
(22) (23)
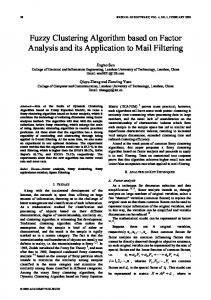
4. Finally, all the velocities vi are multiplied by the factor exp(−2Vs ∆t/s). We have performed simulations with the following parameters: b = 5, w1 = w2 = 1/2, initial temperature gkB T = 100. The mass M has been equal to 1000, the mass m to 1. The change of temperature T has been linear. At each time step T has been decreased by 0.01. The time step ∆t has been equal to 0.01. The data set consists of 5095 candlesticks associated with the BZWBK stocks of GPW. In Fig. 1 we show the convergence of the single centroid parameters and potential function in pseudo-time τ . Fig. 2 illustrates the convergence of parameters and potential function in the case of two centroids in pseudo-time τ . It is clear that the convergence has been rather slow, and the presence of fluctuations in pseudo-time is obvious. This probably means that our choice of parameters has not been optimal. However, we have not had any issues with
Clustering algorithm based on molecular dynamics. . .
337
1.5
1
Parameters for single centroid
0.5
0
-0.5
-1
-1.5
a
-2
-2.5 0
500
1000
1500
2000
2500
τ
16000
Potential function for single centroid
14000
b
12000
10000
8000
6000
4000
2000 0
500
1000
1500
2000
2500
τ
Fig. 1. Evolution of (a) parameters and (b) potential function of a single centroid in pseudo-time τ . (a) the solid line: x1 (1), dashed line: x1 (2), dot-dashed line: x1 (3), dotted line: x1 (4); (b) the solid line: U(X)
convergence itself but only with its ratio. Let us notice here that the optimization problem for five or ten degrees of freedom under very complicated (multi-center) potential landscape is by no means trivial (for any method). Our procedure works reasonably well and offers a useful alternative to other well-known approaches.
5
Concluding remarks
In this work we have proposed a hybrid deterministic optimization algorithm based on Particle Swarm Optimization combined with ideas from Molecular Dynamics simulations using the Nose-Hoover model of the thermostat. That algorithm has been applied for the purposes of clustering of Japanese candlesticks
338
L. Chmielewski, M. Janowicz, A. Orlowski
1.8 1.6
Parameters for two centroids
1.4 1.2 1 0.8 0.6 0.4 0.2
a
0 -0.2 0
2000
4000
6000
8000
10000 τ
12000
14000
16000
18000
20000
18000
20000
14000
Potential function for two centroids
12000
b
10000
8000
6000
4000
2000
0 0
2000
4000
6000
8000
10000 τ
12000
14000
16000
Fig. 2. Evolution of (a) components (parameters) and (b) potential function for two centroids in pseudo-time τ . (a) the solid line: x1 (1), dashed line: x1 (2), dot-dashed line: x1 (3), dotted line: x1 (4); (b) the solid line: U(X)
which commonly appear in the technical analysis of stock market assets. The optimization problem enjoys the feature of having almost a direct physical interpretation. Every particle in the swarm represents the centroid of a cluster and moves in the force field generated by each pattern to be classified. In addition, the centroids repel each other. The Nose-Hoover model of the thermostat provides the necessary amount of stochastic interaction by simulating the energy exchange between the swarm and its thermal bath. Lowering the temperature allows the system to find a deep local minimum of the objective function thus making the algorithm similar to the Simulated Annealing. We have performed some preliminary comparison of our precedure with the standard k-means approach. It has turned out that our technique is slower than
Clustering algorithm based on molecular dynamics. . .
339
k-means but there is still some room for improvement. Moreover, in several cases we could see improvement in the accuracy of our optimization. We have yet to find the proper ways to suggest a proper value of the critical parameter, namely the mass M of the Nose-Hoover pseudo-particle. So far, our experimentation has not lead to any specific recommendation. Finally, we would like to mention that the Nose-Hoover formalism can be supplemented by adding the Langevin (stochastic) forces to the right-hand sides of the equations of motion in order to improve the ergodicity. However, this is somewhat against the very spirit of Nose-Hoover approach and we have not attempted to use any such forces.
References 1. Evangelou I.E., Hadjimitsis D.G., Lazakidou A.A., and Clayton C.: Data Mining and Knowledge Discovery in Complex Image Data using Artificial Neural Networks. Workshop on Complex Reasoning on Geographical Data, Cyprus (2001) 2. Lillesand T. and Keifer R.: Remote Sensing and Image Interpretation. John Wiley and Sons, New York (1994) 3. Rao M.R.: Cluster Analysis and Mathematical Programming. J. Am. Stat. Assoc. 22 (1994) 622 4. Duda R.O. and Hart P.E.: Pattern Classification and Scene Analysis. John Wiley and Sons, New York (1973) 5. Everitt B.S.: Cluster Analysis. Halsted Press (1993) 6. Xu R. and Wunsch D.: Clustering. IEEE Press Series on Computational Intelligence (2008) 7. Forgy E.W.: Cluster analysis of multivariate data: efficiency versus interpretability of classification. Biometrics 21 (1965) 768 8. Zahn C.T.: Graph-theoretical methods for detecting and describing gestalt clusters. IEEE Transactions on Computers C-20 (1971) 6886 9. Mitchell T.: Machine Learning. McGraw-Hill, New York (1997) 10. Mao J. and Jain A.K.: Artificial neural networks for feature extraction and multivariate data projection. IEEE Trans. Neural Networks 6 (1995) 296 11. Pal N.R., Bezdek J.C., and Tsao E.C.K.: Generalized clustering networks and Kohonen’s self-organizing scheme. IEEE Trans. Neural Networks 4 (1993) 549 12. Kohonen T.: Self-Organizing Maps. Springer Series in Information Sciences, Vol. 30, Springer-Verlag, Berlin (1995) 13. Falkenauer E.: Genetic Algorithms and Grouping Problems. John Wiley and Sons, New York (1998) 14. Paterlini S. and Minerva T.: Evolutionary Approaches for Cluster Analysis. In Bonarini A., Masulli F. and Pasi G., eds.: Soft Computing Applications. SpringerVerlag, Berlin (2003) 167-178 15. Xu R. and Wunsch D.: Survey of clustering algorithms. IEEE Transactions on Neural Networks 16(3) (2005) 645 16. Rokach L. and Maimon O.: Clustering Methods, Data Mining and Knowledge Discovery Handbook. Springer-Verlag, Berlin (2005) 321-352 17. Mitra S., Pal S.K. and Mitra P.: Data mining in soft computing framework: A survey. IEEE Transactions on Neural Networks 13(3) (2002)
340
L. Chmielewski, M. Janowicz, A. Orlowski
18. Dorigo M., Maniezzo V. and Colorni A.: The ant system: Optimization by a colony of cooperating agents. IEEE Trans. Systems Man and Cybernetics, Part B: Cybernetics 26 (1996) 21 19. Dorigo M. and Gambardella L.M.: Ant colony system: A cooperative learning approach to the traveling salesman problem. IEEE Trans. Evolutionary Computing 1 (1997) 5366 20. Kennedy J. and Eberhart R.: Particle swarm optimization, In Proc. IEEE International Conference on Neural Networks (1995) 1942-1948 21. Omran M., Salman A., and Engelbrecht A.P.: Image Classification using Particle Swarm Optimization. In Proc. Conference on Simulated Evolution and Learning, Vol. 1 (2002) 370-374 22. Omran M., Engelbrecht A.P., and Salman A.: Particle Swarm Optimization Method for Image Clustering. International Journal of Pattern Recognition and Artificial Intelligence 19 (2005) 297 23. Das S. and Abraham A.: Pattern Clustering Using a Swarm Intelligence Approach. In Maimon O., Rokach L., eds.: Data Mining and Knowledge Discovery Handbook, Springer-Verlag, Berlin (2010) 469-504 24. Nose S.: A unified formulation of the constant temperature molecular-dynamics methods. J. Chem. Phys. 81 (1984) 511 25. Hoover W.G.: Canonical dynamics: Equilibrium phase-space distributions. Phys. Rev. A 31 (1985) 1695 26. Fukuda I.: Application of the Nose-Hoover method to optimization problems. Phys. Rev. E 64(1) (2001) 16203 27. Murphy J.: Technical Analysis of Financial Markets. New York Institute of Finance (1999) 28. Wikipedia. Candlestick chart – Wikipedia, the free encyclopedia. http://en.wikipedia.org/w/index.php?title=Candlestick chart. (2014) [Online; accessed 19 December 2014]. 29. Verlet L: Computer ”experiments” on classical fluids. I. Thermodynamical properties of LennardJones molecules. Phys. Rev. 159(1) (1967) 98 30. Swope W.C., Andersen H.C., Berens P.H., and Wilson K.R.: A computer simulation method for the calculation of equilibrium constants for the formation of physical clusters of molecules: Application to small water clusters. J. Chem. Phys. 76 (1982) 648