IEEE TRANSACTIONS ON KNOWLEDGE AND DATA ENGINEERING, MANUSCRIPT ID
Clustering and Sequential Pattern Mining of Online Collaborative Learning Data Dilhan Perera, Judy Kay, Irena Koprinska, Member, IEEE Computer Society, Kalina Yacef, and Osmar Zaiane, Member, IEEE Abstract— Group work is widespread in education. The growing use of online tools supporting group work generates huge amounts of data. We aim to exploit this data to support mirroring: presenting useful high-level views of information about the group, together with desired patterns characterizing the behaviour of strong groups. The goal is to enable the groups and their facilitators to see relevant aspects of the group’s operation and provide feedback if these are more likely to be associated with positive or negative outcomes and where the problems are. We explore how useful mirror information can be extracted via a theory-driven approach and a range of clustering and sequential pattern mining. The context is a senior software development project where students use the collaboration tool TRAC. We extract patterns distinguishing the better from the weaker groups and get insights in the success factors. The results point to the importance of leadership and group interaction, and give promising indications if they are occurring. Patterns indicating good individual practices were also identified. We found that some key measures can be mined from early data. The results are promising for advising groups at the start and early identification of effective and poor practices, in time for remediation. Index Terms— Data Mining, Clustering, Sequential Pattern Mining, Learning Group Work Skills, Collaborative Learning, Computer-Assisted Instruction.
—————————— ——————————
1 INTRODUCTION
G
roup work is commonplace in many aspects of life, particularly in the workplace where there are many situations which require small groups of people to work together to achieve a goal. For example, a task that requires a complex combination of skills may only be possible if a group of people, each offering different skills, can work together. To take just one other example, it may be necessary to draw on the combined efforts of a group to achieve a task in the time available. However, it is often difficult to make a group operate effectively, with high productivity and satisfaction within the group about its operation. Reflecting the importance of group work, there has been a huge body of research on how to make groups more effective and how to help group members build relevant skills. In one meta-analysis of this body of work, a set of five key factors and three enablers has been identified [1]. For example, this work points both to the importance of leadership as one of the five key factors and to the effectiveness of training in leadership. The importance of group work skills is reflected in education systems, where students are given opportunities to develop these valuable skills. Often, and increasingly, such groups are supported by software tools. This
may be in the context of distance learning, where the groups are distributed and the members must use software to support their collaboration. In addition, even when student groups work in the same classroom or campus, they may be supported by a range of online tools, such as chat, message boards and wikis. For small groups that need to collaborate on substantial tasks over several weeks, such tools can amass huge amounts of information and generate large electronic traces of their activity. This has the potential to reveal a great deal about the group activity and the effectiveness of the group. Our goal is to improve the teaching of the group work skills and facilitation of effective team work by small groups, working on substantial projects over several weeks by exploiting the electronic traces of group activity. Our approach is to analyse these traces to create mirroring tools that enable the group members, their teachers or facilitators to see useful indicators of the health and progress of their group. We consider it important that our work should be in the context of standard, state-of-the-art tools for supporting groups. This means that we should be able to exploit the data from a range of tools and media that are valuable for small group management. These include wikis, issues tracking systems and version control ———————————————— software. The key contribution of our work is an im• D. Perera, J. Kay, I. Koprinska and K. Yacef are with the School of Informa- proved understanding of how to use data mining to build tion Technologies, University of Sydney, NSW 2006, Australia. E-mail: mirroring tools that can help small long-term teams im{dper6077, judy, irena, kalina}@it.usyd.edu.au. prove their group work skills. • O. Zaiane is with the Department of Computing Science, University of Our work is situated at the intersection of three main Alberta, Canada. E-mail:
[email protected]. areas: Machine Learning and Data Mining, especially as
Manuscript received (insert date of submission if desired). Please note that all acknowledgments should be placed at the end of the paper, before the bibliography. xxxx-xxxx/0x/$xx.00 © 200x IEEE
1
2
IEEE TRANSACTIONS ON KNOWLEDGE AND DATA ENGINEERING, MANUSCRIPT ID
they apply to educational contexts; Computer Supported Collaborative Learning (CSCL); the body of knowledge about small group skills and effectiveness. While our research has been informed by all of these, it is important to distinguish just how our work differs from previous work in them. We now briefly discuss this in terms of each of these areas. The emerging research community of Educational Data Mining [2] exploits data from learners' interaction with e-learning tools, particularly web-based learning environments. The recognition of the huge potential value of such data has led to a series of ten workshops and a new conference [3]. There have been recent promising results using a range of techniques [4-7]. There is good reason for this new research area, primarily because it needs to deal with issues that differ from those that had previously had most attention in the wider data mining and machine learning research. For example, educational data presents several difficulties for the data mining algorithms as it is temporal, noisy, correlated, incomplete and may lack enough samples for some tasks. In addition, there is a need for understandable and scrutable presentations of the data mining results appropriate for the nondata mining savvy users. This area is establishing the new requirements for effective mining and analysis of learning data. This paper continues this exploration of foundations for this area, taking account of the particular demands of one important class of educational context. CSCL is an established and active research area. However, much of the focus of that community is based upon the value of collaboration for improved learning across many disciplines. This is rather different from our focus. So, for example, the CSCL community has done considerable work on the use of discussion boards. This is relevant to our work in that it does explore ways to improve participation rates as in the work of Cheng and Vassileva [8]. They created an adaptive rewards system, based on group and individual models of learners. This had elements of mirroring but significantly differs from our goal of supporting small groups for whom learning group work skills is one of the learning objectives and the group work is the key focus. Some research has brought together CSCL and data mining. Notably, Talavera and Gaudioso [9] applied clustering to student interaction data to build profiles of student behaviours. The context of the study was a course teaching the use of Internet and the data was collected using a learning management system from three main sources: forums, email and chat. Their goal was to support evaluation of collaborative activities and although only preliminary results were presented their work confirmed the potential of data mining to extract useful patterns and get insight into collaboration profiles. Soller [10, 11] analysed conversation data where the goal was knowledge sharing: a student presents and explains new knowledge to peers; peers attempt to understand it. Hidden Markov models and multidimensional scaling were successfully applied to analyse the knowledge sharing conversations. However, Soller required group members to use a special interface using sentence starters, based on
Speech Act Theory. The requirement for a special interface, limited to a single collaboration medium, with user classified utterances has characterised other work, such as Barros and Verdejo [12] whose DEGREE system enabled students to submit text proposals, co-edit and refine them, until agreement was reached. By contrast, we wanted to ensure that the learners used collections of conventional collaboration tools in an authentic manner, as they are intended to be used to support group work: we did not want to add interface restrictions or additional activities for learners as a support for the data mining. These goals ensure the potential generality of the tools we want to create. It also means that we can explore use of a range of collaboration tools, not just a single medium such as chat. The notion of mirroring has been discussed in a similar context to ours [13]. In the current state of research, the goal of mirroring that is effective is a realistic starting point. Moreover, it has the potential to overcome some of the inherent limitations of data mining that does not make use of a deep model of the group task and the complex character of each particular group. So, it offers promise for powerful and useful tools that are more generic, able to be used by many different groups working on different tasks. We have already found that mirroring of simple overall information about a group is valuable [14]. The work on social translucence [15, 16] has also shown the value of mirroring for helping members of groups to realise how they are affecting the group and to alter their behaviour. Our experience with these tools has pointed to their particular power in the context of long-term small groups: the mirrored information serves as valuable starting point for both discussing group work, as part of the facilitation process, and it can serve as an excellent basis for exploring the information within the collaboration environment. The paper is organised as follows. The next section states our goals of mining group logs, identifies the main stakeholders and how they can benefit from the extracted patterns. Section 3 describes in more detail the context of our study: the learner population, TRAC online system and nature of the data collected. Section 4 presents the initial data exploration performed and discuses its limitations. Then the actual data mining is presented, with Section 5 describing the clustering work and Section 6 presenting the frequent sequential pattern mining. We discuss the results, problems encountered, and how the discovered patterns can be used to improve teaching and learning. Section 6 concludes the paper.
2. GOALS OF MINING GROUP WORK LOGS We set our primary goal for the data mining as providing mirroring tools that would be useful for helping improve the learning about group work. This goal is realistic in the context of the highly complex and variable nature of longterm, small group activity, especially where the learners undertake a diverse range of tasks, such as creating a software system for an authentic client. Our mirroring goal means that we aim to extract patterns and other in-
PERERA ET AL.: CLUSTERING AND SEQUENTIAL PATTERN MINING OF ONLINE COLLABORATIVE LEARNING DATA
formation from the group logs and present it together with desired patterns to the people involved, so that they can interpret it, making use of their own knowledge of the group tasks and activities. To underpin our work, we have used the Big Five theory of group work [1]. It is based on a broad metaanalysis of research on small group interaction, drawing on the large body of literature reporting studies of various aspects of group work and determinants of success. It has established five key factors: leadership, mutual performance monitoring, backup behaviour, adaptability and team orientation. Backup behaviour involves actions like reallocating work between members as their different loads and progress becomes recognised. Adaptability is a broader form of changing plans as new information about internal group and external issues are identified. Team orientation covers aspects such as commitment to the group as a whole. It also has identified three supporting mechanisms: shared mental models, especially shared understanding of how the group should operate; mutual trust; and closed loop communication, which means that, regardless of the medium, a person communicating a message receives feedback about it and confirms this. This theory provides a language with which to discuss group work and guides our data mining. Given our goal, it is important to distinguish the key stakeholders because the information relevant to each is somewhat different. We distinguish four classes of stakeholders: • individual learner: each has a good knowledge of their own goals and activities but may be unaware of what others in their group have been doing and how well they have been performing as a team member and what they should be doing to be more effective in their allocated roles; • individual group: the group as a whole is aware of some aspects of their performance but is less aware of how they could improve their performance and how well they are doing on the various dimensions of the Big Five elements; • group facilitator: this person works with the groups, meeting them regularly and helping them see how to improve their performance. This person is more knowledgeable about group processes and has an outsider view of the group. However, they need help in seeing just what the group members have been doing and how they have been interacting; • course co-ordinator: this person needs to teach the group skills and to monitor the progress of all the groups. They have least knowledge of the details of the individual groups and are most in need of support in seeing a big picture overview of the large amounts of log data to understand what the groups are doing. We were able to refine the goals of mirroring into the following three sub-goals: • timely problem identification: All stakeholders should be keen to know about indicators of problems in the group work, especially if these indicators can be provided in time for remedial action to have a sig-
nificant effect. In particular, if the group facilitator, can see patterns that are suggestive of potential problems in some key aspects, such as leadership or effective closed loop communication, they can discuss these issues with the group and work with them to find ways to improve the learning about group work and to ensure the success of the group. • support for self-monitoring: This is particularly important for the individual. For example, the leader should have distinctive behaviours and we would like to provide high level mined results reflecting the effectiveness of their interaction, as a leader; • improved understanding of how effective groups make use of the online collaboration tools: this is most important for co-ordinators as it can inform their teaching and organisation of the learning environment. We will refer to our identified stakeholders and the sub-goals of the data mining in the discussion of the data mining and the value of different results for the different stakeholders.
3 CONTEXT OF THE STUDY 3.1 Learners The learners were students completing a senior software development project course. Over 12 weeks, and working in groups of 5-7 students, they were required to develop a software solution for a client. The topics varied from creating a computer-based driving ability test to developing an object tracking system for an art installation. The groups were required to use Extreme Programming (XP) [17], including use of user stories, small releases, and collective code ownership. We have collected data over three semesters, for cohorts in 2005 and 2006. This paper reports the last 2006 cohort because our teaching changed markedly in 2006 and that cohort was given much more support and instruction in group work skills. This means their data is richer and more meaningful, and is also not comparable with the data from 2005.
3.2 Online Learning Environment: TRAC Student teams were required to use TRAC [18] for online collaboration. TRAC is an open source, professional software development tracking system. It supports collaboration by integrating three tools: • A group wiki for shared web pages. It is a collaborative authoring tool, allowing the group members to add, remove or edit web pages, linked from the main group page. • A task management system also known as a ticketing system. A ticket is created for each task that the team has to do. For example, if the team needs to do research on e-learning, one person (often the leader) should create a ticket for this task, which is then allocated to a person for completion. Team members can add comments on a ticket, reassign it to someone else or close it.
3
4
IEEE TRANSACTIONS ON KNOWLEDGE AND DATA ENGINEERING, MANUSCRIPT ID
• Subversion (SVN) control system. It provides a re-
3.3 Data We collected data from the students’ use of TRAC; essentially, all the traces of their actions. This includes capturing data whenever a user: 1) created a wiki page or modified it, e.g. added or removed text, 2) created a new ticket or modified an existing, e.g. by closing it, reassigning it, changing its priority or severity, or adding a comment, 3) committed a file to the SVN repository or modified an existing one, or added and reorganised the directories in the repository. Information about each of these events was stored, including the time of the event and the group members and resources involved. In addition to these electronic traces, we also had the progressive and final marks, together with a very good understanding of the quality of each group’s processes and product throughout the semester. The groups were ranked based on their performance from 1 to 7 where Group 1 denotes the strongest and Group 7 the weakest group. It should be noted that in addition to TRAC, the student teams collaborated and communicated via other media to which we don’t have access, such as instant messaging, telephone conversations, SMS. Most importantly, they had face-to-face meetings, typically at least twice a week. These meetings play a critical role in the group co-ordination.
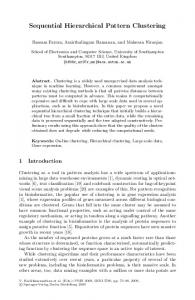
1200
Number of ticketing events
pository for the software created by the group and manages the changes made over time. It allows recovery of older versions of the software and a view of the history of how the files and directories were changed. We have enhanced this professional tool with artefacts which extract information from learners’ data in the form of student models: 1) for students to peruse and reflect on and 2) for teachers to have a bird’s eye view of what students are doing and where to focus their teaching efforts [19].
Ticketing Behaviour
1000
800
600
400
200
0
Group 1
Group 2
Group 3
Group 4
Group 5
Group 6
Group 7
Fig. 1. Total number of ticketing events per group
Secondly, we looked at the distribution of the individual ticketing events (ticket created, accepted, reopened and closed), see Fig.2. As tickets must be accepted by the assignee before they are recorded as being assigned, we expect the better groups to have near equal proportion of created and accepted tickets, which was the case. In contrast, some of the poorer groups had a much lower proportion of accepted than created tickets. Again, this statistic is not very useful on its own: the poorest group displayed similar patterns to the top groups. It should also be noted that Group 4 admitted at the interviews that one person logged in as the other team members and entered all group contributions, which explains their ideal distribution of the ticketing events. New
Assigned
Reopened
Closed
100 80 60 40 20 0
4 DATA EXPLORATION Before any data mining was carried out, the data was examined to see whether any simple statistics could distinguish the stronger from the weaker groups. Firstly, we checked the total number of ticket events for each group, as shown in Fig. 1. Intuitively we expect a large number to be associated with strong groups as the tickets allow group members to keep track of their work, including to allocate and accept tasks. Indeed the results show that the top group had the highest number of ticket events. However, the performance of the other groups does not seem to correlate with the number of ticket events. For example, Group 2 had one of the lowest numbers. Upon interviewing members from this group (after the completion of the course), we found that they were reluctant to use the system as they felt it to be too cumbersome, and hence preferred to communicate their progress by other means.
Group Group Group Group Group Group Group 1 2 3 4 5 6 7
Fig. 2. Distribution of ticket actions per group [%]
Thirdly, we examined the usage span of the wiki pages, i.e. the time between the first and last event on the page, see Fig.3. Group 1 has the lowest number of wiki pages but they were, on average, active for the longest period of time. This pattern is also evident for the next best group (Group 2), and the opposite pattern is displayed by the two poorest groups. There are several possible interpretations for this result and more work is needed to validate them. It could be that the better groups used the wiki for more “active” purposes, such as group discussion or a logging of personal progress, while the poorer groups used the wiki for more “static” purposes such as posting research and guidelines. Considering groups were required to post assessable work (such as reports) on the wiki, it could also be that the better groups started this work earlier, while the poorer groups worked
PERERA ET AL.: CLUSTERING AND SEQUENTIAL PATTERN MINING OF ONLINE COLLABORATIVE LEARNING DATA
in a more compressed timeframe. However again, as shown by Group 5, this measure alone was not predictive of the quality of the group. Wiki Behaviour
Mean Wiki Page Usage Span (days)
16.00 14.00 12.00 10.00 8.00 6.00 4.00 2.00 0.00
Group 1 Group 2 Group 3 Group 4 Group 5 Group 6 Group 7
Fig. 3. Usage span of wki pages
Lastly, we studied our SVN data and found that it was problematic for two reasons. First, as files were identified by their pathnames, we could not track unique files as they were often moved to different locations within the group repositories. Second, differences between SVN clients meant that data which was recorded on the number of lines added and deleted to committed files was not reliable. Thus, the only reliable SVN data was the time each commit took place. We use it to count the number of days on which SVN activity occurred for a group, Fig. 4. The top group again was ranked highest on this measure: however, there was no obvious pattern in this statistic for the other groups. SVN Behaviour 70
group. An application of clustering in an educational setting is presented in [4], where students using an intelligent tutoring system were clustered according to the types of mistakes made. The authors suggested that through the use of clustering, teachers could identify different types of learners and apply different remedial methods. A similar goal can be transferred to the current context, with clustering possibly identifying different styles of groups which may benefit from different styles of intervention. However, it must be noted that with a small number of groups, such analysis could be performed by the teachers alone, without the aid of clustering results. Therefore, our primary goal was simply to assess whether our data contained features which could be translated through clustering into meaningful information about groups and individual learners. As a main clustering algorithm we selected k-means which is the most popular. It is also simple, effective and relatively efficient [20, 21]. We used the WEKA [22] implementation with Euclidean distance measure. The data consisted of TRAC usage traces for 43 students working in 7 groups. Its size was 1.6 mega bytes in mySQL format and it contained approximately 15000 events as shown in Table 1. TABLE 1. NUMBER OF EVENTS FOR EACH GROUP Group 1 2 3 4 5 6 7 Total
Number of Events 2460 1416 1499 2156 3395 1639 2462 15027
Number of days
60 50
5.1 Clustering Groups 40 30 20 10 0
Group 1
Group 2
Group 3
Group 4
Group 5
Group 6
Group 7
Fig. 4. Number of different days on which SVN event occurred for each group
5 CLUSTERING As shown in the previous section, simple statistical exploration of the data was quite limited. The results suggested the need to consider multiple data attributes simultaneously. Clustering allows us to use multiple attributes to identify similar groups in an unsupervised fashion. In addition, it provides the opportunity to mine the data at the level of individual learners (i.e. to find groups of similar learners) and then to examine the composition of each
The most important problem was attribute selection. The performance of clustering algorithms is very sensitive to the quality of the attributes. Initially we chose a set of 8 numeric attributes representing ticketing behaviour such as the number of tickets and ticket events; the number of days on which tickets were opened, closed, or a ticket event occurred; and the ticket usage span (number of days between first and last event). We firstly ran k-means with k=3 clusters. The number of clusters was set to 3 based on expert knowledge, i.e. consultation with teaching staff and also considering students’ final marks in the course. As mentioned before, we had a very good understanding of the quality of the processes followed by each group and their final product. We also experimented with k=2 and 4 but the results were most meaningful for k=3. Table 2 shows the clustering of the groups, together with the extracted distinguishing characteristics of each cluster. The first cluster consists of Groups 2, 3, 4 and 7 and is characterised by overall low ticketing activity.
5
6
IEEE TRANSACTIONS ON KNOWLEDGE AND DATA ENGINEERING, MANUSCRIPT ID
While low ticketing activity is typically associated with weaker groups, Group 2, the second best group, also showed this characteristic as it was reluctant to use the ticketing system as discussed in Sec. 3. The separation of Group 1 from Groups 5 and 6 shows that the way the tickets were used, as opposed to just the ticketing activity, was important. More specifically, the results show that tickets are most beneficial when they are actively updated (e.g. through posting comments on progress or adjusting their priority) as opposed to simply being created and closed. However, we found that many of these attributes were correlated (some as high as 0.918, p=0.004). It was also felt that the simultaneous use of the wiki, ticket and SVN behaviours will be more informative than the ticketing activity alone. TABLE 2. CLUSTERING TICKETING BEHAVIOUR USING K-MEANS (K=3) AND 8 ATTRIBUTES Clusters Groups 2, 3, 4 & 7 Groups 5 & 6
Group 1
Distinguishing characteristics Overall low ticketing activity Many tickets Fewer ticketing events Greater percentage of trivial and minor ticket priorities Less accepting events Many tickets Many ticketing events Lowest percentage of minor ticket priorities More events where ticket priorities were changed or comments posted
This motivated the manual creation of composite attributes that seemed to capture essential aspects of team performance. Attributes that measured total activity were excluded in favour of those that gave an indication of how TRAC was used when it was used. Through this process, the 11 attributes listed in Table 3 were selected. It is interesting to note that 5 of them (the ones marked with *) were automatically ranked favourably when three of the WEKA’s [22] supervised attribute selection algorithms were used together (Information Gain, Relief and Support Vector Machines) with two slightly different group performance rankings. TABLE 3. THE 11 ATTRIBUTES SELECTED FOR CLUSTERING OF GROUPS
-Average number of events per ticket -Number of different days ticketing occurred -Average number of ticket events per active ticketing day * -Percentage of ticket events not involving an ‘action’ on the ticket (i.e. the ticket was either updated with a comment or a priority change) * -Percentage of ticket ‘action’ events where a ticket was accepted -Average number of events per wiki page -Average wiki page usage span (days between first and last edit) * -Average number of edit days per page * -Average number of lines added per wiki edit -Average number of lines deleted per wiki edit * -Number of different days an SVN activity occurred
The k-means clustering results using the above 11 attributes are shown in Table 4. Comparing Tables 2 and 4, we can see that the results are similar; only Groups 6 and 7 are in different clusters (swapped). Group 1 was again clearly separated from the others. As k-means is sensitive to the seed initialization and also does not deal well with clusters with non-spherical shape and different size, we also ran the EM clustering algorithm [20] using its WEKA’s implementation [22]. As a mixture model clustering, EM is a more general algorithm than kmeans and doesn’t suffer from the limitations listed above. Using the same settings (k=3 clusters and 11 attributes), we obtained the same results as with k-means (Table 4). TABLE 4. CLUSTERING TRAC ACTIVITY USING K-MEANS (K=3) AND 11 ATTRIBUTES Clusters Groups 2, 3, 4 & 6 Groups 5 &7
Group 1
Distinguishing characteristics -Moderate events per ticket -Infrequent TRAC activity (tickets and SVN) -Moderate % of ticket update events -Moderate number of lines added/deleted per wiki edit -Moderately frequent TRAC activity (tickets and SVN) -High edits per wiki page -Low number of lines added/deleted per wiki edit -Low number of events per ticket -Low % of ticket update events -Very frequent TRAC activity (tickets and SVN) -High events per wiki page and per ticket -High wiki page usage span -High % of ticket update events -High % of ticket accepting events
To get better insight into the group similarities we also ran hierarchical agglomerative clustering [20] with Euclidean distance using Cluster [23]. The algorithms initially places all examples in a cluster of their own and then iteratively merges the closest two clusters, until all examples form one big cluster. The results are shown in Fig. 5 using TreeView [24]. At level 3 (i.e. 3 clusters considered), the results are the same as using k-means (Table 4). Thus, we obtained the same clustering results for k=3 using k-means, EM and hierarchical agglomerative clustering. Such results are useful for the course co-ordinator. They highlight that Group 1’s behaviour is distinguished from the others. The co-ordinators had some sense that this group was well managed but this cluster analysis pointed to the particular behaviours that distinguished this group. We only noticed these after the results of the data mining prompted us to look at particular parts of the TRAC sight and to see the way they used tickets. It turned out that they made extensive use of the wiki on each ticket for communication about the task associated with it. The course co-ordinators discovered this, more effective way to use TRAC, only because of the results just reported. This new understanding was used in subsequent teaching and was judged by the facilitators to be helpful.
PERERA ET AL.: CLUSTERING AND SEQUENTIAL PATTERN MINING OF ONLINE COLLABORATIVE LEARNING DATA
7
TABLE 6. STUDENT CLUSTERS OBTAINED USING K-MEANS Cluster size 8 students
9 students
11 students Fig. 5. Hierarchical agglomerative clustering using the 11 attributes 15 students
5.2 Clustering Students We also performed clustering of the individual students, with the hope that the group composition would reveal information that was missed when all individuals in a group were considered together. The attributes we selected are listed in Table 5; they are similar to the ones in Table 3 but characterise individual not group activity.
-Number of ticket events -Number of tickets in which the individual was involved -Number of different days in which a ticket event occurred -Average number of ticket events per active (individual) ticketing day * -Number of wiki events -Number of wiki pages edited -Number of different days on which a wiki event occurred -Average number of wiki events per active (individual) wiki day -Average lines added per wiki edit -Average lines deleted per wiki edit -Number of SVN commits -Average number of files per SVN commit -Number of different days in which an SVN commit occurred -Average number of SVN commits per active (individual) SVN day
Table 6 shows the clusters obtained with k-means for k=4, together with their distinguishing characteristics. Again the number of clusters was set empirically using expert knowledge and by looking for meaningful grouping. Based on our interpretation of the characteristics in Table 6, a cluster label was assigned (“Managers”, “TRACoriented developers”, “Loafers” and “Others”). The distribution of students from each group into these 4 clusters is presented in Table 7, with asterisks showing the cluster in which each group’s designated manager (leader) was placed. This role was allocated to one person after the initial start-up period. For example, Group 5 consisted of 7 students; 3 of them were clustered as “Managers”, 1 as “TRAC-oriented developers”, 0 as “Loafer” and 3 as “Others”; the designated group manager was clustered as “TRAC-oriented developer”
Cluster label “Managers”
“TRACOriented Developers”
“Loafers”
“Others”
TABLE 7. DISTRIBUTION OF STUDENTS FROM EACH GROUPS INTO THE CLUSTERS FROM TABLE 6
TABLE 5. THE 14 ATTRIBUTES SELECTED FOR CLUSTERING OF INDIVIDUAL STUDENTS
Distinguishing Characteristics High ticketing activity Involved in many tickets High wiki activity Involved in many wiki pages Moderate SVN activity Moderately high ticketing activity Ticketing occurring on many different days Moderate wiki activity Very high SVN activity Low ticketing activity Low wiki activity Low SVN activity Moderately low ticketing activity Moderately low wiki activity Many wiki events on days which wiki events occurred Many SVN events on days which SVN events occurred
Group 1 Group 2 Group 3 Group 4 Group 5 Group 6 Group 7
Managers *1 *1 0 *1 3 *1 *1
TRACOriented Developers 3 0 1 3 *1 1 0
Loafers
Others
1 1 2 2 0 3 2
1 3 **3 0 3 1 4
Some differences between previous groupings began to emerge. For example, Groups 2 and 3 differ by Group 3’s lack of a manager. This was consistent with our knowledge of the leadership problems this group encountered, with the original manager leaving the course and another group member taking over. The lack of TRACoriented developers in Group 2 was validated in a group interview where the main developers expressed a reluctance to use TRAC. Group 5 is also distinctive in its excess of managers, perhaps suggesting too many managerial and organisational processes were occurring at the expense of actual work being done. This is further complicated by their designated manager being placed in the cluster which performed more technical than managerial work. One possibility is that this weak leadership resulted in others reacting to fill the manager’s role, with their technical work subsequently being compromised. This is a pattern to be aware of in future groups. We also conducted another experiment. We ran the clustering using the data only from the first seven weeks of data and found that, already, some of these key results had already emerged. For example, the Group 5 leader was already showing the developer’s behaviours. Had the group facilitator been aware of this, they may have been able to help this group deal with this problem, early enough to have made a difference. The presence of three
8
IEEE TRANSACTIONS ON KNOWLEDGE AND DATA ENGINEERING, MANUSCRIPT ID
loafers was also apparent in Group 6. The early data also showed leadership’s behaviours by all other leaders at that stage. These results also have great value for the individuals so that they could, as needed, alter their behaviour. In conclusion, we found clustering to be useful, revealing interesting patterns characterising the behaviour of the groups and individual students, when using TRAC. Frequent use of the 3 media, with high number of active events (such as ticket update and ticket accepting, wiki page edits and SVN commits) is associated with positive outcomes. Effective group leadership and monitoring are also linked with positive outcomes. In future work, we would like to make a better use of the SVN data as it is an important data source conveying the “real work” done by the students in producing software.
5.3 Limitations of Clustering The main limitation was the small data sample, especially in the first task, clustering of groups. Although the data contained more than 15000 events, we had only 7 groups and 43 students. Nevertheless, we think that the collected data and selected attributes allowed for uncovering useful patterns characterising the work of stronger and weaker students as discussed above. The follow-up interviews were very helpful for interpreting and validating the patterns. How to select the most appropriate clustering algorithm and how to set its parameters is another important issue. There are methods for determining a good number of clusters and evaluating the clustering quality in terms of cohesion and separation of the clusters found [20]. We believe that in this application the expert knowledge of the course co-ordinators and facilitators is essential to find meaningful number of clusters and extract meaningful characteristics, and then use them on new cohorts. For larger datasets, hierarchical clustering may not be applicable due to its high time and memory requirements; kmeans may be still a good choice, especially some of its modifications, such as bi-secting k-means [20] which is less sensitive to initialization and is also more efficient.
6 SEQUENTIAL PATTERN MINING An important aspect of our data which is ignored by mining techniques such as clustering is the timing of events. We believe that certain sequences of events distinguish the better groups from the weaker ones. In particular, we expected that we should be able to use these to gain indications of closed loop communication, one of the enablers in the Big Five Theory. Such sequence may represent a characteristic team interaction on a specific resource, or group members displaying specific work patterns across the three aspects of TRAC. A data mining technique which considers this temporal aspect is sequential pattern mining [25]. It finds sequential patterns that occur in a dataset with at least a minimal level of frequency called support [26]. Sequential pattern mining has been previously used in e-learning although for different goals than others: to support personalised course delivered based on
the learner characteristics [7] and to recommend sequences of resources for users to view in order to learn about a given topic [27]. We first present the algorithm we used and then the data pre-processing we applied.
6.1 Algorithm The goal of sequential pattern mining is to discover all frequent sequences of itemsets in a sequence dataset. An example of a sequence dataset is shown in Table 8 which contains 3 sequences: S1, S2 and S3. A sequence is an ordered list of elements. These elements are collections of one or more events (items), in our case an element consists of one event. The length of a sequence is the number of elements in it; a sequence of a length k is called a ksequence. A sequence a= is a subsequence of b=, if there exist integers 1