dimensional data and employs a very fast algorithm. Other forms of data structuring techniques include hashing and binary tree structures. However, clustering ...
(IJACSA) International Journal of Advanced Computer Science and Applications, Vol. 2, No. 11, 2011
Clustering: Applied to Data Structuring and Retrieval Ogechukwu N. Iloanusi
Charles C. Osuagwu
Department of Electronic Engineering University of Nigeria, Nsukka Enugu State, Nigeria
Department of Electronic Engineering University of Nigeria, Nsukka Enugu State, Nigeria
Abstract—Clustering is a very useful scheme for data structuring and retrieval behuhcause it can handle large volumes of multidimensional data and employs a very fast algorithm. Other forms of data structuring techniques include hashing and binary tree structures. However, clustering has the advantage of employing little computational storage requirements and a fast speed algorithm. In this paper, clustering, k-means clustering and the approaches to effective clustering are extensively discussed. Clustering was employed as a data grouping and retrieval strategy in the filtering of fingerprints in the Fingerprint Verification Competition 2000 database 4(a). An average penetration of 7.41% obtained from the experiment shows clearly that the clustering scheme is an effective retrieval strategy for the filtering of fingerprints. Keywords-component; indexing.
Clustering;
k-means;
data
retrieval;
I. INTRODUCTION A collection of datasets may be too large to handle and work on hence may be better grouped according to some data structure. Large datasets are encountered in filing systems in digital libraries, access to and caching of data in databases and search engines. Given the high volume of data there is need for fast access and retrieval of required or relevant data. Several of the existing data structures are hashing [1, 2, 3, 4, 5, 6], search trees [7, 8], and clustering [9]. Hashing is a technique that utilizes a hash function to convert large values into hash values and maps similar large values to the same hash values or keys in a hash table. Clustering is however a useful and efficient data structuring technique because it can handle datasets that are very large and at the same time n-dimensional (more than 2 dimensions) and similar datasets are assigned to the same clusters [9]. A 2D or 3D point can be imagined and illustrated however it will be difficult to imagine or illustrate a 9dimensional data. When datasets are clustered, the clusters can be used rather than the individual datasets. Clustering is a process of organizing a collection of data into groups whose members are similar in some way [9, 10, 11, 12] According to Jain et al. [13] “Cluster analysis is the organization of a collection of patterns (usually represented as a vector of measurements, or a point in a multidimensional space) into clusters based on similarity”. Similarity is determined using a distance measure and objects are assigned and belong to the same cluster if they are similar according to some defined distance measure. Cluster analysis differs from classification because in clustering the data are not labeled and hence are naturally partitioned by the clustering algorithm
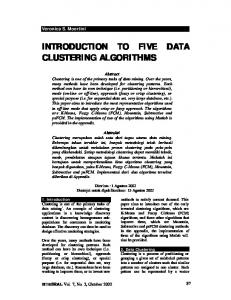
whereas in classification the data are labeled and partitioned according to their labels. The former is hence an unsupervised mode of data structuring while the later is supervised [13]. Jain [14] identifies three main reasons while data clustering is used; to understand the underlying structure of the data; to determine degree of similarity amongst the data in their natural groupings and to compress data by summarizing the data by cluster groups. Clustering has a vast application in the life sciences, physical and social sciences and especially in the disciplines of Engineering and Computer Science. Clustering is used for pattern analysis, recognition and classification, data mining and decision making in areas such as document retrieval, image processing and statistical analysis and modeling [13]. Documents may be clustered for fast information access [15] or retrieval [16]. Clustering is used in image processing to segment images [17] as well as in marketing, biology, psychiatry, geology, geography and archeology [13]. Figure 1 shows a general data clustering illustration. The data are grouped in clusters. Each cluster has a collection of data that are similar.
Similar data
Data
Dissimilar data
Clustered data
Figure 1. Data Clustering
A cluster is a group of similar datasets represented by an ndimensional value given by the cluster centroid. Clusters may also be defined as “high density regions separated by low density regions in the feature space” [13]. Every cluster is assumed to have a centroid, which is the arithmetic mean of all data in that cluster. The mean is what is common to data assigned to a cluster and creation of clusters
100 | P a g e www.ijacsa.thesai.org
(IJACSA) International Journal of Advanced Computer Science and Applications, Vol. 2, No. 11, 2011
builds from the arithmetic mean. A similarity measure is used for the assignment of patterns or features to clusters. II. CLUSTER SIMILARITY MEASURES Similarity is fundamental to the definition of a cluster hence a measure for the similarity otherwise known as the distance measure is essential. The dissimilarity or similarity between points in the feature space is commonly calculated in cluster analysis [13]. Some of the distance measures used are:
Euclidean distance Manhattan distance Chebyshev distance Hamming distance The distance metric is used for computing the distance between two points and cluster centers. For the distance measures explained in the following sections, two points, a and b, are defined in an n-dimensional space as: a = (w0, x0, y0…z0) coordinates
(1)
b = (w1, x1, y1…z1) coordinates
(2)
A. Euclidean distance Euclidean distance is the distance between two points, a and b, as the crow flies in an n-dimensional space. (
) √∑
√((
)
(
(
) )
(3)
)
(4)
where n is the number of dimensions. The Euclidean distance is the most commonly used metric because it is appealing to use in an n-dimensional space and it works well with isolated clusters [13]. B. Manhattan distance In the Manhattan distance, the distance between two points is the absolute difference of their coordinates. (
)
(
)
(
)
(5)
the number of substitutions required to change a string into another. It is the number of positions at which corresponding digits in the two strings are different [19]. Given two strings a and b where a = 0110110 and b = 1110011, the difference between the two strings a and b, D(a,b), where
D(a,b) = 3, as the corresponding digits differ in three places. III.
CLASSIFICATION OF CLUSTERING ALGORITHMS Clustering algorithms may be classified as: Exclusive clustering Overlapping clustering Hierarchical clustering A. Exclusive clustering In exclusive clustering, data that belongs to a particular cluster cannot belong to another cluster. An example is Kmeans clustering. B. Overlapping clustering Data may belong to two or more clusters. Example of this in fuzzy-c-means clustering. C. Hierarchical clustering In this case clusters are represented in tree from. Two close clusters are derived from the top-level cluster. The hierarchy is built by individual elements progressively merging into bigger clusters. Figure 2 shows the types of data clustering algorithms.
The difference between the Euclidean distance and the Manhattan distance is that the Euclidean is a squared distance while the Manhattan is not squared.
Jain [13] classifies clustering algorithms as hierarchical and partitional. In hierarchical clustering each cluster arises from and depends on the parent cluster. A typical partitional clustering algorithm is the K-means algorithm.
C. Chebyshev distance In the Chebyshev distance metric the distance between two points is the greatest of their differences along any coordinate dimension [18]. This distance is named after Pafnuty Chebyshev.
IV. CLUSTER SIMILARITY MEASURES K-means clustering algorithm was first proposed over 50 years ago [14] and is commonly preferred to other clustering algorithms because of its ease of implementation and efficiency in cluster analysis.
(
)
(
)
(6)
This is also known as the chessboard distance. In the chessboard the length of side of a chess square may be assumed as one unit. In this case the minimum number of moves needed by a king to go from one chess square to another equals the Chebyshev distance between the centers of the squares. D. Hamming distance The Hamming distance is a way of determining the similarity of two strings of digits of equal lengths by measuring
K-means clustering is a type of cluster analysis that partitions n observations into k disjoint clusters, k