Key words: Social Tagging Systems, user clustering, time, topic ... edge rich patterns after a specific usage period. ..... in Collaborative Tagging Systems.
Clustering of Social Tagging System Users: A Topic and Time Based Approach Vassiliki Koutsonikola1, Athena Vakali1 , Eirini Giannakidou1,2 , and Ioannis Kompatsiaris2 1
2
Department of Informatics Aristotle University 54124 Thessaloniki, Greece Informatics and Telematics Institute CERTH Thermi-Thessaloniki, Greece
ap
er
Abstract. Under Social Tagging Systems, a typical Web 2.0 application, users label digital data sources by using freely chosen textual descriptions (tags). Mining tag information reveals the topic-domain of users interests and significantly contributes in a profile construction process. In this paper we propose a clustering framework which groups users according to their preferred topics and the time locality of their tagging activity. Experimental results demonstrate the efficiency of the proposed approach which results in more enriched time-aware users profiles. Key words: Social Tagging Systems, user clustering, time, topic
Introduction
tp
1
D ra f
Social Tagging Systems (STSs) constitute a Web 2.0 application and an emerging trend where web users are allowed to manage and share online resources through annotations. This user-driven approach of information creation and organization is called folksonomy [1] and its strength lies in the fact that its structure and dynamics are similar to those of a complex system, yielding in stable and knowledge rich patterns after a specific usage period. In an STS, users are allowed to use tags in the form of freely chosen keywords to describe publicly available Web resources. They are not restricted by any pre-defined navigational or conceptual hierarchies contributing, thus, in a knowledge space that is built incrementally (by many users) in an evolutionary and decentralized manner. In an STS, the resources that users share and the people they connect to reveal their preferences. Moreover, the keywords they use to describe resources reveal their viewpoint for the specific topic-domain that these resources refer to [3]. However, despite the abundant user-provided data that has been aggregated by STS and offer valuable information about their interests, only a few studies in the literature take advantage of tagging systems for the purpose of user profile extraction. A current research trend to extract patterns of users’ tagging behavior is to employ clustering [7, 2, 9] for the analysis of the information
ap
er
contained in personomies [4]. Personomies refer to the set of tags and resources that are associated with a particular user and contribute to the identification of their multiple interests and to the extraction of more enriched and accurate user profiles. Existing approaches are based on related tags included in different personomies to identify users with similar interests [5, 8]. Thus, users profiles are modeled according to their relation with the different tag clusters [2, 6]. However, as tagging communities grow the added content and metadata become harder to manage due to the increased content diversity, hence tags become less effective in characterizing users preferences. In this paper we propose a framework that groups STS users according to two criteria: i) the topic-domain and ii) the time locality of users tagging activity. Our work was inspired by [10] where the authors show that a time-aware clustering approach results in a particularly enriched user clustering process. To this context, the consideration of time aspect along with the topic of tags used by STS users can characterize better and more accurately users interests. Moreover, studying the time aspect of users activity can result in important conclusions about the occasional and more regular users and could help in the evaluation of users credibility. In STS, users rating process is significant because it can contribute to more efficient tag recommendation mechanisms. Furthermore, analyzing users activity over time is crucial in prediction applications which in turn can affect load balancing application and improve the STS’s performance. The main contributions of our work can be summarized as follows:
tp
– We propose a framework to measure similarity between users of an STS, in terms of both the topic and time aspect of their tagging activity. – We apply a time-aware clustering algorithm that tunes the former criteria according to a weight factor α – We carry out experiments to evaluate the proposed framework’s performance.
D ra f
The rest of the paper is organized as follows: Section 2 presents the basic notation and problem formulation. Section 3 describes the way we capture similarities between users and the proposed time-aware clustering algorithm. Section 4 presents the experimentation while conclusions are discussed in Section 5.
2
Problem Formulation
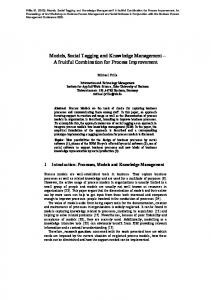
As is has been described in Section 1, a Social Tagging System is a web-based application, where users assign tags (i.e. arbitrary textual descriptions) to digital resources. The digital resources are either uploaded by users or, are, already, available in the web. The users are either “isolated” or, more commonly, members of web communities (i.e. social networks) and their main motivation (for tagging) is information organization and sharing. Let U denote the set of users, R the set of resources, T a set of tags and A the set of user annotations (i.e. tag assignments). Figure 1 depicts the basic structure of a web-based social tagging system while Table 1 summarizes the basic symbols notation used in this paper.
Table 1. Basic Symbols Notation. Symbol Definition m, n, l, p, d Number of users, resources, tags, user’s annotations and timeframes (respectively) U Users’ set {u1 , . . . , um } R Resources’ set {r1 , . . . , rn } T Tags’ set {t1 , . . . , tl } A User’s annotation set {a1 , . . . , ap }
Definition 1 (Folksonomy of an STS). Given a Social Tagging System (STS), its derived folksonomy F is defined as the tuple F = (U, R, T, A), where A ⊆ U × R × T i.e. the users’ annotation set A is modeled as a triadic relation between the other sets.
D ra f
tp
ap
er
The above definition was initially introduced in [4] and is also adopted in our approach.
Fig. 1. A web-based social tagging system.
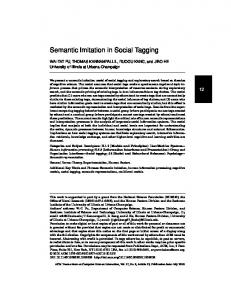
We consider a particular time period P = {1, . . . , d} of d timeframes (i.e. time intervals), during which we record users tagging activity. Two vectors Up and Tp are used to capture the temporal activity of users and tags, respectively. Specifically, for each user ui ∈ U , we define the vector Up (i, :) to track his activity: Up (i, :) = (Up (i, 1), . . . , Up (i, d))
where Up (i, j), j = 1, . . . , d indicates the number of tags user ui has assigned during the timeframe j. All the Up (i, :) vectors are organized in the m × d table Up . For the set of tags T , we similarly define the Tp two dimensional l × d table which consists of l Tp multidimensional vectors that describe each ti ∈ T , i = 1, . . . , l.
� � � �
�
�
�
�
�
�
�
�
(a) Users (Up )
� � �
�
�� � � � � �
� �
�
�
�
� �
(b) Tags (Tp )
er
Fig. 2. Temporal activity structures
Capturing Similarities
tp
2.1
ap
Example 1. In Figure 2(a), which depicts the table Up , the fact that Up (2, 1) = 4 means that the user identified as 2 has assigned 4 tags during the first timeframe. Similarly, in case of Figure 2(b), which describes Tp the fact that Tp (2, 2) = 6 indicates that the tag identified as 2 has been assigned 6 times during the second timeframe.
D ra f
The proposed framework performs users clustering considering their similarity in terms of how related the topics of their interest are and whether their tagging activity coincides in time. We consider that two users have common interests if they share common annotations at the same time periods. To measure distance between users with respect to the topic of their interests we estimate their relation with the various tags. Specifically, we define that the relation between a user ui and a tag tj corresponds to the maximum similarity between the tags that have been assigned by user ui and the tag tj .
Definition 2 (Users-Tags Similarity). The similarity SS(ui , tj ) between a user ui and a tag tj is defined as follows: SS(ui , tj ) = max(SemSim(tf , tj )), 1 ≤ f ≤ l : sum(Up (f, :)) > 0
(1)
For the estimation of the Semantic Similarity between two tags, we need to use external resources (i.e. web ontologies, thesauri, etc) and a mapping technique between tags and the resource’s concepts. In our work, we adopted the approach described in [11], due to its straightforward application to our data, according to which the semantic distance between two concepts is proportional
ap
er
to the path distance between them. For example, let tx and ty be two tags for → − − → which we want to find the semantic similarity and tx , ty be their corresponding mapping concepts via an ontology. Then, their Semantic Similarity SemSim is calculated as: 2 × depth(LCS) (2) SemSim(tx , ty ) = → − → − [depth( tx ) + depth( ty )] → − → − where depth( tx ) is the maximum path length from the root to tx and LCS is the → − → − least common subsumer of tx and ty . Thus, from equations 1 and 2 we capture the topic of interest of user ui expressed on the basis of the various tags. It should be noted, that our approach is more advantageous compared to the one that would consider a user to be related with a tag in case he has used it in his annotation. According to the proposed approach a user is related to a tag in case he has assigned one or more tags which are semantically close to the specific tag, providing, thus, a more global perspective. A common measure to capture similarity between two (same dimension) vectors is the Cosine Coefficient which calculates the cosine of the angle between them. In the proposed approach we use cosine similarity to compute time similarity between a user ui and a tag tj . The calculated similarity is higher in case that tags and users present activity at the same timeframes. Moreover, users that present high similarity with the same set of tags are expected to have a similar tagging activity over time. Definition 3. The time similarity T S(ui , tj ) between a user ui and a tag tj is defined as follows:
tp
�d Up (i, r) · Tp (j, r) Up (i, :) · Tp (j, :) = �� r=1 T S(ui , tj ) = �d |Up (i, :)| · |Tp (j, :)| d 2 2 r=1 Up (i, r) · r=1 Tp (j, r)
(3)
D ra f
Values of both SS and T S similarities fluctuate in the interval [0, 1], i.e. they are of the same scale. Since vectors Up and Tp capture users preferences in terms of topic domain and time, we can employ the squared Euclidean distance to compute their between distances. Then, the evaluation of dissimilarity between two users may be expressed by their distance that can be based either on the topic or the time locality of their preferences. When only the topic of their interests is taken into account, the distance between two users is calculated considering their relation to each of the involved tags. Their distance is then defined as: dtopic (ux , uy ) = ||SS(ux , :) − SS(uy , :)||2
When only the time locality of their activity is considered, the distance between two users is calculated over each of the d timeframes. In this case, the distance between two users ux and uy is defined as follows: dtime (ux , uy ) = ||T S(ux , :) − T S(uy , :)||2
Let Uj denote one of the k user clusters obtained from the clustering process. Membership of a user ui , where i = 1, . . . , n to a cluster Uj , where j = 1, . . . , k is defined by the function f as follows: � 1 if ui ∈ Uj f (ui , Uj ) = 0 otherwise Considering the cluster Uj , we can define its center in the topic and time feature spaces as follows: �n f (ui , Uj ) · SS(ui , :) Ctopic (j, :) = i=1 |Uj | �n Ctime (j, :) =
i=1
f (ui , Uj ) · TS(ui , :) |Uj |
Etopic =
k � �
Etime =
dtopic (ui , ctopic (j, :))
ap
j=1 ui ∈Uj
er
Then, the respective topic and time objective functions are calculated according to the following equations:
k � �
dtime (ui , ctime (j, :))
tp
j=1 ui ∈Uj
D ra f
The coupling of the two objective functions can be treated as a multiobjective optimization problem where the objective function is formulated as a weighted sum of the Etopic and Etime objective functions. We define the objective function E to capture the properties of the desired clustering solution: E = α ∗ Etopic + (1 − α) ∗ Etime
(4)
The weight factor α fluctuates in the interval [0, . . . , 1]. Then, at the one end, when α = 1, E = Etopic , i.e. our solution proposes an assignment based only on users’ topic of interest and completely discards the time aspect. At the other end, when α = 0, E = Etime and the solution is based only on time locality of users’ preferences. For any other value of α the clustering solution considers both criteria at balanced weights. Based on the above, we define the Topic & Time aware Clustering problem as follows: Problem 1 (Topic & Time aware Clustering). Given a set U of m users, a set T of l tags, a set P of d timeframes, an integer value k, and the objective function E, find a CL clustering of U into k clusters such that the E is minimized.
3
The Clustering Algorithm
The proposed clustering framework is a two-step process. In the preprocessing step from the U , T and A datasets the SS and T S similarities are computed which constitute the input to the main clustering process. The clustering process, which is also completed in two steps, assigns users to clusters giving initially priority to the topic of their interests and then refines clusters according to time information. The overall process is depicted in Figure 3.
�
�
�
�
�������������� ����� ��� ����� �� ������
�� � � � � �
� �� ��� �
���� ���� ��
� �� �� �
����
�
������� ���� ��������
er
����� ��� �� � �� ������
� ������� ���
�
� �� � ���� � � ����
�
�
��� ������� � � �� �� �
ap
� �� �
� ���� ���� ��������
�� � ������ �
tp
Fig. 3. The clustering framework.
D ra f
In the initialization step, the K-means clustering is employed to produce the k users’ clusters based on their preferences about the resources topic-domain. Next, the reassignment step begins with the former k clusters and proceeds iteratively. During each iteration, the algorithm computes the fluctuation of the objective function E caused by moving each user ui to one of the rest k − 1 clusters. If there exist some moves that lead to an improvement in the overall value of the objective function, then ui is moved to the cluster that leads to the highest improvement. If no such cluster exists, ui remains in his original cluster. The reassignment phase follows K-means idea for its convergence, ending either after a number of iterations or when the objective function improvement between two consecutive iterations is less than a minimum amount of improvement specified.
4
Experimentation
To carry out the experimentation phase and the evaluation of the proposed clustering framework, a dataset from Flickr 3 was used which consists of about 1200 3
http://www.flickr.com/
users who assigned about 2500 tags to describe a set of 6764 images that referred to four topic domains (ancient Greece, Olympics, earthquake and weddings). The time period that the tagging activity was recorded is one year (September 2007August 2008). As a source of semantic information for tag concepts, we employed the lexicon WordNet [12], which stores english words organized in hierarchies, depending on their cognitive meaning. During the preprocessing phase, we have removed tags that were not included in the wordnet database and were considered as noise. Moreover, users with very little tagging activity have been removed because there were not sufficient evidence about their interests. Thus, we have resulted in a time period of 210 days, that the remaing users have annotated images.
er
In the first section of our experimentation our purpose is to evaluate how effective the proposed clustering framework is in terms of obtaining more timeaware users clusters. We have experimented for different values of parameter α which indicates the gravity given to topic or time aspect according to Equation 4. Specifically, we have experimented with α values equal to 0.2, 0.5, 0.8 and number of clusters k = 4, 8, 12. Moreover, we studied clustering results altering the definition of timeframe, i.e. the time period on whose basis we examine the users’ actions. For example, if we divide the overall time period (210 days) in 7 intervals, then the timeframe’s duration is 30 days. In our work we have experimented defining the timeframe’s duration equal to 1, 10 and 30 days.
D ra f
tp
ap
To evaluate the performance of the proposed approach we initially depict graphically users’ temporal tagging activity according to the clustering assignement. Our goal is to examine whether the proposed clustering framework manages to identify users similarities over time and result in more accurate clusters, in terms of their preferences’ time locality. We indicatively present the results for k = 4 and timeframe’s duration equal to 10 days (i.e. we divide the overall time period into 21 intervals). In Figure 4 we can see the tagging activity over time of the members of each of the four obtained clusters at the end of the initialization step of the clustering algorithm, where only the topic domain has been considered. As it is expected, there is no convention regarding the timeframe that the users assign the tags. This holds regardless of the α parameter value since in the initialization step only the topic aspect is considered. In Figures 5, 6 and 7 we present clusters after the reassignment step for α = 0.8, 0.5 and 0.2. For α = 0.8 where more gravity is given to the topic aspects, the reassignment step does not include that many users moves since during the initialization step users are assigned in a way that the criterion of topic domain is optimized. Setting the value of α equal to 0.5 the time and topic aspects are equally considered. Thus, we expect that since the algorithm takes time parameter into account, there will not be as much diversity, in terms of time, as there was in clusters obtained at the initialization step. Indeed, as depicted in Figure 6 in two of the four obtained clusters we observe that users activity takes place at the same timeframes (10 − 12 for the third cluster and 18 − 21 for the fourth). For α = 0.2 where more gravity is given to the time aspect, we can see that, as depicted in Figure 7, the algorithm results in three clusters that contain users with iden-
120
70
100
60
60 40
50
0
80 frequency
frequency
100
100
50
80 frequency
frequency
150
40 30
60 40
20
20
10
0
0
20 0
400
300 300
20
100
20
20
200
200
10
users
users
timeframes
0 0
10 0 0
10
100
5
users
timeframes
0 0
20
200
15
50
10
100
users
timeframes
0 0
timeframes
Fig. 4. Users clusters at the end of the initialization step (α = 0.5)
150
120
250
80 70
100
200 60 50
150
frequency
60
er
50
frequency
frequency
80
frequency
100
100
40
40 30 20
50
0
0
400
users 100
20
200 100
20 100
15
users 100
10
5
0
timeframes
5
0
0
15
users
10 timeframes
10 timeframes
50 5 0
0
0
tp
0
150
20
200
15
users
10 timeframes
5 0
0
300
20 15
200
10
0
300 300
ap
20
D ra f
Fig. 5. Users clusters at the end of the reassignment step (α = 0.8)
120
120
100
100
80
80
100
60 40
80
frequency
frequency
frequency
80
60 40
frequency
100
60 40
60 40
20
20
20
20
0
0
0
0 150
600
300
20
400
users
0 0
users
20 50
10
100
timeframes
100
20
200
10
200
0 0
users
timeframes
20
100 50
10 0 0
10
users
timeframes
0 0
timeframes
Fig. 6. Users clusters at the end of the reassignment step (α = 0.5)
120
120
100
100
80
80
120
100
100
40
60 40
60 40
20
20
20
0
0 150
0
100
20 50
users
timeframes
20
100
users
timeframes
40
80
10 0 0
60
0
600
20
400
50
80
20
800
10 0 0
frequency
60
frequency
frequency
frequency
80
10
200 users
0 0
timeframes
20
60 40
10
20 users
0 0
Fig. 7. Users clusters at the end of the reassignment step (α = 0.2)
timeframes
tical temporal preferences. Users with different preferences in time have been assigned to the third cluster. Experimenting with a higher number of clusters we have concluded that users of the third cluster can be furthermore divided and assigned to clusters where no such diversity in their behavior exists.
Table 2. Objective function improvements. of clusters 8 12 30.57% 47.37% 62.82% 74.56% 91.6% 92.27% 25.02% 50.77% 75.42%
er
3.31% 42.06% 72.92% 3.31% 42.06% 72.92%
25.02% 50.77% 75.42%
ap
α = 0.2 Number Timeframe duration 4 1 9.25% 10 41.6% 30 53.68% α = 0.5 1 0.06% 10 25.68% 30 38.1% α = 0.5 1 0.06% 10 25.68% 30 38.1%
D ra f
tp
Next, we use objective function values to evaluate the clustering results for the different α values and different timeframe definitions. In general, the objective function expresses the sum of distances of each user belonging to a cluster from the cluster’s centre and thus lower values of it indicate a better clustering scheme. Table 2 presents the improvements percentages (due to the decrease of objective function) for different values of α and timeframe’s duration. According to the results, we can see that in all cases, lower values of α result in higher improvements since in that case more gravity is given to the time aspect. Thus, the initial clusters that were created according to the topic domain of users preferences will be considerably refined to achieve optimization in terms of time criterion. Moreover, we observe that an increase in timeframe’s duration results in higher improvements. This is due to the sparseness that our dataset presents, i.e. during the time period of 210 days, both users and tags do not present frequent tagging activity. Thus when we create more compact time structures, tables Up and Tp become less sparse resulting in higher values of similarity between users and tags (calculated using Cosine Coefficient). Consequently, the T S table carries information that diversify users more causing more reassignments and higher improvements in objective function values. The appropriate definition of timeframe differentiates according to the dataset nature and significantly affect the clustering results.
5
Conclusions
This paper proposes a framework to incorporate time aspect while clustering users of a Social Tagging System. According to the presented approach an initial set of users clusters is created where users are assigned to clusters according to the topic-domain of their interests as indicated by the tags they have assigned to describe resources. Then, users clusters are refined according to the time locality of their tagging activity resulting in more enriched and time-aware clustering results. The results of the proposed approach can be beneficial for the identification of regular and non regular users, tagging recommendation systems (e.g. identifying a user’s summer interests), prediction mechanisms and load balancing applications e.t.c.
References
D ra f
tp
ap
er
1. Vander Wal: Explaining and showing broad and narrow folksonomies. Blog post 2005-02-01. http://www.vanderwal.net/random/category.php?cat=153 2. Gemmell, J. and Shepitsen, A. and Mobasher, M. and Burke, R.: Personalization in Folksonomies Based on Tag Clustering. In: 6th Workshop on Intelligent Techniques for Web Personalization and Recommender Systems, pp. 259–266. ACM, Chicago, Illinois, USA (2008) 3. Diederich, J. and Iofciu, T.: Finding communities of practice from user profiles based on folksonomies. In: 1st International Workshop on Building Technology Enhanced Learning Solutions for Communities of Practice, Crete, Greece (2006) 4. Hotho, A., Jaschke, R., Schmitz and C. Stumme, G.,: Information Retrieval in Folksonomies : Search and Ranking. In: Sure, Y. and Domingue, J. (eds.) The Semantic Web: Research and Applications. LNCS, vol. 4011, pp. 411–426. Springer, June (2006) 5. Au Yeung, C. M., Gibbins, N. and Shadbolt, N.: Discovering and Modelling Multiple Interests of Users in Collaborative Tagging Systems. In: 2008 IEEE/WIC/ACM International Conferences on Web Intelligence and Intelligent Agent Technology Workshops, Sydney, Australia (2008) 6. Dichev, C., Xu, J., Dicheva, D. and Zhang, J.: A Study on Community Formation in Collaborative Tagging Systems. In: IEEE/WIC/ACM International Conference on Web Intelligence and Intelligent Agent Technology, pp. 13–16. IEEE Computer Society, Sydney, Australia (2008) 7. Shepitsen, A., Gemmell, J., Mobasher, B. and Burke, R.: Personalized recommendation in social tagging systems using hierarchical clustering. In: 2008 ACM conference on Recommender systems, pp. 259–266. ACM, NY, USA (2008) 8. Michlmayr, E. and Cayzer, S.: Learning User Profiles from Tagging Data and Leveraging them for Personal(ized) Information Access. In: 16th International World Wide Web Conference (WWW2007) Workshop on Tagging and Metadata for Social Information Organization, (2007). 9. Au Yeung, C. M., Gibbins, N. and Shadbolt, N. : A Study of User Profile Generation from Folksonomies. In: Social Web and Knowledge Management, Social Web 2008 Workshop at WWW2008, Beijing, China. 10. Petridou, S., Koutsonikola, V., Vakali, A., Papadimitriou, G.: Time Aware Web Users Clustering. IEEE Transactions on Knowledge and Data Engineering. 20(5), 653–667 (2008)
D ra f
tp
ap
er
11. Wu, Z. and Palmer, M. : Verm semantics and lexical selection. In: 32nd annual meeting of the association for computational linguistics,pp. 133-138, Las Cruces, New Mexico,(1994). 12. Fellbaum: WordNet, an electronic lexical database. The MIT Press(1990).