bioRxiv preprint first posted online Aug. 19, 2018; doi: http://dx.doi.org/10.1101/395723. The copyright holder for this preprint (which was not peer-reviewed) is the author/funder, who has granted bioRxiv a license to display the preprint in perpetuity. It is made available under a CC-BY-NC 4.0 International license.
Clustering of the structures of protein kinase activation loops: A new nomenclature for active and inactive kinase structures Vivek Modi Roland L. Dunbrack, Jr.* Institute for Cancer Research Fox Chase Cancer Center Philadelphia PA 19111 *
[email protected]
1
bioRxiv preprint first posted online Aug. 19, 2018; doi: http://dx.doi.org/10.1101/395723. The copyright holder for this preprint (which was not peer-reviewed) is the author/funder, who has granted bioRxiv a license to display the preprint in perpetuity. It is made available under a CC-BY-NC 4.0 International license.
Abstract Targeting protein kinases is an important strategy for intervention in cancer. Inhibitors are directed at the conserved active conformation or a variety of inactive conformations. While attempts have been made to classify these conformations, a structurally rigorous catalogue of states has not been achieved. The kinase activation loop is crucial for catalysis and begins with the conserved DFGmotif (Asp-Phe-Gly). This motif is observed in two major classes of conformations, DFGin - an ensemble of active and inactive conformations where the Phe residue is in contact with the C-helix of the N-terminal lobe, and DFGout - an inactive form where Phe occupies the ATP site exposing the C-helix pocket. We have developed a clustering of kinase conformations based on the backbone dihedral angles of the sequence X-D-F, where X is the residue before the DFGmotif, and the DFG-Phe side-chain rotamer, utilizing a density-based clustering algorithm. We have identified 8 distinct conformations and labeled them based on their Ramachandran regions (A=alpha, B=beta, L=left) and the Phe rotamer (minus, plus, trans). Our clustering divides the DFGin group into six clusters including ‘BLAminus,’ which contains active structures, and two common inactive forms, ‘BLBplus’ and ‘ABAminus.’ DFGout structures we have are predominantly in the ‘BBAminus’ conformation, which is essentially required for binding Type II inhibitors. Structural features such as the C-helix position and the overall activation loop conformation are strongly associated with our clusters. Our structurally intuitive nomenclature will aid in understanding the conformational dynamics of these proteins and structure-based development of kinase drugs.
2
bioRxiv preprint first posted online Aug. 19, 2018; doi: http://dx.doi.org/10.1101/395723. The copyright holder for this preprint (which was not peer-reviewed) is the author/funder, who has granted bioRxiv a license to display the preprint in perpetuity. It is made available under a CC-BY-NC 4.0 International license.
Significance statement Protein kinases play important roles in different signaling pathways and are widely studied as drug targets. Their active site exhibits remarkable structural variation as observed in the large number of available crystal structures which are determined in apo-form and in complex with natural ligands and inhibitors. We have developed a clustering scheme and nomenclature to categorize and label all the observed conformations in human protein kinases. This has enabled us to clearly define the geometry of the active state and to distinguish closely related inactive states which were previously not characterized. We believe that our classification of kinase conformations will help in better understanding the conformational dynamics of these proteins and the development of inhibitors against them.
3
bioRxiv preprint first posted online Aug. 19, 2018; doi: http://dx.doi.org/10.1101/395723. The copyright holder for this preprint (which was not peer-reviewed) is the author/funder, who has granted bioRxiv a license to display the preprint in perpetuity. It is made available under a CC-BY-NC 4.0 International license.
INTRODUCTION Phosphorylation is a fundamental mechanism by which signaling pathways are regulated in cells (1). Protein kinases are cellular sentinels which catalyze the phosphorylation reaction by transferring the γ-phosphate of an ATP molecule to Ser, Thr, or Tyr residues of the substrate (2). Due to their crucial role in the functioning of the cell, protein kinases are tightly regulated. Dysregulation leading to either loss or gain of kinase activity may result in variety of disorders including cancer, inflammation, infection, and neurodegeneration (3-5), making development of compounds for modulating kinase activity an important therapeutic strategy (6). The human genome contains ~500 protein kinases that share a common fold. They are divided broadly into nine groups based on their sequences and structures (1). The typical kinase structure (Fig. 1A) contains two lobes: an N-terminal lobe (N-lobe), consisting of a five stranded βsheet with an α-helix called the C-helix, and a C-terminal lobe (C-lobe) comprising six α-helices. These two lobes are connected by a flexible hinge region forming the ATP binding site in the middle of the protein. The active site comprises several structural elements that are crucial for enzymatic activity. The N-lobe has a Gly-rich GxGxxG motif called the Gly rich loop, which stabilizes the phosphates of the bound ATP molecule during catalysis. The activation loop is typically 20-30 residues in length beginning with a conserved DFG (almost always Asp-Phe-Gly, sometimes AspLeu-Gly or Asp-Trp-Gly) motif and extending up to an APE (Xxx-Pro-Glu, usually Ala-Pro-Glu) motif. In active kinase structures, this loop forms a cleft that binds substrate. Bound substrate peptide forms specific interactions with the conserved HRD motif (His-Xxx-Asp, usually His-Arg-Asp) which occurs in the catalytic loop of the protein. The regulation of the activity of a kinase is achieved in part by the plasticity of these elements of the structure (7, 8). Kinases are molecular switches which toggle between ‘on/active’ and multiple ‘off/inactive’ states. The most common mechanism of activating a kinase is the trans auto-phosphorylation of specific residues in the activation loop resulting in an extended conformation exposing a surface 4
bioRxiv preprint first posted online Aug. 19, 2018; doi: http://dx.doi.org/10.1101/395723. The copyright holder for this preprint (which was not peer-reviewed) is the author/funder, who has granted bioRxiv a license to display the preprint in perpetuity. It is made available under a CC-BY-NC 4.0 International license.
cleft which facilitates binding of substrates (9). The catalytically active state of a kinase requires a unique assembly of these elements that create an environment conducive to the phosphotransfer reaction. In the active state, the activation loop is fully extended with the DFG-Asp residue facing the ATP binding pocket and the DFG-Phe side chain occupying a hydrophobic pocket adjacent to the
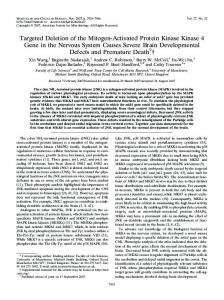
Fig. 1. Representative examples of different conformations observed in protein kinases. A) DFGin-active-like - INSR (1GAG_A (chain A)); B) DFGout - INSR (3ETA_A); C) DFGin-inactive form - SRC (4K11_A); and D) Intermediate conformation - AURKA (4JBQ_A).
5
bioRxiv preprint first posted online Aug. 19, 2018; doi: http://dx.doi.org/10.1101/395723. The copyright holder for this preprint (which was not peer-reviewed) is the author/funder, who has granted bioRxiv a license to display the preprint in perpetuity. It is made available under a CC-BY-NC 4.0 International license.
C-helix (sometimes referred to as ‘the back pocket’). Since the DFG-Asp residue occupies the ATP binding pocket in this conformation, it is often referred to as the ‘DFGin state’ (Fig. 1A). Moreover, the active state exhibits an inward disposition of the C-helix coupled with the Gly rich loop by a salt bridge interaction between a conserved Lys residue in the β3 strand and a Glu residue in the Chelix. Kornev and Taylor have postulated that the active state requires assembly of a ‘regulatory spine’ which is a vertical arrangement of four contacting residues which belong to different regions of the protein (10). These residues consist of the conserved HRD-His from the catalytic loop, DFGPhe from the activation loop, and two hydrophobic residues, one from the C-helix and one from the β4 strand. Although the active state of a kinase requires a unique arrangement of structural elements, the protein itself is far from rigid. The catalytic cycle of a kinase is a multi-step process which includes ATP binding, substrate binding, phosphoryl transfer, and product release. The active form of a kinase exhibits opening and closing movements which are required to provide access to ATP and substrate and release of ADP and product (11, 12). Many crystal structures have captured the open, closed and intermediate states of kinases in ATP/ADP complex or apo-form with and without substrate (13). The conformational changes involving opening and closing of the active site cleft are primarily achieved by movement in the Gly rich loop and the C-helix. Although there are exceptions to the rule, both the Gly rich loop and the C-helix are usually in an ‘inward’ orientation in the ternary complex with both ATP (or its analogues) and substrate bound. However, binary complexes (only ATP/analogue-bound) and the apo-form (no ATP/analogue bound) are observed in a range of closed, open, and intermediate conformations. The ‘off/inactive’ state of a kinase does not have the chemical constraints required for catalytic activity and therefore kinases exhibit multiple inactive conformations (14). Typically, in an inactive conformation the activation loop is collapsed onto the surface of the protein, blocking substrate binding and rendering the kinase catalytically inactive. In one common inactive 6
bioRxiv preprint first posted online Aug. 19, 2018; doi: http://dx.doi.org/10.1101/395723. The copyright holder for this preprint (which was not peer-reviewed) is the author/funder, who has granted bioRxiv a license to display the preprint in perpetuity. It is made available under a CC-BY-NC 4.0 International license.
conformation, DFG-Phe and DFG-Asp swap positions. This conformation is called DFGout (as opposed to DFGin) where DFG-Phe occupies the ATP binding pocket and DFG-Asp is out of the active site (Fig. 1B). However, there are other diverse structures from multiple kinases where DFGPhe remains either adjacent to the C-helix but in a different orientation (and sometimes position) from that of active DFGin structures or in positions intermediate between the typical DFGin and DFGout states (Fig. 1C and 1D). The many inactive, non-DFGout conformations have been variously referred to as pseudo DFGout, DFGup, SRC-like inactive and atypical DFGout (15-17). Although, DFGin and DFGout are broadly recognized groups of conformations, a consensus nomenclature for the inactive states is lacking. The widely studied DFGin and DFGout conformations form the basis of grouping the inhibitors developed against these proteins into two main categories (18, 19). Molecules such as staurosporine and dasatinib which occupy the ATP pocket only are called Type I inhibitors. Inhibitors like imatinib (Gleevec) which bind to the DFGout state (20), are called Type II inhibitors. In addition to occupying the ATP-binding site, they also extend into the hydrophobic allosteric pocket underneath the C-helix (21), which is unoccupied in the DFGout conformation. Type II inhibitors are thought to be more specific than Type I inhibitors, but Zhao and coworkers have recently shown that even Type II inhibitors display promiscuity (22). Recently, inhibitors like GNF2 have been developed which bind to a pocket distal to the active site, allosterically affecting ATP binding (Type III) or inhibiting interaction of the kinase with regulatory proteins (Type IV) (23). Currently, there are about thirty small-molecule kinase inhibitors approved by the FDA but none of them exhibit selective binding to a unique kinase (24). Large-scale screening of known inhibitors has shown their promiscuity even to phylogenetically distant kinases (25). Design of better inhibitors could be guided by a better understanding and classification of the conformational variation observed in kinases.
7
bioRxiv preprint first posted online Aug. 19, 2018; doi: http://dx.doi.org/10.1101/395723. The copyright holder for this preprint (which was not peer-reviewed) is the author/funder, who has granted bioRxiv a license to display the preprint in perpetuity. It is made available under a CC-BY-NC 4.0 International license.
Since the first X-ray structure of a protein kinase was solved in 1991, that of cyclic AMPdependent protein kinase (PKA) (26), the number of mammalian kinase structures in the Protein Data Bank (PDB) has risen to ~3300 entries containing ~4800 polypeptide chains from ~240 kinases capturing the remarkable conformational diversity of this protein family (27). There have been some attempts to classify kinase conformations and to study inhibitor interactions. Jacobs and coworkers grouped 426 structures of 71 kinases into three clusters representing one active and two inactive forms based on the orientations of the C-helix and the activation loop (28). Their primary focus was to classify active and inactive states, while the flexibility observed in multiple inactive forms was not separately addressed. Brooijmans and colleagues used distances from conserved regions in the catalytic site as a reference point to classify orientations of the DFGmotif into DFGin and DFGout conformations (29). They did not classify active and inactive states among the DFGin structures and did not consider the activation loop conformation in their classification. Möbitz has performed a quantitative classification of all the mammalian kinases using pseudo dihedral angles of four consecutive Cα atoms of the residues of the DFGmotif and its neighbors and its distance from the C-helix (30). This resulted in a scheme dividing kinase conformations into twelve categories. The labels are based on their pseudo dihedral angles of X-DFG and DFG-X, such as ‘FG-down,’ ‘FG-down αC-out,’ ‘G-down αC-out,’ ‘A-under P BRAF,’ ‘A-under P-IGF1R,’ etc. Recently, Ung and coworkers used a similar idea of using two directional vectors for the DFGmotif residues and the distance from the C-helix to classify kinases into five groups, C-helix-in-DFGin (CIDI), C-helix-in-DFGout (CIDO), C-helix-out-DFGin (CODI), C-helix-out-DFGout (CODO), and omega (31). Some other classification schemes have emphasized the binding modes of inhibitors. The KLIFS database contains a classification based on a visual assessment of DFGin, DFGout, and DFGout-like conformations and their patterns of inhibitor interactions across kinases (15). They included a classification of C-helix-in/out conformations. KIDFamMap also classifies kinase 8
bioRxiv preprint first posted online Aug. 19, 2018; doi: http://dx.doi.org/10.1101/395723. The copyright holder for this preprint (which was not peer-reviewed) is the author/funder, who has granted bioRxiv a license to display the preprint in perpetuity. It is made available under a CC-BY-NC 4.0 International license.
conformations in several groups based on DFG orientation, the activation loop conformation and inhibitor contacts (32). In our previous work, we identified kinase structures capable of binding Type II inhibitors by calculating the distance of the DFG-Phe from two conserved residues in the catalytic binding site. Based on this simple idea, we identified the most common DFGout conformations in which DFG-Phe is completely moved into the ATP pocket as opposed to an intermediate state (33). We used this classification to compare the binding pocket volume of DFGout state with the intermediate conformations to understand their relation to Type II inhibitor binding. In this paper, we present a new clustering and classification of the conformational states of protein kinases that addresses some of the deficiencies of previous such efforts. These deficiencies include either too few or too many structural categories, failing to distinguish active structures from DFGin inactive conformations, and an inability to automatically classify new structures added to the PDB. In the current work, we have clustered all the human kinase structures at two levels of structural detail. First, at a broader level we grouped all the kinase structures into three categories depending on the spatial position of the DFG-Phe side chain. These three groups are labeled the DFGin, DFGout and DFGinter (intermediate) conformations. Second, we clustered each of the three spatial groups at a finer level based on the backbone dihedral angles ϕ and ψ of three residues: the residue preceding the DFGmotif (X-DFG), the DFG-Asp residue, and the DFG-Phe residue, as well as the χ1 side-chain dihedral angle of the DFG-Phe residue. This produced a total of eight clusters - six for DFGin, and one cluster each for the DFGout and DFGinter groups providing a systematic nomenclature addressing the observed conformations of human kinases. Our nomenclature is more intuitive to structural biologists than the pseudo-dihedral nomenclature. It is based on the regions of the Ramachandran map occupied by the X,D and F residues of the X-DFG motif (‘A’ for alpha helical region, ‘B’ for beta sheet region, ‘L’ for left-handed helical region) and the χ1 rotamer of the Phe side chain (minus for the -60° rotamer; plus for the 9
bioRxiv preprint first posted online Aug. 19, 2018; doi: http://dx.doi.org/10.1101/395723. The copyright holder for this preprint (which was not peer-reviewed) is the author/funder, who has granted bioRxiv a license to display the preprint in perpetuity. It is made available under a CC-BY-NC 4.0 International license.
+60° rotamer; and trans for the 180° rotamer). For example, the active-like state of kinases is designated ‘BLAminus’ and is the most commonly observed conformation of kinases in the PDB. We have clearly defined structural features of the catalytically primed active state of a kinase. Further, we also clearly define different kinds of DFGin conformations which were previously grouped together. The most common inactive DFGin conformations are BLBplus and ABAminus. The Type IIbinding DFGout state is labeled BBAminus. Overall, our clustering and nomenclature scheme provides a structural catalogue of human kinase conformations which will provide deeper insight into the structural variation of these proteins, benefitting structure-guided drug design. RESULTS The data set and identification of conserved motifs Human protein kinases in the PDB were identified by using PSI-BLAST (34) with the sequence of Aurora A kinase as query. We excluded kinases classified by Pfam (35) as Alphakinases or PI3-PI4 kinases, which are distantly related to canonical protein kinases but possess highly divergent folds (36, 37). The structures with DFGmotif residues mutated or unresolved were also removed. This led to a dataset with 244 human kinase domain sequences with known structures (including 11 pseudokinases) from 3343 PDB entries, having 4834 polypeptide chains containing kinase domains (some asymmetric units have multiple copies of the kinase). To investigate certain features of our clustering in greater detail we have also defined a subset containing crystal structures with resolution better than 2.25Å and unambiguous electron density for the X-DFG, DFG-Asp and DFG-Phe residues (Methods). This filtered dataset contains 153 kinases from 1332 PDBs having 1645 chains. Both lists are contained in Supporting Information. The conserved motifs were identified from sequence and structure alignment of all the kinases with the sequence and structure of Aurora A kinase from PDB entry 3E5A (38). The residues of interest include the DFG and APE motifs bounding the activation loop, the Glu of the C10
bioRxiv preprint first posted online Aug. 19, 2018; doi: http://dx.doi.org/10.1101/395723. The copyright holder for this preprint (which was not peer-reviewed) is the author/funder, who has granted bioRxiv a license to display the preprint in perpetuity. It is made available under a CC-BY-NC 4.0 International license.
helix and Lys of the β3 strand of the N-terminal domain, the HRD motif, the conserved Asn in catalytic loop (HRDxxxxN) and the Gly-rich loop. Clustering kinase conformations based on spatial location of the DFG-Phe residue Phosphorylation of the activation loop is a common activation mechanism of many kinases, affecting its conformation and facilitating substrate binding. The active state catalytic cycle of a kinase consists of a range of open and closed states which allow binding of ligands and cofactors and release of products. To identify a set of structures where the catalytic machinery is primed to catalyze the phosphorylation reaction and the activation loop orientation is conducive to substrate binding we selected structures that satisfy the following criteria: 1) resolution better than equal to 2.25 Å; 2) ATP or a triphosphate analogue bound to the active site (PDB ligand codes: ATP, ANP, ACP or AGS); 3) Mg2+ or Mn2+ ion bound in the active site; and 4) a phosphorylated Ser, Thr or Tyr residue in the activation loop. Not all kinases require a phosphorylated residue in the activation loop for activity but its presence is usually indicative of an active kinase structure. This led to the identification of a set of 28 chains from 12 kinases (listed in Table S1). We refer to this conformation as the 'catalytically primed state'. To define the geometry of the active site in these structures we have investigated the conformation of the activation loop beginning with the residue preceding the DFGmotif (X-DFG). By examining the backbone conformation of X-D-F-G residues and side chain orientation of DFG-Asp and DFG-Phe we made several observations. First, the backbone conformation of the X-D-F-G residues was observed in the beta (B), left (L), alpha (A), and alpha (A) regions of the Ramachandran map, respectively (Fig. 2). Second, the DFG-Phe side chain adopts a χ1 gauche-minus rotamer (χ1~ -60°; χ2~ 90°) and points slightly downward into a pocket underneath the C-helix. Third, we observe that for all of these structures the DFG-Asp adopts a χ1 trans rotamer (~180°) and the χ2 dihedral is ~0°. This places the Asp carboxylate atoms in a position to chelate an 11
bioRxiv preprint first posted online Aug. 19, 2018; doi: http://dx.doi.org/10.1101/395723. The copyright holder for this preprint (which was not peer-reviewed) is the author/funder, who has granted bioRxiv a license to display the preprint in perpetuity. It is made available under a CC-BY-NC 4.0 International license.
Mg2+/Mn2+ ion, which then forms a tight interaction with an oxygen atom on the β-phosphate group, and to act as hydrogen bond acceptor for the donor NH atom of DFG-Gly. Fourth, the phosphorylated activation loop is extended. In this conformation, the backbone of the sixth residue of the activation loop (DFGxxX) forms a hydrogen bond with the backbone of the residue preceding the HRD motif (X-HRD). This analysis shows that the geometry of the X-D-F-G residues in the catalytically primed state is under strict restraints.
Fig. 2. Geometry of structures with activation loop phosphorylated and in complex with a triphosphate and Mg2+/Mn2+ ion. Ramachandran plot of residues A) X-DFG, B) DFG-Asp, C) DFG-Phe and D) DFG-Gly. Distribution of dihedral angles for E) DFG-Asp χ1, F) DFG-Asp χ2, G) DFG-Phe χ1 and H) DFG-Phe χ2. The list of structures is provided in Table S1. Ramachandran regions alpha (A), beta (B), left-handed (L), and ε (E) are labeled in each panel.
In inactive states of kinases, the DFG motif can take on a wide variety of conformations. The well known DFGin and DFGout classes describe the rough position of the Asp and Phe residues of the DFG motif but fail to capture how these positions are attained. Intermediate states between DFGin and DFGout have also been described (39). As the position of the Phe side chain and the Ramachandran map and side-chain rotamers were very distinctive for the catalytically primed
12
bioRxiv preprint first posted online Aug. 19, 2018; doi: http://dx.doi.org/10.1101/395723. The copyright holder for this preprint (which was not peer-reviewed) is the author/funder, who has granted bioRxiv a license to display the preprint in perpetuity. It is made available under a CC-BY-NC 4.0 International license.
state, we decided to investigate whether the various inactive states could be described as readily by the same parameters. To classify and label them, we first grouped them by the location of the DFGPhe ring, and then clustered them by the backbone and side chain dihedral angles of the N-terminal residues of the activation loop. To automatically capture the location of DFG-Phe residue, we calculated its distance from two conserved residues in the binding site (Fig. 3A):
Fig. 3. Clustering based on the spatial region occupied by DFG-Phe within the kinase domain. A) Representative example displaying the conserved residues and the distances between them used for clustering; B) Distance plot showing three spatial groups. X-axis displays the distance between αC-Glu(+4)-Cα and DFG-Phe-Cζ atoms. Y-axis displays the distance between β3-Lys-Cα and DFG-Phe-Cζ. DFGin, DFGout and DFGinter groups are colored pink, green and blue, respectively. The pink colored inverse triangles are high resolution (2.25 Å or better) kinase structures in active state (Triphosphate, Mg2+/Mn2+ ion complex with activation loop phosphorylated). The green colored inverse triangles are structures in complex with Type II inhibitors identified by visual inspection. The full list of structures is provided in Table S2.
1) αC-Glu(+4)-Cα / DFG-Phe-Cζ - This distance is between the Cα atom of the fourth residue after the conserved Glu residue in the C-helix (ExxxX) and the Cζ atom of the DFG-Phe residue in the activation loop. Even as the αC helix moves outward, this residue does not move significantly since it is located closer to the pivot point of the helix toward the back of the kinase N-terminal domain. The distance of this residue to the outermost Phe ring atom captures whether the DFG-Phe remains under or adjacent to the C-helix or has moved away thus providing an estimate of the lateral
13
bioRxiv preprint first posted online Aug. 19, 2018; doi: http://dx.doi.org/10.1101/395723. The copyright holder for this preprint (which was not peer-reviewed) is the author/funder, who has granted bioRxiv a license to display the preprint in perpetuity. It is made available under a CC-BY-NC 4.0 International license.
orientation of the Phe ring. It serves to distinguish DFGin structures, where the Phe ring is adjacent to or under the C-helix, from DFGout structures, where the ring has moved a substantial distance from the C-helix. 2) β3-Lys-Cα / DFG-Phe-Cζ - This distance is between the Cα atom of the conserved Lys residue from the β3 strand to the Cζ atom of the DFG-Phe side chain. It captures the closeness of DFG-Phe to the N-lobe β-sheet strands, thus giving an estimate of the upward orientation of the Phe ring. This distance distinguishes DFGin conformations from orientations observed in some kinases such as Aurora A where the Phe ring is in an intermediate position between DFGin and DFGout. These distances are plotted against each other in Fig. 3B. We have clustered these distances into three groups using average linkage hierarchical clustering. The choice of three groups in clustering algorithm was guided by the visual inspection of large number of structures suggesting three broad regions or pockets occupied by DFG-Phe residue. Based on this we have classified the kinase structures into the following three groups: a) DFGin: This is the largest group, consisting of 4,333 chains (89.6%) from 227 kinases shown in pink colored points in Fig. 3B, representing the DFGmotif orientations where DFG-Phe is packed in a pocket under the C-helix (Fig. 1A and 1C). It consists of many related conformations with the typical DFGin active orientation forming the largest subset of this group. All the catalytically primed structures with a triphosphate and Mg2+/Mn2+ ion bound and phosphorylated activation loop belong to this group (pink colored triangles in Fig. 3B). b) DFGout: This is the second largest group, consisting of 388 chains (8%) from 60 kinases, displayed in green colored points representing the structures where DFG-Phe is moved into the ATP binding pocket (Fig. 1B). The structures with a Type II inhibitor bound form a subset of this group (green colored triangles in Fig. 3B). c) DFGinter (DFGintermediate): This is the smallest group, consisting of 113 chains (2.3%) from 27 kinases, shown in blue colored points, in which the DFG-Phe side chain is out of the C-helix 14
bioRxiv preprint first posted online Aug. 19, 2018; doi: http://dx.doi.org/10.1101/395723. The copyright holder for this preprint (which was not peer-reviewed) is the author/funder, who has granted bioRxiv a license to display the preprint in perpetuity. It is made available under a CC-BY-NC 4.0 International license.
pocket but has not moved completely to a DFGout conformation (Fig. 1D). In most of these cases DFG-Phe is pointing upwards towards the β-sheets dividing the active site into two halves. Dodson and coworkers had previously referred to this conformation in Aurora kinase as ‘DFGup’ (40). Recently, Ung and coworkers have also identified this conformation and labeled it as ωCD (31). Clustering kinase conformations based on the backbone of activation loop For the DFG-Phe side chain to exhibit such wide-ranging localization within the kinase domain fold, the backbone and side-chain dihedral angles leading up to the Phe side chain must be highly divergent. By examining a large number of structures, we observed that the structural variation of the activation loop begins with the residue that precedes the DFG motif (‘X-DFG’). To precisely determine how the Phe side chain reaches its position and orientation, we therefore chose to cluster the conformation of the activation loop using a metric based on the backbone dihedrals φ and ψ of X-DFG, DFG-Asp and DFG-Phe as well as the first side-chain dihedral of the DFG-Phe residue. The backbone of Gly residue exhibits high flexibility and therefore was not included in the clustering. Each kinase chain is represented by a vector of these seven dihedrals. The distance between these vectors is calculated by a metric from directional statistics (41), which we used previously in our work on clustering antibody CDR loop conformations (42). For each dihedral angle pair (e.g. φ of residue X in two different structures), the distance is equal to the square of the chord length between the ends of two vectors originating at the center of a unit circle:
D (θ1,θ 2 ) = 2 (1− cos (θ1 − θ 2 ))
(1)
The distance between two segments can be computed by summing up the distance between all the dihedrals under consideration and taking an average:
( (
) ( ) (
) ( ) (
) )
(
)
X X X X D D D D 1 ⎛ D φi , φ j + D ψ i ,ψ j + D φi , φ j + D ψ i ,ψ j + ⎞ D ( i, j ) = ⎜ ⎟ 7 ⎜⎝ D φiF , φ jF + D ψ iF ,ψ Fj + D χ1iF , φ1Fj ⎟⎠
(2)
15
bioRxiv preprint first posted online Aug. 19, 2018; doi: http://dx.doi.org/10.1101/395723. The copyright holder for this preprint (which was not peer-reviewed) is the author/funder, who has granted bioRxiv a license to display the preprint in perpetuity. It is made available under a CC-BY-NC 4.0 International license.
The factor of 2 is unnecessary and was not used by Mardia and Jupp (41), but we have included it to be consistent with our earlier work (42).
Fig. 4. DBSCAN based clustering of the DFGin group of structures. A) Ramachandran plot of X-DFG, DFG-Asp and DFG-Phe residues (bottom to top) factored by six clusters (left to right). Beginning from the second column, each column represents a cluster labeled by the Ramachandran region occupied by the backbone of the three residues (see Fig. 2A for definitions). The first column shows the noise points which are not members of any cluster. Ramachandran region occupied by the three residue in each cluster are labeled on the top as BLA, BLA, ABA, BLB, BLB and BLB. B) Distribution of DFG-Phe side chain χ1 dihedral in each cluster. Each rotamer type is labeled on the top. C) Ramachandran plot of DFG-Gly residue in each cluster. The pink dots represent kinase structures with phosphorylated activation loops and in complex with a triphosphate and Mg/Mn ion.
16
bioRxiv preprint first posted online Aug. 19, 2018; doi: http://dx.doi.org/10.1101/395723. The copyright holder for this preprint (which was not peer-reviewed) is the author/funder, who has granted bioRxiv a license to display the preprint in perpetuity. It is made available under a CC-BY-NC 4.0 International license.
The distance matrix calculated with this metric was used as input to DBSCAN (Densitybased spatial clustering of applications with noise) which is a density-based clustering algorithm (43). DBSCAN identifies relevant clusters in the data based on their overall density. Given a set of points it groups together the points that are connected by high density with each other while identifying the points in low density regions as noise. It requires two parameters, ε and MinPts. Data points with at least MinPts points within a distance ε are considered ‘core points’. Points within ε of a core point but not themselves core points are called border points. All other points are considered noise. If we make a graph by treating the core points as nodes and place edges between them if they are within ε of each other, then the clusters are identified as the connected subgraphs of the whole graph. Border points are then assigned to the cluster that contains the closest core point to the border point. The noise points are not assigned to clusters. The choice of appropriate parameters is critical for the clusters and require experience and the investigator’s intuition about a clustering that makes sense. The value of MinPts is approximately equal to the smallest cluster that the procedure will return. If ε is too small, some clusters will be inappropriately subdivided into many small, dense clusters. If ε is too large, adjacent clusters may be merged. We have an advantage that protein φ, ψ dihedral angle pairs naturally cluster within the Ramachandran map. In addition, outliers are easily identified in forbidden regions of φ, ψ space. We used these features to scan through pairs of ε, MinPts values for each spatial group separately (DFGin, DFGout, DFGinter), minimizing the number of points identified as noise without visibly merging clusters representing distinct basins of the Ramachandran map. For the DFGin group we obtained six clusters using the parameters ε = 0.05 and MinPts = 20 (Fig. 4A). To annotate the residues occupying different regions we have broadly divided the Ramachandran map based on the regular secondary structure associated with it. The broad conformational classes include A (α-helix region: φ12 Å) (Tables 3). This distance is roughly characteristic of the ability of the kinase to form the Glu-Lys salt bridge, regardless of whether the side-chain atom positions of these residues were resolved in the structure. Although, the C-helix disposition is not a part of our labeling scheme, we have included its conformations as an additional feature to the clusters (Table S2). In the BLAminus cluster, which includes the catalytically primed conformation of kinases, the C-helix is in an inward orientation in 94% of the structures, reflecting an intact salt bridge in almost all of these structures. Among the other DFGin clusters, ABAminus has the highest frequency of chains in a C-helix-in conformation (75%). However, the large BLBplus cluster is strongly 22
bioRxiv preprint first posted online Aug. 19, 2018; doi: http://dx.doi.org/10.1101/395723. The copyright holder for this preprint (which was not peer-reviewed) is the author/funder, who has granted bioRxiv a license to display the preprint in perpetuity. It is made available under a CC-BY-NC 4.0 International license.
associated with a C-helix-out conformation (70%). In this cluster the g-plus rotamer of DFG-Phe points upwards, changing the activation loop conformation and pushing the C-helix outward. We have observed in some structures that the BLBplus conformation creates an extra volume adjacent to the ATP binding pocket, which is sometimes exploited for specific inhibitor design (21). It is noteworthy that despite the movement of DFG-Phe, in 81% of the DFGout structures in the BBAminus cluster, the C-helix remains in an inward disposition, suggesting that Type II inhibitors do not push the helix outward. Further, across all the major clusters, BLBminus exists with almost equal frequency in both C-helix-in and out orientations. It is possible that in some of these structures the outward orientation of the helix is induced by an inhibitor. The DFGmotif in different conformations is stabilized by specific hydrogen bonds Our analysis has shown that DFG-Phe occupies three broad regions in the active site of the protein, which we label DFGin, DFGinter, and DFGout and from which we further identify 8 dihedral-based clusters. In this section, we describe how the DFGmotif in these groups is stabilized by hydrogen bonds from specific residues.
The X-DFG backbone O atom points downwards toward the catalytic loop in all DFGin,
DFGout, and DFGinter backbone clusters except ABAminus. In these clusters, the beta (‘B’) conformation of X-DFG orients the X-DFG O atom so that it can form a hydrogen bond with the HRDHis Hε2 atom of the catalytic loop (Fig. 7A; Tables 3). Our analysis shows that this hydrogen bond stabilizes both catalytically primed and different inactive clusters in the DFGin, DFGout, and DFGinter spatial groups. However, in the ABAminus cluster the X-DFG O atom is flipped upwards due to the alpha (‘A’) conformation of X-DFG, and therefore it cannot form the same interaction. In most of the ABAminus structures the hydrogen bond acceptor for HRD-His Hε2 is instead the DFGAsp backbone O atom (Fig. 7B).
23
bioRxiv preprint first posted online Aug. 19, 2018; doi: http://dx.doi.org/10.1101/395723. The copyright holder for this preprint (which was not peer-reviewed) is the author/funder, who has granted bioRxiv a license to display the preprint in perpetuity. It is made available under a CC-BY-NC 4.0 International license.
The DFG-Phe residue in the DFGout spatial group moves out of the pocket adjacent to the C helix and occupies the ATP binding site. Most of the structures in the DFGout group exhibit the BBAminus conformation where the DFG-Phe residue is in proximity to a conserved Asn residue (HRDxxxxN, typical sequence HRDLKPEN) in the catalytic loop. In 82% of these structures (203 of 248 BBAminus structures) the side-chain Oδ1 atom of this Asn residue forms a hydrogen bond with the backbone HN atom of DFG-Phe (Fig. 7C; Tables 3). This interaction is only formed when the DFG-Phe residue moves to its furthest position from the C-helix exposing the C-helix pocket. A Type II ligand is present in 90% of these 203 chains and 36% of the remaining 45. A Type II ligand is present only 9% of the DFGout noise structures.
Fig. 7. Representative examples of hydrogen bonds. Hydrogen bonds are displayed by dotted lines. They were identified using HBPlus program. A) BLAminus - INSR (3BU5_A); B) ABAminus – ALK (2XBA_A); C) BBAminus - VGFR2 (2P2I); D) extended activation loop with hydrogen bond between DFG+5 and X-HRD; E) Comparison of a catalytically primed state of a kinase - BLAminus with ABAminus. The catalytically primed active form structure (Triphosphate and Mn2+/Mg2+ ion complex, PDBid 5DN3_A, cyan colored backbone) of Aurora A in BLAminus conformation superposed on ABAminus conformation (PDBid 4BYI_A, yellow colored backbone). The DFG-Asp side chain in both structures is observed in similar orientation and position conducive to ion binding.
An extended conformation of the activation loop is required for substrate binding to kinases, since the more folded loop structures block the substrate binding site. When the activation loop is extended, the backbone N atom of the sixth residue in the loop (DFGxxX) makes a hydrogen bond with the backbone O atom of the residue preceding HRD motif (X-HRD, Fig. 7D). Using this criterion, our analysis shows that 97-99% of chains in the BLAminus cluster have an extended activation loop (Tables 3). Among the other DFGin clusters, more than half of chains (56%) in ABAminus have their activation loop in a similar conformation. Beyond BLAminus and ABAminus, an extended activation loop is rare. Previously, we also noticed that the ABAminus cluster has a C24
bioRxiv preprint first posted online Aug. 19, 2018; doi: http://dx.doi.org/10.1101/395723. The copyright holder for this preprint (which was not peer-reviewed) is the author/funder, who has granted bioRxiv a license to display the preprint in perpetuity. It is made available under a CC-BY-NC 4.0 International license.
helix-in conformation in 75% of chains. Taken together with the extended activation loop, these two structural features make ABAminus very similar to the BLAminus state, despite the different backbone conformations of the first two residues (Fig. 7E). This will be discussed further in the next section. Comparison of protein kinase geometry in the catalytically primed (BLAminus) and a pseudoactive state (ABAminus)
Upon comparing the different DFGin clusters in the previous sections we identified that the structures in the ABAminus cluster are very similar to the catalytically primed BLAminus structures. A total of 206 chains (46%) in ABAminus have C-helix-in and extended activation loops. Superposition of ATP+ion bound BLAminus to an ABAminus structure shows that despite different backbone conformation the side-chain orientation and position of DFG-Asp are very similar when both the BLAminus and ABAminus forms have Asp χ1 ~ 180o and χ2 ~0o (Fig. 7E). Out of these 206 ABAminus chains, 44 chains have this Asp side-chain position, which is a critical feature required to stabilize Mg2+/Mn2+ ions in the BLAminus catalytically primed state. Therefore, despite the different backbone conformation of the DFGmotif, ABAminus structures could be easily mistaken for BLAminus catalytically primed conformations. Further, we have also observed that there are only three chains in the ABAminus cluster (all with resolution ≥ 2.25 Å) which are in complex with triphosphate+ion with phosphorylated activation loops (Table 3). The BLA to ABA conformational switch is consistent with a ‘peptide flip’ (44-46) where ψ of the first residue and φ of the second residue change by about 180° while the other dihedrals remain approximately the same. This changes the B conformation to an A conformation in the first position (with φ constant), and the L conformation to a B conformation (with ψ constant; L could be changed to A depending on the value of ψ of this residue). At some positions in proteins, this flip can be approximately isoenergetic and both conformations may be modeled correctly in different 25
bioRxiv preprint first posted online Aug. 19, 2018; doi: http://dx.doi.org/10.1101/395723. The copyright holder for this preprint (which was not peer-reviewed) is the author/funder, who has granted bioRxiv a license to display the preprint in perpetuity. It is made available under a CC-BY-NC 4.0 International license.
crystals or even in the same crystal with partial occupancy. However, in other cases, especially at modest resolution, a BL conformation can be modeled as an AB or AA conformation or vice versa. To see if this was the case for some of the ABAminus structures, we have examined the electron density around the DFGmotif in several of these structures using the PDBe server (https://www.ebi.ac.uk/pdbe/) which provides a user interface to visualize electron density of structures in the PDB (47). The server allows visualization of the 2mFo-DFc map and the mFo-DFc difference map. The first of these shows density around all the well determined atom positions in the model, while the latter has two features, negative density and positive density. The negative density contours show regions where atoms are modeled without support by experimental data. The positive density features show the regions where electron density is suggested by the experimental data but no atoms are modeled. Both of these features point to possibly erroneous modeling of atoms in the structure.
Fig. 8. Representative examples showing electron density of X-DFG O atoms with poor electron density. A) 1K3A_A (IGF1R); B) 4BL1_A (MELK); C) 3IEC_D (MARK2). The gray-colored mesh around the atoms represent ‘2mFo-DFc’ electron density map. The green colored mesh represents positive density in the difference map (‘mFo-DFc’). The red colored mesh represents the negative density in the difference map. The positive density features in the map show the regions where electron density is suggested by the experimental data but no atoms were modeled. The negative density contours show regions where atoms are modeled without support by experimental data. The electron density maps for the figures were generated using Phenix
The visual examination of several ABAminus structures highlighted a common error across them. Fig. 8 shows three representative examples where we observed that there is little or no electron density at the coordinate of the X-DFG-residue O atoms. However, we observe a positive density right below where the atom is placed. This indicates that in some of the structures, the X-
26
bioRxiv preprint first posted online Aug. 19, 2018; doi: http://dx.doi.org/10.1101/395723. The copyright holder for this preprint (which was not peer-reviewed) is the author/funder, who has granted bioRxiv a license to display the preprint in perpetuity. It is made available under a CC-BY-NC 4.0 International license.
DFG O atom may be incorrectly modeled. This is consistent with an ABA conformation that should be modeled as a BLA conformation, since it is the X-DFG O atom that would shift the most if the structure is not modeled correctly.
Fig. 9. Boxplots showing EDIA score. A) DFG-X O atom across all the clusters; B) DFG-Asp O atom across all clusters; C) DFG-Phe O atom across all the cluster; D) DFG-X O atom in ABAminus cluster split into two groups by DFG-Asp χ2 dihedral.
27
bioRxiv preprint first posted online Aug. 19, 2018; doi: http://dx.doi.org/10.1101/395723. The copyright holder for this preprint (which was not peer-reviewed) is the author/funder, who has granted bioRxiv a license to display the preprint in perpetuity. It is made available under a CC-BY-NC 4.0 International license.
We have quantified this error by using the EDIA program (‘electron density score for individual atoms’) (48). EDIA computes the electron density fit of each atom in a crystal structure. It computes the weighted mean over grid points in a sphere around the atom large enough to detect both missing density and extra density if the atom is modeled incorrectly. A value of 0.8 or more reflects a good electron density fit; values lower than 0.8 indicate a problem in the model. The main advantage of this program is that we can assess the quality of electron density fit at the level of individual atoms. We have computed this score for the backbone and side-chain atoms of the X-DFG, DFG-Asp, and DFG-Phe residues for kinase structures in all the clusters. Fig. 9 shows the distribution of EDIA scores for the backbone O atoms of these residues across different clusters. For all of the clusters in which the X-DFG residue is in a beta (B) conformation (all clusters except ABAminus and some of the noise), the median value of the EDIA score of the X-DFG O atom is above 0.9. Except for BLAplus, even the top 75% percentile is above 0.8 (the bottom of each box). However, the median EDIA score for the ABAminus cluster is 0.8, indicating that half the structures potentially have some misfit to the density. This atom is placed by the values of φ, ψ of the X-DFG residue. In particular, the BLA and BLB clusters have ψ ~ 170°, while the ABAminus cluster has ψ of -10°, which flips the oxygen atom upwards pointing into the N-terminal domain. The φ dihedral of DFG-Asp compensates for the change in X-DFG ψ; the ABAminus cluster has a φ dihedral of -141° while the BLA and BLB structures have an average of ~+60°. As noted above, this kind of flip of a peptide group (AA or AB to BL) is commonly observed in many protein structures, sometimes modeled correctly and sometimes incorrectly (44-46). A visual inspection of the electron density in ABAminus structures using the PDBe server suggested that the error in modeling is more commonly encountered in structures with a DFG-Asp χ2 dihedral of about 0°. To examine this, we divided them based on the χ2 dihedral of the DFG-Asp side chain (Fig. 9D). We observed that the error predominantly occurs in the structures where DFG28
bioRxiv preprint first posted online Aug. 19, 2018; doi: http://dx.doi.org/10.1101/395723. The copyright holder for this preprint (which was not peer-reviewed) is the author/funder, who has granted bioRxiv a license to display the preprint in perpetuity. It is made available under a CC-BY-NC 4.0 International license.
Asp χ2 is modeled ~0°. The other structures in the same cluster with DFG-Asp χ2 ~90°are likely to be correctly modeled. This is consistent with a backbone-dependent kernel density estimate of aspartic acid χ2, which shows that at the φ, ψ values of BLAminus structures (φ, ψ=60°,82°), the mode in the χ2 density occurs at about -20° for the g-minus χ1 rotamer, while for φ, ψ values of ABAminus structures (φ, ψ=-133°,143°), the mode of the distribution of the g-minus χ1 rotamer is at +110° (49). Our conclusion is that authors sometimes model the position of the Asp carboxylate atoms correctly in ABAminus structures, but incorrectly model the backbone conformation of X-DFG and DFG-Asp, thus converting what should be a BLAminus structure into an ABAminus structure. Similarly, we have also observed that DFG-Phe O atom in the BLAplus cluster is also modeled incorrectly in many structures. Fixing the structure would convert a BLAplus structure into the far more common BLBplus conformation (Fig. 9C). Relative population of different clusters in complex or apo-form Because we are limited by the number of structures determined for each kinase and the conditions employed during crystallization, it is difficult to determine whether each kinase has a dominant conformation in the absence of inhibitors and specific activation via phosphorylation or binding other protein partners. Nevertheless, we were interested in the distribution of conformational states of kinases in the apo and the adenosine-triphosphate forms (including ATP analogues) versus inhibitor-bound forms. It is not surprising that the adenosine-triphosphate forms are predominantly in the BLAminus cluster (Tables 3), although the common DFGin inactive forms, BLBplus and ABAminus, are also well represented. However, a triphosphate is never found in complex with a kinase in the DFGout BBAminus and DFGinter BABtrans states because the location of the DFG-Phe side chain would make the binding of ATP unfavorable. Structures with adenosine-
29
bioRxiv preprint first posted online Aug. 19, 2018; doi: http://dx.doi.org/10.1101/395723. The copyright holder for this preprint (which was not peer-reviewed) is the author/funder, who has granted bioRxiv a license to display the preprint in perpetuity. It is made available under a CC-BY-NC 4.0 International license.
triphosphate and Mg2+/Mn2+ ion bound as well as a phosphorylated activation loop are found predominantly in the BLAminus cluster (48 chains). The apo-form kinases follow a similar pattern with the BLAminus state being the most common followed by ABAminus and BLBplus. This shows that multiple clusters which are observed within the DFGin group are likely to be naturally occurring states even in the absence of any bound inhibitor. However, relatively few apo structures of kinases exist in the DFGout cluster (BBAminus) or the DFGinter cluster (BABtrans) and as noted above ATP-bound structures do not either.
Fig. 10. Representative examples showing beta turns in the activation loop of kinases. A) DFG-Phe Type I turns in ABAminus-cluster (ACK1, ALK, E2AK2, INSR, KAPCA, KS6A3, PKN1); B) DFG-Phe Type II’ turns in BLBplus cluster (MET). C) DFG-Asp Type II turns in BLBplus cluster (ABL1, BTK, EGFR, HCK, ITK, KSYK, PTK6, VGFR2); D) DFG-Asp Type I turns in BLAplus cluster (FGFR1, FGFR4, ITK, MLTK), turn type I.
30
bioRxiv preprint first posted online Aug. 19, 2018; doi: http://dx.doi.org/10.1101/395723. The copyright holder for this preprint (which was not peer-reviewed) is the author/funder, who has granted bioRxiv a license to display the preprint in perpetuity. It is made available under a CC-BY-NC 4.0 International license.
These distributions are in contrast to inhibitor-bound structures, which are observed across all the conformations. The BLAminus cluster has 77% chains in complex with inhibitors (Table 3). This is the conformation most commonly targeted by Type I inhibitors, although Type I inhibitors also bind to other conformations. Moreover, across DFGin clusters more than 80% of chains are observed in complex with inhibitors. Examining the geometry of these conformations in greater detail might lead to identification of certain structural features specific to each inactive conformation that could guide development of more specific inhibitors. Further, the DFGout BBAminus state is widely targeted by the development of Type II inhibitors which take advantage of the pocket created by motion of the DFG-Phe ring out of the DFGin conformation. A total of 239 chains (96%) in the BBAminus cluster are in complex with an inhibitor, 200 chains (80%) of which are in complex with a Type II inhibitor (listed in Supplemental Table S2). Beta turns the in activation loop The activation loop in protein kinases plays an important role in regulating substrate binding. In the active state of kinases (BLAminus) the activation loop is fully extended which creates a groove on the surface of the enzyme facilitating substrate binding. In this conformation we observe a Type I beta turn starting from DFG-Phe residue (FGXX) in 96% of chains, as has also been observed previously (10). Beyond BLAminus, this beta turn is also observed in ABAminus (55%) structures, some of which have an extended activation loop (Fig. 10A and Table 4). Some BLBplus structures also contain a DFG-Phe beta turn, but of Type II’ (Fig. 10B). More frequently, BLBplus structures contain a Type II beta turn beginning at DFG-Asp (DFGX sequence). In these structures the activation loop occupies almost the same spatial location covering the substrate binding region across the different structures (Fig. 10C). This is the orientation of the activation loop which is also recognized as SRC-like inactive. Moreover , type I and type II turns starting from DFG-Asp are also frequently observed in the BLAplus (49%, shown in Fig. 10D) and BLBtrans 31
bioRxiv preprint first posted online Aug. 19, 2018; doi: http://dx.doi.org/10.1101/395723. The copyright holder for this preprint (which was not peer-reviewed) is the author/funder, who has granted bioRxiv a license to display the preprint in perpetuity. It is made available under a CC-BY-NC 4.0 International license.
(95%) clusters respectively. The BLAminus (similar to Fig. 10A) and the BLAplus (Fig. 10D) activation loop conformations are very different due in part to the presence of these beta turns at the beginning of the loop. Opening and closing of Gly rich loop The Gly-rich loop is an important contributor to the catalytic site of protein kinases. It plays a crucial role in the enzymatic cycle of the kinase by regulating the binding of ATP and release of ADP by synchronous closing/opening of the active cleft (50, 51). These states are captured in a large number of crystal structures which exhibit significant movement in the Gly rich loop while the C-lobe remains relatively rigid.
Fig. 11. Distribution of Gly rich loop conformations - distance between HRD-His-Cα and Gly rich loop-Tyr-Cα atoms.
We have investigated the positions of the Gly-rich loop across all the clusters. To quantify this movement we have computed the distance between the HRD-His residue and a conserved residue in the Gly rich loop (mostly Tyr or Phe; F144 in Aurora A kinase) (Fig. 11). This distance ranges from 10 to 25 Å. The structures around 15 Å have completely closed conformations while the ones with values around 25 Å have a completely open ATP binding cleft. However, across all the clusters there is a continuous range of intermediate conformations, unlike the C-helix in/out conformations where we observed distinct in and out conformations. Therefore, it is difficult to define a cutoff between closed/intermediate/open conformations. Similarly, the continuous gradient also makes it difficult to cluster since there are no physically separable populations. 32
bioRxiv preprint first posted online Aug. 19, 2018; doi: http://dx.doi.org/10.1101/395723. The copyright holder for this preprint (which was not peer-reviewed) is the author/funder, who has granted bioRxiv a license to display the preprint in perpetuity. It is made available under a CC-BY-NC 4.0 International license.
Comparison with previous kinase classification schemes In this section we have compare our labels to three previously published classification schemes. Taylor and coworkers have defined a regulatory spine as a stacking of four hydrophobic residues which dynamically assemble in the active state of the kinase (10). However, in the DFGout inactive state this assembly breaks. We define the regulatory spine as present if the three contact distances among these four residues (1-2, 2-3, and 3-4) are all less than 4.5 Å (Table 5). We have observed that the regulatory spine is present in 98% of the BLAminus structures and 100% of the BLAplus structures (Table 5). But it is also present in about 70% of BLAplus, ABAminus, BLBminus, and BLBplus clusters, indicating that its presence is not sufficient for defining active kinase structures. Rather it is a feature of most DFGin structures, whether they are active or inactive enzymes. The structures in these clusters have the C-helix both in and out. Moreover, the third distance of the spine is between C-helix-Glu(+4) and β1 (196 in Aurora A) residue. This region of the protein is relatively rigid and therefore this element of the regulatory spine is always present even in BBAminus (DFGout) and BABtrans (DFGinter) clusters rendering it less useful. The regulatory spine is never intact in DFGout and DFGinter structures, because the DFG-Phe residue has moved out from the back pocket, making the first distance greater than 4.5 Å in all of these structures. Möbitz published a classification scheme for kinase structures based on the position of the C-helix and two pseudo torsions of the Cα atoms of the XDFG and DFGX residues, capturing the relative orientation of DFG-Asp and DFG-Phe (30). The scheme uses DFGin and DFGout as the major labels and subdivides them into 12 conformations (Table 6). Although this scheme is able to identify most of the BLAminus structures as active, it fails to distinguish them from ABAminus. It divides DFGout structures into five groups, three of which are unintuitively named for some representative members of each cluster (‘AuP BRAF’, etc.). We find only one dominant cluster of 33
bioRxiv preprint first posted online Aug. 19, 2018; doi: http://dx.doi.org/10.1101/395723. The copyright holder for this preprint (which was not peer-reviewed) is the author/funder, who has granted bioRxiv a license to display the preprint in perpetuity. It is made available under a CC-BY-NC 4.0 International license.
conformations for DFGout, which is strongly associated with Type II inhibitor binding. Further, it merges our DFGinter structures with our DFGout noise structures into a ‘DFG Flipped’ category, even though the position of the DFG-Phe residues in these two conformations are very far apart. The Möbitz scheme does provide labels for the position of the C-helix, which we do not. Most of our clusters are strongly associated with either an inward or outward position of the C-helix. Only the BLBplus, BLBminus, and BLBtrans clusters have a majority of C-helix out positions (Table 3), which is evident from the comparison of our clusters with the Möbitz DFGin clusters. The two schemes are, however, quite different and may be useful for different purposes. More recently, Ung and coworkers also published a method that classifies kinase conformations into four groups as CI-DI, CI-DO, CO-DI, CO-DO and ωCD (DFGinter) (31) (Table 7), where CI and CO are C-helix-in and C-helix-out respectively and DI and DO are DFGin and DFGout respectively Their classification uses two vectors to capture the orientation of the DFGmotif and one distance to identify the inward and outward orientation of the C-helix. Ung's method successfully distinguishes DFGinter conformations, which they call ωCD. However, it fails to distinguish active from inactive DFGin structures, and lumps our six DFGin clusters into the CI-DI and CO-DI clusters based purely on the position of the C-helix. But as our clustering has shown, these conformations have different backbone and DFG-Phe side-chain orientations (Fig. 5A-5F). Furthermore, the ωCD cluster contains members of our DFGin, DFGout, and DFGinter noise groups. DISCUSSION The ~3500 crystal structures of protein kinases in the PDB show remarkable plasticity in their active sites. Among the different structures, the conformation of the DFGmotif is the most distinguishing feature. We have developed a clustering and labeling scheme which first divides the kinase structures into three groups, based on the location of the DFG-Phe side chain, that are further clustered based on the orientation of the activation loop. To cluster the orientation of the 34
bioRxiv preprint first posted online Aug. 19, 2018; doi: http://dx.doi.org/10.1101/395723. The copyright holder for this preprint (which was not peer-reviewed) is the author/funder, who has granted bioRxiv a license to display the preprint in perpetuity. It is made available under a CC-BY-NC 4.0 International license.
activation loop, we have used the backbone dihedrals (φ, ψ) of the X-D-F residues and the first sidechain dihedral (χ1) of the DFG-Phe residue. These are basic parameters used to define the conformation of any polypeptide chain. From this clustering, we have developed a simple nomenclature for kinase conformations that is intuitive and easily applied by structural biologists when they determine a new kinase structure. It is based on the region occupied by the backbone dihedrals on the Ramachandran plot and the side-chain rotamer of DFG-Phe, both of which are easily calculated structural properties of proteins. We have divided kinase conformations into three spatial groups, DFGin, DFGout, and DFGinter, which are further subdivided into a total of eight clusters. These include, 1) BLAminus, BLAplus, ABAminus, BLBminus, BLBplus, BLBtrans (all DFGin); 2) BBAminus (DFGout); 3) BABtrans (DFGinter – intermediate). One of the most important results of our clustering is that it is able to identify several distinct states within the ensemble of active and inactive DFGin structures, which have usually been grouped together in previous clustering schemes (28, 29, 31). We have determined that the most frequently observed conformation, BLAminus, is also the active state conformation of kinases. Catalytically primed structures, those containing bound ATP and Mg2+/Mn2+ ion and a phosphorylated activation loop, form a subset of the BLAminus cluster. We find that nearly all BLAminus structures have structural features consistent with an active kinase, similar to those in the catalytically primed structures, in the form of specific hydrogen bonds, beta turns, and an extended activation loop. Among the inactive states in the DFGin group, BLBplus and ABAminus are the most frequent conformations with almost the same frequency at 9.5 and 9.1% respectively. However, we observed that many structures in the ABAminus cluster are likely to be incorrectly modeled. In these structures, the peptide group spanning the X and D residues of the X-DFG sequence is flipped such that the backbone carbonyl oxygen of the X-DFG residue is misplaced. This kind of error in
35
bioRxiv preprint first posted online Aug. 19, 2018; doi: http://dx.doi.org/10.1101/395723. The copyright holder for this preprint (which was not peer-reviewed) is the author/funder, who has granted bioRxiv a license to display the preprint in perpetuity. It is made available under a CC-BY-NC 4.0 International license.
structure determination is fairly common, in this case leading to BLAminus structures being incorrectly modeled as far less common ABAminus structures. Upon removing low-resolution and poorly determined structures, BLBplus becomes even more prevalent than ABAminus (10.1% compared to 7.8%) and is the most frequently occurring inactive conformation of kinases. In this conformation, the DFG-Phe ring is underneath the C-helix but pointing upwards, and the C-helix is pushed outwards creating extra volume, a region which is sometimes exploited for inhibitor design. BLBplus is sometimes referred to as the ‘SRC-like inactive’ state (52, 53), although the latter has not been explicitly defined. DFGout structures of kinases are most commonly found in the BBAminus cluster, which occurs in about 5% of all structures. A total of 82% of all Type II inhibitor-bound structures occur in the BBAminus cluster making it their preferred conformation. We have also examined the different conformations of the activation loop beyond the DFGmotif residues. Although in the active state, the activation loop is completely extended, its orientation in inactive states has not been systematically studied. We have identified specific beta turns beginning from DFG-Asp (DFGX) and DFG-Phe (FGXX) in the different folded conformations of the activation loop. These beta turns are a feature of specific conformations adopted by the loop. We have compared our clustering and labeling scheme with three main previously published methods. The regulatory spine defined by Kornev and coworkers is a commonly used method to distinguish between active and inactive states (10). However, our data indicate that the presence of the regulatory spine can only reliably distinguish DFGin structures from DFGout and DFGinter structures. It fails to identify the different kinds of inactive states within the DFGin group, most of which have an intact regulatory spine. Möbitz developed a classification scheme based on the C-helix position and the XDFG and DFGX Cα pseudodihedrals of the activation loop (30). His labeling scheme is rather complicated and the names are unintuitive and difficult to rationalize. Ung and colleagues divided kinase structures into DFGin, DFGout, and DFGinter (ωCD) categories and 36
bioRxiv preprint first posted online Aug. 19, 2018; doi: http://dx.doi.org/10.1101/395723. The copyright holder for this preprint (which was not peer-reviewed) is the author/funder, who has granted bioRxiv a license to display the preprint in perpetuity. It is made available under a CC-BY-NC 4.0 International license.
then divided the DFGin ensemble into just two states, DFGin-C-helix-in and DFGin-C-helix-out (31). This scheme characterizes the C-helix and DFG-Phe positions but it does not capture the variability of the DFGin states and fails to separate active from inactive kinase structures. The lack of a consistent nomenclature has hindered comparison of structures in complex with inhibitors. It is often stated that Type I inhibitors bind to ‘active kinases’ although this is not strictly true. Zuccotto et al. described Type I inhibitors as those that occupy the ATP binding site without extending into the ‘back pocket’ adjacent to the gatekeeper residue or the ‘allosteric pocket’ adjacent to or underneath the C-helix (21). They define Type I ½ inhibitors* as those that also bind the back pocket. Roskoski, however, refers to inhibitors that bind to active DFGin structures as Type I and inactive DFGin structures as type I ½ inhibitors (54). He further subdivides these into those that extend into the back pocket as subtype A and those that do not as subtype B. Our clustering scheme makes the labeling of kinase conformations straightforward in a way that one inhibitor bound to different kinases can be easily compared. For example, sunitinib is a small compound that does not extend into the back pocket or the allosteric pocket. However, it has been found in kinase crystal structures bound to both active and inactive DFGin structures as well as DFGout. Using our nomenclature (Table S2), sunitinib is bound to STK24 (PDB: 4QMZ), PAK6 (4KS8), and PHKG2 (2Y7J) in active BLAminus conformations, but to ITK in a DFGin-inactive BLAplus conformation (3MIY) and CDK2 in a DFGin-inactive BLBminus conformation (3TI1). It is also bound to tyrosine kinases KIT (3G0F) and VEGFR2 (4AGD) in DFGout-BBAminus conformations. Similarly, dasatinib, which does extend into the back pocket, binds to different conformations of the same kinase in different PDB entries: ABL1 in active DFGin-BLAminus (PDB: 2GQG) and DFGinter-BABtrans (PDB: 4XEY) conformations, and BTK in BLAplus (3K54) and BABtrans (3OCT) conformations. It also binds to active BLAminus conformations of ABL2 (4XLI), *
These inhibitors might be labeled ‘Type IS’; the Romans used the symbol ‘S’ (for semis) to designate ½. This avoids the awkward combination of Roman and Arabic numerals found in ‘Type I ½.’
37
bioRxiv preprint first posted online Aug. 19, 2018; doi: http://dx.doi.org/10.1101/395723. The copyright holder for this preprint (which was not peer-reviewed) is the author/funder, who has granted bioRxiv a license to display the preprint in perpetuity. It is made available under a CC-BY-NC 4.0 International license.
PMYT1 (5VCV), SRC (3G5D), EPHA4 (2Y6O), STK10 (5OWR), and STK24 (4QMS) as well as BLBplus in PTK6 (5H2U), BLBminus in EPHA2 (5I9Y), and DFGinter-BABtrans structures in BMX (2SXR). This kind of analysis makes clear that a given inhibitor does not bind to all kinases in the same conformational state or even to one kinase in only one conformational state. It also argues that classifying inhibitors by the state of the kinase they bind to is not necessarily useful; it may be more productive to classify them by what volumes within the kinase active and C-helix sites they occupy (21). Multiple studies have used molecular dynamics (MD) simulations to study the transition from active to inactive states in protein kinases (55-57). Because a consistent nomenclature of inactive DFGin structures has been lacking, it has not always been clear how to characterize the starting states that have been chosen for simulations or what states have been visited during the simulation. In several of these studies, the starting state has been described as a DFGin-inactive state called the ‘Src-like inactive’ conformation. However, due to lack of a consistent nomenclature divergent DFGin states have been labeled as Src-like inactive. Levinson et al performed simulations of ABL1 from a ‘SRC-like inactive state’ (PDB: 2G1T) that we label a BLBplus structure. However, Shan and colleagues started simulations of EGFR from a ‘SRC-like inactive’ structure (PDB: 2GS7), which is actually BLBtrans, an infrequently observed conformation for most kinases. Moreover, in another paper Shan and coworkers compared snapshots from their simulation trajectory to a set of 26 DFGin inactive state crystal structures (58) -- 1A06, 1AD5, 1B6C, 1ERK, 1F3M, 1FGK, 1FMK, 1H8F, 1HCK, 1JNK, 1JPA, 1K2P, 1KOB, 1M7N, 1MQB, 1MRY, 1MUO, 1NY3, 1O6K, 1OL5, 1OMW, 1P38, 1QMZ, 1R1W, 1TKI, 1UKH. These structures include 8 BLAminus conformations, 2 ABAminus, 2 BLBplus, 2 BLBminus, 3 BLAplus, 1 BLBtrans, 1 DFGin-noise, 1 DFGout-noise, and 2 DFGinternoise (the rest were partially disordered). Our scheme for assigning structures to different conformational states will improve the analysis of molecular dynamics simulations of kinases described in these studies. 38
bioRxiv preprint first posted online Aug. 19, 2018; doi: http://dx.doi.org/10.1101/395723. The copyright holder for this preprint (which was not peer-reviewed) is the author/funder, who has granted bioRxiv a license to display the preprint in perpetuity. It is made available under a CC-BY-NC 4.0 International license.
Finally, significant effort has been expended to produce comparative models of kinases in different conformational states and to study the docking of inhibitors to these structures (59-62). A more reliable classification of the states of kinases will have a positive impact on choosing templates for producing models of kinases in various biologically and therapeutically relevant states. METHODS Identification of Kinase Domain Structures in the Protein Data Bank (PDB) The structures having kinase domains were identified from the file pdbaa (December 1, 2017) in the PISCES server (63, 64) with PSI-BLAST (34). pdbaa contains the sequence of every chain in every asymmetric unit of the PDB in FASTA format with resolution, R-factors, and Swissprot identifiers (e.g. AURKA_HUMAN) (65). The sequence of human Aurora A kinase (residues 125-391) was used as query to construct a profile from three iterations of PSI-BLAST on the pdbaa file with default cutoff values. This profile was used again to search pdbaa with an E-value cutoff of 1.0×10⁻¹⁵ to eliminate some poorly aligned kinases and some non-kinase proteins that were homologous to kinases but distantly related. The structures with resolution worse than 4 Å were removed. Moreover, the structures with an unresolved or mutated DFGmotif were also removed. Clustering was performed on all chains containing a kinase domain in these entries. The conserved motifs were identified from pairwise sequence and structure alignments with Aurora A (PDB entry 3E5A (38)). These include the HRD, DFG, and APE motifs, the Gly-rich loop, and the β3-Lys and Chelix-Glu residues. We have defined a filtered dataset of high resolution protein kinase structures. This set includes structures which satisfy the following criteria: a) Resolution better than or equal to 2.25 Å and no pseudokinases b) EDIAscore of X-DFG, DFG-Asp and DFG-Phe backbone atoms ≥ 0.8 39
bioRxiv preprint first posted online Aug. 19, 2018; doi: http://dx.doi.org/10.1101/395723. The copyright holder for this preprint (which was not peer-reviewed) is the author/funder, who has granted bioRxiv a license to display the preprint in perpetuity. It is made available under a CC-BY-NC 4.0 International license.
c) Overall EDIAscore of DFG-Asp and DFG-Phe residues (including side chains) ≥ 0.8 The pseudokinases we removed from the data set comprise CSKP, ERBB3, ILK, KSR2, MKL, STK40, STRAA, TRIB1, VRK3, WNK1, and WNK3. The filtered data set is provided in Table S3. Clustering kinase conformations based on spatial location of the DFGmotif In the first part of our clustering method, we have grouped the kinase structures based on the relative position of the DFG-Phe residue within the kinase domain. To automatically capture the location of the DFG-Phe residue, we calculated its distance from two conserved residues in the binding site (Fig. 3A): 1) αC-Glu(+4)-Cα to DFG-Phe-Cζ. This distance captures the remoteness of DFG-Phe from the C-helix thus providing an estimate of the outward orientation of the Phe ring. 2) β3-Lys-Cα to DFG-Phe-Cζ. This distance captures the closeness of DFG-Phe to the N-lobe β-sheets thus giving an estimate of upward orientation of the Phe ring. We have clustered these distances into three groups using average linkage hierarchical clustering algorithm using hclust function in the statistical software R (66). DBSCAN clustering of the dihedral angles of the DFGmotif In order to cluster the DFGmotif based on its backbone conformation we have used a metric from directional statistics (41) to calculate the distance between two angles (Eq. 1 and 2 in Results). The distance metric for two kinase structures is the average of the individual angle distances for seven dihedral angles, consisting of φ, and ψ of the X-DFG, DFG-Asp, and DFG-Phe residues and χ1 of the DFG-Phe residue. We have used density-based clustering algorithm DBSCAN to cluster backbone conformations of the DFGmotif residues. This is done by using the dbscan function in the fpc package in the R program (67). DBSCAN identifies relevant clusters in the data based on their overall density. Given a set of points it groups together the points that are tightly packed with each 40
bioRxiv preprint first posted online Aug. 19, 2018; doi: http://dx.doi.org/10.1101/395723. The copyright holder for this preprint (which was not peer-reviewed) is the author/funder, who has granted bioRxiv a license to display the preprint in perpetuity. It is made available under a CC-BY-NC 4.0 International license.
other while identifying the points in low density regions as noise. It requires a distance matrix of the data points with two parameters, eps value (ε) and minimum points (MinPts). The ε is an estimate of size of the neighborhood of the points and MinPts is the minimum number of data points which are included in a cluster. We used DBSCAN on each of the three spatial groups separately. To assign labels to as many data points as possible, the noise points whose distance (equation 2) from their nearest cluster centroid is less or equal to 0.3 units (equivalent to an average dihedral angle difference of 21°) were assigned to those respective clusters. The remaining noise points were still labeled with one of the three spatial group labels. Hydrogen bond analysis was performed with HBPlus (68). The classification of beta turns into different turn types was done using a python program by Maxim Shapovalov (https://github.com/sh-maxim/BetaTurn18) (69). The graphs were made using various plotting functions in the statistical package R. The molecular images were created using Pymol https://www.pymol.org/). Electron densities were calculated with Phenix (70). ACKNOWLEDGMENTS VM thanks Fox Chase Cancer Center for Elizabeth Knight Patterson postdoctoral fellowship. VM thanks Maxim Shapovalov for providing a program to identify beta turn types. This work was funded by NIH grants R01 GM084453 (R.L.D.) and R35 GM122517 (R.L.D).
41
bioRxiv preprint first posted online Aug. 19, 2018; doi: http://dx.doi.org/10.1101/395723. The copyright holder for this preprint (which was not peer-reviewed) is the author/funder, who has granted bioRxiv a license to display the preprint in perpetuity. It is made available under a CC-BY-NC 4.0 International license.
REFERENCES 1. 2. 3. 4. 5. 6. 7. 8. 9. 10. 11. 12. 13. 14. 15. 16.
17. 18. 19. 20. 21. 22.
Manning G, Whyte DB, Martinez R, Hunter T, & Sudarsanam S (2002) The protein kinase complement of the human genome. Science 298(5600):1912-1934. Adams JA (2001) Kinetic and catalytic mechanisms of protein kinases. Chem Rev 101(8):22712290. Blume-Jensen P & Hunter T (2001) Oncogenic kinase signalling. Nature 411(6835):355-365. Lahiry P, Torkamani A, Schork NJ, & Hegele RA (2010) Kinase mutations in human disease: interpreting genotype–phenotype relationships. Nature Rev Genetics 11(1):60-74. Patterson H, Nibbs R, McInnes I, & Siebert S (2014) Protein kinase inhibitors in the treatment of inflammatory and autoimmune diseases. Clinical & Experimental Immunology 176(1):1-10. Roskoski R, Jr. (2015) A historical overview of protein kinases and their targeted small molecule inhibitors. Pharmacol Res 100:1-23. Taylor SS & Kornev AP (2011) Protein kinases: evolution of dynamic regulatory proteins. Trends Biochem Sci 36(2):65-77. Hubbard SR & Till JH (2000) Protein tyrosine kinase structure and function. Ann Rev Biochem 69(1):373-398. Xu Q, et al. (2015) Identifying three-dimensional structures of autophosphorylation complexes in crystals of protein kinases. Sci Signal 8(405):rs13. Kornev AP, Haste NM, Taylor SS, & Ten Eyck LF (2006) Surface comparison of active and inactive protein kinases identifies a conserved activation mechanism. Proc Natl Acad Sci U S A 103(47):17783-17788. Johnson DA, Akamine P, Radzio-Andzelm E, Madhusudan a, & Taylor SS (2001) Dynamics of cAMP-dependent protein kinase. Chem Rev 101(8):2243-2270. Johnson LN, Noble ME, & Owen DJ (1996) Active and inactive protein kinases: structural basis for regulation. Cell 85(2):149-158. Johnson LN, Noble MEM, & Owen DJ (1996) Active and Inactive Protein Kinases: Structural Basis for Regulation. Cell 85(2):149-158. Huse M & Kuriyan J (2002) The conformational plasticity of protein kinases. Cell 109(3):275-282. van Linden OP, Kooistra AJ, Leurs R, de Esch IJ, & de Graaf C (2013) KLIFS: a knowledge-based structural database to navigate kinase–ligand interaction space. J Med Chem 57(2):249-277. Grossi V, et al. (2012) Sorafenib inhibits p38α activity in colorectal cancer cells and synergizes with the DFG-in inhibitor SB202190 to increase apoptotic response. Cancer Bio & therapy 13(14):1471-1481. Kuglstatter A, et al. (2011) Insights into the conformational flexibility of Bruton's tyrosine kinase from multiple ligand complex structures. Protein Sci 20(2):428-436. Zhang J, Yang PL, & Gray NS (2009) Targeting cancer with small molecule kinase inhibitors. Nature Rev Cancer 9(1):28-39. Johnson LN (2009) Protein kinase inhibitors: contributions from structure to clinical compounds. Quarterly Rev of biophysics 42(01):1-40. Druker BJ, et al. (2001) Activity of a specific inhibitor of the BCR-ABL tyrosine kinase in the blast crisis of chronic myeloid leukemia and acute lymphoblastic leukemia with the Philadelphia chromosome. New Eng J Med 344(14):1038-1042. Zuccotto F, Ardini E, Casale E, & Angiolini M (2009) Through the “gatekeeper door”: exploiting the active kinase conformation. J Med Chem 53(7):2681-2694. Zhao Z, et al. (2014) Exploration of type II binding mode: a privileged approach for kinase inhibitor focused drug discovery? ACS Chem Biol 9(6):1230-1241.
42
bioRxiv preprint first posted online Aug. 19, 2018; doi: http://dx.doi.org/10.1101/395723. The copyright holder for this preprint (which was not peer-reviewed) is the author/funder, who has granted bioRxiv a license to display the preprint in perpetuity. It is made available under a CC-BY-NC 4.0 International license.
23. 24. 25.
26. 27. 28.
29.
30. 31. 32. 33. 34. 35. 36. 37. 38.
39. 40. 41. 42. 43.
44.
Zhang J, et al. (2010) Targeting Bcr-Abl by combining allosteric with ATP-binding-site inhibitors. Nature 463(7280):501-506. Wu P, Nielsen TE, & Clausen MH (2016) Small-molecule kinase inhibitors: an analysis of FDAapproved drugs. Drug Discovery Today 21(1):5-10. Anastassiadis T, Deacon SW, Devarajan K, Ma H, & Peterson JR (2011) Comprehensive assay of kinase catalytic activity reveals features of kinase inhibitor selectivity. Nature biotechnology 29(11):1039-1045. Knighton DR & Zheng J (1991) Crystal Structure of the Catalytic Subunit of Cyclic Adenosine Monophosphate--Dependent Protein Kinase. Science 253(5018):407. Berman HM, et al. (2000) The protein data bank. Nucleic Acids Res 28(1):235-242. Jacobs MD, Caron PR, & Hare BJ (2008) Classifying protein kinase structures guides use of ligandselectivity profiles to predict inactive conformations: structure of lck/imatinib complex. Proteins 70(4):1451-1460. Brooijmans N, Chang YW, Mobilio D, Denny RA, & Humblet C (2010) An enriched structural kinase database to enable kinome-wide structure-based analyses and drug discovery. Protein Sci 19(4):763-774. Möbitz H (2015) The ABC of protein kinase conformations. Biochimica et Biophysica Acta (BBA)Proteins and Proteomics 1854(10):1555-1566. Ung PM-U, Rahman R, & Schlessinger A (2018) Redefining the Protein Kinase Conformational Space with Machine Learning. Cell Chem Bio 25:916-924. Chiu Y-Y, et al. (2013) KIDFamMap: a database of kinase-inhibitor-disease family maps for kinase inhibitor selectivity and binding mechanisms. Nucleic Acids Res 41(D1):D430-D440. Vijayan R, et al. (2014) Conformational analysis of the DFG-out kinase motif and biochemical profiling of structurally validated type II inhibitors. J Med Chem 58(1):466-479. Altschul SF, et al. (1997) Gapped BLAST and PSI-BLAST: a new generation of protein database search programs. Nucleic Acids Res 25(17):3389-3402. Finn RD, et al. (2015) The Pfam protein families database: towards a more sustainable future. Nucleic Acids Res 44(D1):D279-D285. Middelbeek J, Clark K, Venselaar H, Huynen MA, & Van Leeuwen FN (2010) The alpha-kinase family: an exceptional branch on the protein kinase tree. Cell Mol Life Sci 67(6):875-890. Baretić D, et al. (2017) Structures of closed and open conformations of dimeric human ATM. Science advances 3(5):e1700933. Zhao B, et al. (2008) Modulation of kinase-inhibitor interactions by auxiliary protein binding: Crystallography studies on Aurora A interactions with VX-680 and with TPX2. Protein Sci 17(10):1791-1797. Dodson CA, et al. (2010) Crystal structure of an Aurora-A mutant that mimics Aurora-B bound to MLN8054: insights into selectivity and drug design. Biochemical journal 427(1):19-28. Dodson CA, et al. (2010) Crystal structure of an Aurora-A mutant that mimics Aurora-B bound to MLN8054: insights into selectivity and drug design. Biochem J 427(1):19-28. Mardia K & Jupp P (2000) Directional Statistics (Wiley; London). North B, Lehmann A, & Dunbrack RL, Jr. (2011) A new clustering of antibody CDR loop conformations. J Mol Biol 406(2):228-256. Ester M, Kriegel H-P, #246, Sander r, & Xu X (1996) A density-based algorithm for discovering clusters a density-based algorithm for discovering clusters in large spatial databases with noise. in Proceedings of the Second International Conference on Knowledge Discovery and Data Mining (AAAI Press, Portland, Oregon), pp 226-231. Hayward S (2001) Peptide-plane flipping in proteins. Protein Sci 10(11):2219-2227. 43
bioRxiv preprint first posted online Aug. 19, 2018; doi: http://dx.doi.org/10.1101/395723. The copyright holder for this preprint (which was not peer-reviewed) is the author/funder, who has granted bioRxiv a license to display the preprint in perpetuity. It is made available under a CC-BY-NC 4.0 International license.
45. 46. 47. 48.
49. 50. 51. 52. 53. 54. 55. 56. 57.
58. 59. 60. 61.
62. 63. 64. 65. 66.
Touw WG, Joosten RP, & Vriend G (2015) Detection of trans-cis flips and peptide-plane flips in protein structures. Acta Crystallogr D Biol Crystallogr 71(Pt 8):1604-1614. Keedy DA, Fraser JS, & van den Bedem H (2015) Exposing Hidden Alternative Backbone Conformations in X-ray Crystallography Using qFit. PLOS Comput Biol 11(10):e1004507. Mir S, et al. (2017) PDBe: towards reusable data delivery infrastructure at protein data bank in Europe. Nucleic Acids Res 46(D1):D486-D492. Meyder A, Nittinger E, Lange G, Klein R, & Rarey M (2017) Estimating Electron Density Support for Individual Atoms and Molecular Fragments in X-ray Structures. J Chem Inf Model 57(10):2437-2447. Shapovalov MV & Dunbrack Jr RL (2011) A smoothed backbone-dependent rotamer library for proteins derived from adaptive kernel density estimates and regressions. Structure 19(6):844858. Cox S, Radzio-Andzelm E, & Taylor SS (1994) Domain movements in protein kinases. Curr Opin Struct Bio 4(6):893-901. Srivastava AK, et al. (2014) Synchronous opening and closing motions are essential for cAMPdependent protein kinase A signaling. Structure 22(12):1735-1743. Xu W, Doshi A, Lei M, Eck MJ, & Harrison SC (1999) Crystal structures of c-Src reveal features of its autoinhibitory mechanism. Mol cell 3(5):629-638. Levinson NM, et al. (2006) A Src-like inactive conformation in the abl tyrosine kinase domain. PLoS biology 4(5):e144. Roskoski Jr R (2015) A historical overview of protein kinases and their targeted small molecule inhibitors. Pharmacological Research 100:1-23. Shan Y, Arkhipov A, Kim ET, Pan AC, & Shaw DE (2013) Transitions to catalytically inactive conformations in EGFR kinase. Proc Natl Acad Sci U S A 110(18):7270-7275. Shukla D, Meng Y, Roux B, & Pande VS (2014) Activation pathway of Src kinase reveals intermediate states as targets for drug design. Nat Commun 5:3397. Yang S, Banavali NK, & Roux B (2009) Mapping the conformational transition in Src activation by cumulating the information from multiple molecular dynamics trajectories. Proc Natl Acad Sci U S A 106(10):3776-3781. Shan Y, et al. (2009) A conserved protonation-dependent switch controls drug binding in the Abl kinase. Proc Natl Acad Sci U S A 106(1):139-144. Ung PM-U & Schlessinger A (2014) DFGmodel: predicting protein kinase structures in inactive states for structure-based discovery of type-II inhibitors. ACS Chem Biol 10(1):269-278. Xu M, Yu L, Wan B, Yu L, & Huang Q (2011) Predicting inactive conformations of protein kinases using active structures: conformational selection of type-II inhibitors. PLOS ONE 6(7):e22644. Dixit A & Verkhivker GM (2012) Integrating ligand-based and protein-centric virtual screening of kinase inhibitors using ensembles of multiple protein kinase genes and conformations. J Chem Inf Model 52(10):2501-2515. Tuccinardi T & Martinelli A (2011) Protein kinase homology models: recent developments and results. Current medicinal chemistry 18(19):2848-2853. Wang G & Dunbrack RL (2005) PISCES: recent improvements to a PDB sequence culling server. Nucleic Acids Res 33(suppl 2):W94-W98. Wang G & Dunbrack RL (2003) PISCES: a protein sequence culling server. Bioinformatics 19(12):1589-1591. Magrane M & UniProt Consortium (2011) UniProt Knowledgebase: a hub of integrated protein data. Database 2011:bar009. R Core Team (2015) R: A Language and Environment for Statistical Computing (R Foundation for Statistical Computing, Vienna, Austria). 44
bioRxiv preprint first posted online Aug. 19, 2018; doi: http://dx.doi.org/10.1101/395723. The copyright holder for this preprint (which was not peer-reviewed) is the author/funder, who has granted bioRxiv a license to display the preprint in perpetuity. It is made available under a CC-BY-NC 4.0 International license.
67. 68. 69. 70.
Hennig C (2018) fpc (R package): Flexible Procedures for Clustering), 2.1-11.1. McDonald IK & Thornton JM (1994) Satisfying hydrogen bonding potential in proteins. J Mol Biol 238(5):777-793. Shapovalov M, Vucetic S, & Dunbrack RL (2018) A New Clustering and Nomenclature for Beta Turns Derived form High-Resolution Protein Structures. bioRxiv. Adams PD, et al. (2010) PHENIX: a comprehensive Python-based system for macromolecular structure solution. Acta Crystallogr D Biol Crystallogr 66(Pt 2):213-221.
45
bioRxiv preprint first posted online Aug. 19, 2018; doi: http://dx.doi.org/10.1101/395723. The copyright holder for this preprint (which was not peer-reviewed) is the author/funder, who has granted bioRxiv a license to display the preprint in perpetuity. It is made available under a CC-BY-NC 4.0 International license.
Table 1: Nomenclature for human protein kinase clusters. Spatial groups
DFGin (DFG-Phe in the back pocket against αChelix) DFGout (DFG-Phe in the ATP binding pocket) DFGinter (DFG-Phe in an intermediate orientation)
*
Backbone clusters
Number of chains (%)
Cluster Centroids
Example
DFG-Asp φ,ψ 60, 82 58, 33 -133, 143 57, 62 61, 34 70, 23 -143, 102
DFG-Phe φ,ψ -98,22 -90,-10 -13,23 -73,145 -88,147 -64,134 -82,-10
*
BLAminus BLAplus ABAminus BLBminus BLBplus BLBtrans Noise BBAminus
2690 (55.6) 150 (3.1) 439 (9.1) 183 (3.8) 458 (9.5) 199 (4.1) 214 (4.4) 248 (5.1)
X-DFG φ,ψ -130,179 -123, 71 -110,-20 -135, 76 -128,171 -110, 55 -140,-175
Noise
140 (2.9)
-
-
-
-
3LW0_A (IGF1R)
BABtrans
20 (0.4)
-78,133
-107, 6
-73,130
-148
3SXR_A (BMX)
Noise
93 (1.9)
-
-
-
-
5EW9_A (AURKA)
Phe side chain rotamers: minus: -120