CMAJ OPEN Research Estimating the payoffs from cardiovascular disease research in Canada: an economic analysis Claire de Oliveira MA PhD, Hai V. Nguyen PhD, Harindra C. Wijeysundera MD PhD, William W.L. Wong PhD, Gloria Woo PhD, Paul Grootendorst PhD, Peter P. Liu MD MSc, Murray D. Krahn MD MSc
Abstract Background: Investments in medical research can result in health improvements, reductions in health expenditures and secondary economic benefits. These “returns” have not been quantified in Canada. Our objective was to estimate the return on cardiovascular disease research funded by public or charitable organizations. Methods: Our primary outcome was the internal rate of return on cardiovascular disease research funded by public or charitable sources. The internal rate of return is the annual monetary benefit to the economy for each dollar invested in cardiovascular disease research. Calculation of the internal rate of return involved the following: measuring expenditures on cardiovascular disease research, estimating the health gains accrued from new treatments for cardiovascular disease, determining the proportion of health gains attributable to cardiovascular disease research and the time lag between research expenditures and health gains, and estimating the spillovers from public- or charitable-sector investments to other sectors of the economy. Results: Expenditures by public or charitable organizations on cardiovascular disease research from 1981 to 1992 amounted to $392 million (2005 dollars). Health gains associated with new treatments from 1994 to 2005 (13-yr lag) amounted to 2.2 million quality-adjusted life-years. We calculated an internal rate of return of 20.6%. Conclusion: Canadians obtain relatively high health and economic gains from investments in cardiovascular disease research. Every $1 invested in cardiovascular disease research by public or charitable sources yields a stream of benefits of roughly $0.21 to the Canadian economy per year, in perpetuity.
C
ardiovascular disease is the leading cause of hospital admissions and deaths in Canada.1 For every $69 spent on cardiovascular care in Canada, $1 was spent on research.2,3 Given the current economic climate, governments need to be frugal and ensure that public funds are spent efficiently. Decisions to allocate funds to health research must be based on effectiveness and cost-effectiveness;4 otherwise, resources may be inappropriately directed to areas that do not benefit the economy and society. To our knowledge, no study has examined the relation between research spending and improvements in health outcomes in Canada. We address this gap by comparing the benefits accrued from cardiovascular disease research funded by public or charitable sources with its cost to estimate the economic returns of expenditures on cardiovascular disease research in Canada.
Methods To measure the return on investments in cardiovascular disease research, we used the internal rate of return, which can be defined as the interest rate for which the present value of
© 2013 Canadian Medical Association or its licensors
future returns equals the present value of the current investment. Mathematically, the internal rate of return is the discount rate for which the net present value of all cash flows is equal to zero. It is frequently used to measure and compare profitability between projects and investments, and is readily comparable to interest and discount rates. Alternative measures include the benefit–cost ratio and the return on investment; however, these measures are susceptible to arbitrary definitions of what is included in the costs and benefits. To estimate the internal rate of return on cardiovascular disease research, we used a previously published approach5 and incorporated an existing validated system, the Ontario
Competing interests: William Wong declares having received grant funding from the Canadian Institutes of Health Research. No other competing interests were declared. This article has been peer reviewed. Correspondence to: Claire de Oliveira,
[email protected] CMAJ Open 2013.DOI:10.9778/cmajo.20130003
CMAJ OPEN, 1(2)
E83
CMAJ OPEN Research IMPACT model,6 which characterizes changes in the burden of cardiovascular disease between 1994 and 2005 in Ontario. We used a bottom–up payback approach, which involves estimating research costs and health gains over a given time interval.7 In contrast to econometric top–down methods, our approach examines economic and research-related health gains in greater detail, with a closer linking of health research outputs to specific research projects. We estimated several parameters to calculate the internal rate of return: research expenditures on cardiovascular disease from the public and charitable sectors from 1975 to 2005, health gains and costs associated with new cardiovascular disease treatments and procedures between 1994 and 2005, the link between cardiovascular disease research and health gains, and spillovers from investments from the public and charitable sectors.
Research expenditures on cardiovascular disease We have previously published on public and charitable research expenditures in Canada.8 Briefly, we compiled a list of all major public- and charitable-sector granting agencies and organizations in Canada that fund cardiovascular Box 1: Public- and charitable-sector organizations that fund cardiovascular research National •
Canadian Institutes of Health Research (formerly Medical Research Council of Canada)
•
Social Sciences and Humanities Research Council of Canada
•
Natural Sciences and Engineering Research Council of Canada
•
Indirect Costs Program, Government of Canada
•
Heart and Stroke Foundation of Canada
•
Canada Foundation for Innovation
•
Canadian Health Services Research Foundation
•
Genome Canada
Provincial •
Michael Smith Foundation for Health Research (formerly British Columbia Health Care Research Foundation)
•
Alberta Innovates — Health Solutions (formerly Alberta Heritage Foundation for Medical Research)
•
Saskatchewan Health Research Foundation (formerly the Saskatchewan Health Research Board and the Health Services Utilization and Research Commission)
•
Manitoba Medical Service Foundation
•
Manitoba Health Research Council
•
Physicians’ Services Incorporated Foundation
•
Banting Research Foundation
•
J.P. Bickell Foundation
•
Fonds de la recherche en santé du Québec (formerly Conseil de la recherche en santé du Québec)
•
Nova Scotia Health Research Foundation
•
Dalhousie Medical Research Foundation
•
Newfoundland and Labrador Centre for Applied Health Research
E84
CMAJ OPEN, 1(2)
research (Box 1); we then contacted each organization to obtain expenditures related to cardiovascular disease research from 1975 to 2005. Information was provided directly by the organization, obtained from its annual reports or the reference lists of health research in Canada (which include data on grants and awards collected by the former Medical Research Council of Canada).9 Two independent reviewers scanned all grants and titles of fellowships and scholarships (as well as summaries and keywords, when available) to determine their inclusion (i.e., related to heart or peripheral vascular diseases).6 When inconsistencies arose, the reviewers met to reach a consensus.
Health gains and costs associated with new cardiovascular disease treatments We estimated the magnitude of health gains and costs associated with new treatments for cardiovascular disease between 1994 and 2005. This required estimating the number of unique users for each cardiovascular treatment; determining the magnitude of health gains for each new treatment, expressed in quality-adjusted life-years (QALYs); and assigning a monetary value to health gains. We modified the IMPACT model to obtain estimates of the number of unique users for different interventions to treat or prevent cardiovascular disease6 and scaled these up to the Canadian population using population weights from Statistics Canada.10 To estimate the number of unique users for each intervention or patient group, we employed 3 methods: 1) for medications used on a long-term basis (e.g., β-blockers), first we estimated the total number of users, then estimated the number of new users and lastly distributed surviving patients on a particular therapy across the different disease states; 2) for acute inhospital therapies (e.g., angioplasty), we assumed the number of total users was equal to the number of unique users; and 3) for hypertension and hyperlipidemia treatments, we subtracted the number of users in each year from the number of users in the previous year, while accounting for the number of deaths. We examined 9 patient groups and interventions, and 47 medical and surgical therapies (for definitions, see Appendix 1, Tables A and B, available at www.cmajopen.ca/content/1/2/E83/suppl /DC1). These interventions were selected according to whether they were likely to have influenced total health gains experienced in Canada over the past decades. We performed a systematic review of the literature to obtain estimates of QALYs gained for each intervention and corresponding marginal costs.11–47 The search was conducted on Ovid MEDLINE and Embase from the databases’ inception date to May 5, 2010 (searches terms are available on request). Studies that compared the intervention to placebo or existing standard of care and that incorporated a lifetime horizon were preferred (Appendix 2, available at www.cmajopen.ca /content/1/2/E83/suppl/DC1). Whenever possible, we used Canadian studies to obtain QALYs and cost estimates; when these were unavailable, we converted costs to Canadian dollars using the purchasing power parity theory.48 All costs were inflated to 2005 Canadian dollars (our base year) using the Consumer Price Index. We converted QALY gains into mon-
CMAJ OPEN Research etary values by multiplying them by $50 000,5 an accepted threshold in health economics.49,50 Net monetary benefits for each cardiovascular disease intervention were calculated by subtracting net health care costs from monetized QALY gains. See Appendix 1 for further details on the estimation of unique users, health gains and costs.
Link between Canadian cardiovascular disease research and health gains Next, we estimated the link between expenditures and health gains. We addressed several unresolved methodological issues when evaluating the internal rate of return in this step:51 attribution issue (i.e., how much of the health gains observed can be attributed to medical research), Canadian contribution (i.e., the proportion of gains due to Canadian research) and time lag (i.e., the amount of time for research expenditures to translate into health gains). To determine the attribution factor, we reviewed the social determinants of health literature, which suggested that 32% to 56% of the variation in Canadians’ health outcomes is explained by socioeconomic factors52 (i.e., 44% to 68% is explained by medical research). Another study found that half of the 7.5 years of increased life expectancy since the 1950s can be attributed to medical care.53 Genetics are also likely to play a role. Unfortunately, the literature on this topic is quite scant. Based on our review, we assumed that roughly 70% of health gains in cardiovascular disease interventions were attributable to medical research, which is substantially different from previous work, which assumed an attribution of 100%.5 Our group has previously published on the Canadian contribution to global cardiovascular disease research.53 Briefly, we employed 2 approaches: a bibliometric search and the analysis of patent data. Our bibliometric estimation method indicated that Canada’s average contribution to global health gains was roughly 5% (Appendix 3, available at www.cmajopen.ca/content /1/2/E83/suppl/DC1). Canada’s highest contribution was in stroke and venous thrombosis followed by angina and myocardial infarction (about 8%); its smallest contribution was in chronic heart failure (< 5%). The patent data method showed that Canada owns close to 7% of total patents in the field (Appendix 4, available at www.cmajopen.ca/content/1/2/E83 /suppl/DC1). In particular, Canada has contributed substantially in the areas of angina and venous thrombosis and accounts for 13%–14% of the total patents issued worldwide. For other cardiovascular disease categories, Canada accounts
for 4%–8% of the total patents issued. Combining both results, we determined the overall Canadian contribution to global cardiovascular disease research to be about 6%, which is consistent with the findings of Buxton and colleagues.5 To determine an appropriate time lag factor, we reviewed the literature to assess previous approaches.5,54,55 We drew on 11 papers that were included in a study by ContopoulosIoannidis and colleagues55 and determined a mean time lag of 12.8 (standard deviation 4.0) years. We also considered the case in which time lag followed a normal distribution. Thus, an estimated time lag of 12.8 years implied that for health gains achieved during 1994–2005 (the time horizon of our model), we were interested in research expenditures incurred during 1981–1992.
Spillovers Beyond health gains, medical research can produce economic gains in the form of additional national income (social return). Based on previous work and the existing literature, 5 we employed 2 different approaches to quantify spillovers obtained from public- and charitable-funded research; combined, these provided a social rate of return of 31% (see Appendix 1 for further details).
Internal rate of return The internal rate of return can be described as an annualized effective compounded rate of return (see formula, Figure 1). An investment is considered acceptable if its internal rate of return is greater than an established minimum rate of return. Most private-sector firms use a minimum rate of 12%, based on typical returns of the S&P 500, a stock prices index of the 500 largest companies in leading industries of the US economy (www.standardandpoors.com/home/en/us).
Sensitivity analyses The baseline values for our analysis were as follows: time lag of 13 years, QALY value of $50 000, Canadian contribution factor of 6% and medical research contribution of 70%. We varied these parameters to understand how our internal rate of return estimate varied for the following scenarios: a) optimistic scenario: time lag of 10 years, QALY value of $60 000, Canadian contribution factor of 8% and medical research contribution of 100%; b) pessimistic scenario: time lag of 17 years, QALY value of $40 000, Canadian contribution factor of 4%, medical research contribution of 50% and higher value of public and charitable research expenditure (25% higher).
2005
∑
(MG − IC)
x Can.cont x Medical.cont
t = 1994
2005 – Timelag
∑
(Expenditure)
=0
t = 1994 – Timelag
IRR Timelag
Figure 1
CMAJ OPEN, 1(2)
E85
CMAJ OPEN Research Results
est net health gains. Angioplasty was the only intervention with a negative net health gain.
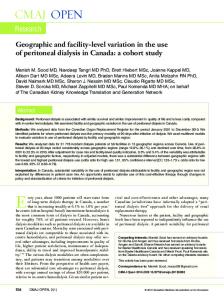
Research expenditures on cardiovascular disease We found that expenditures by public or charitable organizations were $12 774 409 in 1975, and rose to $41 180 364 in 1990 and to $95 553 388 in 2005. Figure 2 depicts the expenditure trends for our analysis period. Expenditures by public or charitable organizations on cardiovascular disease research from 1981 to 1992 were $392 million (2005 dollars).
Health gains and costs associated with new cardiovascular disease treatments Table 114–54,56 summarizes our results. Statins and acetylsalicylic acid (ASA) represented the interventions with the most unique users between 1994 and 2005; heart transplant and primary coronary artery bypass grafting were the cardiovascular disease interventions with the fewest. We found that cardiovascular treatments were responsible for 2.2 million QALY gains, where the largest were associated with not starting smoking and hypertension treatment, and the lowest were for spironolactone and warfarin therapy. The monetary value of all QALY gains was $110 688.8 million. For all categories and treatments, we obtained total costs of $19 969.6 million. Lifetime net costs (costs of treatment – costs averted by treatment) per user ranged from 0 (ASA) to $68 287 (heart transplant). In total, we obtained a net monetary benefit of treatment of $90 719.2 million. Angiotensin-converting enzyme inhibitors and ASA to treat chronic angina and coronary heart disease yielded the highest net health benefits. The most expensive items (heart transplant and coronary artery bypass grafting) were among the interventions with the small-
Internal rate of return Our aggregated results can be found in Table 2.5 Our baseline scenario yielded an internal rate of return of 20.6% (for both point- and distribution-based estimates of time lag), without spillover effects. This value increased to 35.1% and decreased to 10.3% under our optimistic and pessimistic scenarios, respectively. When we accounted for spillovers, our social rate of return was 51.6%.
Interpretation We found an internal rate of return of 20.6% for investment in cardiovascular disease research by the public and charitable sectors. Thus, for every $1 spent on cardiovascular disease research by public or charitable sources, Canadians receive an income stream of about $0.21 per year in perpetuity. Considering a minimum acceptable rate of return of 12%, this investment is quite attractive. Our internal rate of return estimate suggests that Canada receives a greater return for its investment than the United Kingdom (Table 2).5 This is mainly due to differences in data sources, Canada’s relatively low research expenditures and some underlying assumptions of our analysis. Alternatively, it may indicate that Canadians are disproportionately benefiting from research conducted abroad. Our work represents several contributions to the field. We provide a comprehensive time series of public and charitable expenditures on cardiovascular disease research. We also provide
120 000 000
Expenditures, Can$
100 000 000
80 000 000
60 000 000
40 000 000
20 000 000
0
Year Figure 2: Public and charitable expenditures on cardiovascular research and development in Canada, 1975–2005. Data source: Medical Research Council of Canada reference lists and annual reports of public and charitable organizations; base year, 2005. Note: We estimated the value of expenditures in 2005 Canadian dollars using Statistics Canada’s Consumer Price Index.
E86
CMAJ OPEN, 1(2)
CMAJ OPEN Research
Table 1 (part 1 of 2): Summary of new users, lifetime health gains (QALYs) and lifetime incremental costs by intervention (1994–2005)*14-55 QALY gains Patient group, intervention
Total new user, thousands
Unit QALY gained
Total QALYs, thousands
Total monetized, Can$ millions
Per new user, Can$
Total costs, Can$ millions
Net monetary benefit, Can$ millions
AMI
511.3
7 365.9
53 677.2
3 850.4
3 515.5
Fibrinolysis
251.44
0.275
69.15
3 457.3
11 784.0
2 963.0
494.3
ASA
46.47
0.213
9.90
494.9
0.0033
β-blocker
41.78
0.106
4.43
221.4
615.8
25.7
195.7
ACE inhibitor and ARB
29.26
0.740
21.65
1 082.7
7 704.0
225.4
857.2
Clopidogrel
69.00
0.077
5.33
266.7
999.3
68.9
197.7
Primary PCI
20.15
0.418
8.43
421.4
1.8
0.32
0.350
0.11
5.5
11 684.5
3.7
32.06
0.350
11.22
561.0
15 991.2
512.6
48.4
9.72
0.417
4.05
202.6
2 448.3
23.8
178.8
11.10
1.176
13.05
652.5
2 448.3
27.2
625.3
1 400.4
Primary CABG Statin Community CPR Hospital CPR ACS ASA and heparin ASA alone
147.3
Incremental costs
260.9
78.9
0.000152
0.037035
494.9
421.3 1.8
3 946.8
62 069.7
35.65
0.213
7.59
379.7
0.0033
0.000117
2 546.4 379.7
0.000014
45.2
4.25
0.213
0.90
45.2
0.0033
Glycoprotein IIb/IIa
19.34
0.099
1.91
95.7
1 235.9
23.9
71.8
ACE inhibitor and ARB
21.82
0.740
16.15
807.4
7 704.0
168.1
639.3
β-blocker
38.63
0.106
4.09
204.7
615.8
23.8
180.9
Clopidogrel
67.01
0.078
5.21
260.4
999.3
67.0
193.5
CABG surgery
20.18
1.100
22.20
1 110.0
35 521.6
716.9
393.1
PCI
28.93
0.418
12.10
605.2
1.8
0.1
605.1
Statin
25.06
0.350
8.77
438.5
15 991.2
400.7
37.8
3 062.4
10 698.3
637.5
Secondary prevention after AMI
322.9
61.2
ASA
81.25
0.213
17.31
865.3
0.0033
β-blocker
85.77
0.142
12.18
609.0
842.7
72.3
536.7
ACE inhibitor
55.87
0.180
10.06
502.8
2 706.8
151.2
351.6
Statin
61.33
0.350
21.47
1 073.3
6 581.9
403.7
669.6
Warfarin
21.95
0.004
0.09
4.4
147.3
3.2
1.2
Rehabilitation
16.75
0.009
0.15
7.5
419.6
7.0
555.5
27 774.6
39 020.4
9 066.0
Chronic angina and CHD
1 491.5
0.00027
2 424.9
0.001900
865.3
0.5 18 708.5
ASA in community
580.33
0.213
123.61
6 180.6
0.0033
6 180.6
Statins in community
483.34
0.314
151.77
7 588.4
6 581.9
3 181.3
4 407.1
ACE inhibitor
331.51
0.770
255.26
12 763.0
15 087.0
5 001.4
7 761.6
CABG surgery
56.10
0.400
22.44
1 122.0
11 684.5
655.5
466.5
Angioplasty
40.20
0.060
2.41
120.6
5 667.1
227.8
–107.2 Continued
CMAJ OPEN, 1(2)
E87
CMAJ OPEN Research Table 1 (part 2 of 2): Summary of new users, lifetime health gains (QALYs) and lifetime incremental costs by intervention (1994–2005)*14-55 QALY gains Patient group, intervention
Total new user, thousands
Unit QALY gained
Incremental costs Total costs, Can$ millions
Net monetary benefit, Can$ millions
Total QALYs, thousands
Total monetized, Can$ millions
Per new user, Can$
8.5
426.1
6 857.9
42.3
383.9
Hospital heart failure
46.0
ACE inhibitor
21.29
0.210
4.47
223.6
37.7
0.8
222.8
β-blocker
8.51
0.137
1.17
58.3
1 368.4
11.6
46.6
Spironolactone
2.38
0.022
0.05
2.6
570.0
1.4
1.2
ASA
8.03
0.213
1.71
85.5
0.0033
0.000026
85.5
5.83
0.193
Statin
56.2
4 881.7
28.5
77.4
3 871.5
6 857.9
527.4
3 344.1
0.210
36.77
1 838.3
37.7
6.6
1 831.7
76.30
0.137
10.45
522.6
1 368.4
104.4
Spironolactone
10.38
0.022
0.22
11.2
570.0
5.9
ASA
64.60
0.213
13.76
687.9
0.0033
0.000211
84.09
0.193
Community heart failure
410.4
ACE inhibitor and ARB
175.08
β-blocker
Statin
1.12
418.2 5.2 687.9
811.5
4 881.7
410.5
398.1
19 903.1
1 373.6
781.1
19 122.0
398.06
19 903.1
1 373.6
781.1
19 122.0
116.9
5 845.4
10 690.6
3 109.0
2 736.4
0.134
102.00
5 099.9
3 563.5
2 712.5
2 387.4
83.45
0.134
11.18
559.1
3 563.5
297.4
261.7
27.82
0.134
3.73
186.4
3 563.5
99.1
87.2
2.9
145.5
68 287.4
134.7
10.8
2.91
145.5
68 287.4
134.7
10.8
Hypertension
568.7
All hypertension treatment
568.66
Hyperlipidemia treatment
872.4
Statins for primary prevention
761.19
Gemfibrozil Niacin Heart transplant
2.0
Heart transplant
1.97
0.700
1.475
16.23
27.8
401.0
Smoking
467.5
767.0
38 347.5
111.9
420.8
37 926.7
Smoking cessation
220.28
0.990
218.08
10 903.9
111.9
420.8
10 483.1
Smoking nonstarting
247.24
2.220
548.87
27 443.6
0
0
27 443.6
Total
4 953.6
2 213.8
110 688.8
19 969.6
90 719.2
Note: ACE = angiotensin-converting enzyme inhibitor, ACS = acute coronary syndrome, AMI = acute myocardial infarction, ARB = angiotensin receptor blocker, ASA = acetylsalicylic acid, CABG = coronary artery bypass grafting, CHD = coronary heart disease, CPR = cardiopulmonary resuscitation, Gp IIB/IIA – glycoprotein IIb/IIIa, PCI = percutaneous coronary intervention, QALY = quality-adjusted life-year. *Studies used to generate QALYs and costs are included in the cited references.
estimates of an attribution factor based on the social determinants of health literature, of Canada’s contribution to global medical research and of Canada’s social rate of return on medical research funded by the public and charitable sectors. Methodologically, we propose improved methods to estimate the number of users in each patient group and intervention, and the differential treatment of health gains for smoking quitters and nonstarters. In addition, we offer a novel approach to estimate the attribution factor by modelling time lag as a distribution.
E88
CMAJ OPEN, 1(2)
Limitations Our analysis involved making some assumptions; accordingly, there were many areas of uncertainty. We were able to calculate research expenditures and health gains, yet the link between the two was unclear. Although our QALY gains were obtained from peer-reviewed studies, they are hypothetical and unlikely to be so large in practice. Furthermore, the literature on attribution is quite scant, which made it difficult to determine an appropriate attribution factor. More theoretical and empirical work is
CMAJ OPEN Research
Table 2: Estimates of the input parameters and the internal rate of return for Canada and the United Kingdom United Kingdom5
Canada Variable
Baseline
Optimistic
Pessimistic
Baseline
Optimistic
Pessimistic
Input parameter estimates Time lag, yr
13
10
17
17
10
25
QALY value
$50 000
$60 000
$40 000
£25 000
£30 000
£20 000
National contribution, %
6
8
4
17
25
10
70
100
50
100
100
100
100
100
125
Central
Low
High
Point time lag case
20.6
35.1
10.3
9.2
22.5
Negative
Distribution time lag case
20.6
35.0
10.0
NA
NA
NA
Medical research contribution, % Estimated research expenditure, % Internal rate of return estimates, %
Note: NA = not available, QALY = quality-adjusted life-years.
required to better understand this relation and to determine the proportion of health gains that can legitimately be assigned to research. In addition, we assumed an overall contribution value of cardiovascular disease research of 6%; our results may have differed had we used intervention- or treatment-specific rates. We did not examine cardiovascular disease risk factors other than smoking, such as obesity and exercise. Our modified IMPACT model showed that about half of the reduction in cardiac mortality witnessed during recent years was attributable to changes in multiple risk factors; smoking accounted for only 8.8% of this total. Much cardiovascular research has been devoted to evaluation of the impact and modification of other risk factors as well as prevention and behavioural change. We included the cost of this type of research but not the benefits (apart from smoking); thus, our estimate of internal rate of return is likely an underestimate. If we assume decreasing returns to scale in cardiovascular disease treatments, then investing in initiatives that reduce the impact of these risk factors may provide opportunities for health gains. Future studies are required to clarify this issue. Finally, although spillovers have an important role in the dissemination of research findings, they are difficult to measure precisely.
Conclusion Our main goal was to understand how much “bang” we were getting for our research “buck” and whether investing in cardiovascular disease research is worthwhile from a population health perspective. Our estimates provide evidence that investing in cardiovascular disease research is valuable and that investments in medical research are returned many times over in societal benefits. Governments and policy-makers must decide how best to allocate scarce resources among competing priorities; as such, choices about how to allocate research funds must be based on effectiveness and budget impact. This work will help guide research organizations and policy-makers in quantifying the economic value of cardiovascular disease research in Canada.
A pertinent question is how Canadian medical research funds should be allocated, in particular regarding cardiovascular disease research. Evidence suggests that the economic impact of cardiovascular disease on the Canadian health care system can be substantial — $18 billion in direct and indirect costs per year.57 Thus, the need for continued monitoring of cardiovascular disease investment and treatment outcomes remains. Furthermore, our internal rate of return of 21% is an excellent rate of return. Should we divert research funds from other areas? We are not aware of studies that have estimated the internal rate of return for investing in research for other diseases and thus cannot answer this question. Nonetheless, our analysis suggests that investing in cardiovascular disease research is worthwhile.
References 1. Tu JV, Nardi L, Fang J, et al.; Canadian Cardiovascular Outcomes Research Team. National trends in rates of death and hospital admissions related to acute myocardial infarction, heart failure and stroke, 1994-2004. CMAJ 2009;180:E118-25. 2. Health care in Canada 2010. Ottawa (ON): Canadian Institute for Health Information; 2010. Available: https://secure.cihi.ca/free_products/HCIC_2010 _Web_e.pdf (accessed 2011 May 30). 3. Health research — investing in Canada’s future 2004–2005: heart disease. Ottawa (ON): Canadian Institutes of Health Research; 2007. 4. Allen L. The art of evaluating the impact of medical science [editorial]. Bull World Health Organ 2010;88:4-5. 5. Buxton, M, Hanney, S, Morris, S, et al. Medical research: What’s it worth? Estimating the economic benefits from medical research in the UK. London (UK): Evaluation Forum; 2008. 6. Wijeysundera HC, Machado M, Farahati F, et al. Association of temporal trends in risk factors and treatment uptake with coronary heart disease mortality, 1994–2005. JAMA 2010;303:1841-7. 7. Shiel, A, Di Ruggiero, E. Assessing the return on Canada’s public investment in population and public health research: methods and metrics. In: Return on investments in health research. Ottawa (ON): Canadian Academy of Health Sciences; 2009:A42–74. 8. de Oliveira C, Nguyen VH, Wijeysundera H, et al. How much are we spending? The estimation of the expenditures on cardiovascular disease research in Canada. BMC Health Serv Res 2012;12:281. 9. Medical Research Council of Canada. Reference list of health science research in Canada. Ottawa (ON): Répertoire de recherches en santé au Canada; 1975–1999. 10. Estimates of population, by age group and sex for July 1, Canada, provinces and territories [Table 051-00011]. Ottawa (ON): Statistics Canada; 2009. 11. Annemans L, Lamotte M, Kubin M, et al. Which patients should receive aspirin for primary prevention of cardiovascular disease? An economic evaluation. Int J Clin Pract 2006;60:1129-37. 12. Ara R, Tumur I, Pandor A, et al. Ezetimibe for the treatment of hypercholesterolaemia: a systematic review and economic evaluation. Health Technol Assess 2008;12: iii, xi-xiii, 1-212.
CMAJ OPEN, 1(2)
E89
CMAJ OPEN Research 13. Aujesky D, Smith KJ, Roberts MS. Oral anticoagulation strategies after a first idiopathic venous thromboembolic event. Am J Med 2005;118:625-35. 14. Beard SM, Gaffney L, Bamber L, et al. Economic modelling of antiplatelet therapy in the secondary prevention of stroke. J Media Econ 2004;7:117-34. 15. Briffa TG, Eckermann SD, Griffiths AD, et al. Cost-effectiveness of rehabilitation after an acute coronary event: a randomised controlled trial. Med J Aust 2005; 183:450-5. 16. Buxton M, Caine N, Chase D, et al. A review of the evidence on the effects and costs of implantable cardioverter defibrillator therapy in different patient groups, and modelling of cost-effectiveness and cost–utility for these groups in a UK context. Health Technol Assess 2006;10: iii-iv, ix-xi, 1-164. 17. Chambers MG, Koch P, Hutton J. Development of a decision-analytic model of stroke care in the United States and Europe. Value Health 2002;5:82-97. 18. Clegg AJ, Scott DA, Loveman E, et al. The clinical and cost-effectiveness of left ventricular assist devices for end-stage heart failure: a systematic review and economic evaluation. Health Technol Assess 2005;9:1-132, iii-iv. 19. Fox M, Mealing S, Anderson R, et al. The clinical effectiveness and costeffectiveness of cardiac resynchronisation (biventricular pacing) for heart failure: systematic review and economic model. Health Technol Assess 2007;11:iii-iv, ix-248. 20. Gage H, Kenward G, Hodgetts TJ, et al. Health system costs of in-hospital cardiac arrest. Resuscitation 2002;54:139-46. 21. Gaspoz JM, Coxson P, Goldman P, et al. Cost effectiveness of Aspirin, clopidogrel, or both for secondary prevention of coronary heart disease. N Engl J Med 2002;346:1800-6. 22. Glick H, Cook J, Kinosian B, et al. Costs and effects of enalapril therapy in patients with symptomatic heart failure: an economic analysis of the Studies of Left Ventricular Dysfunction (SOLVD) Treatment Trial. J Card Fail 1995;1:371-80. 23. Glick HA, Orzol1 SM, Tooley JF, et al. Economic evaluation of the Randomized Aldactone Evaluation Study (RALES): treatment of patients with severe heart failure. Cardiovasc Drugs Ther 2002;16:53-9. 24. Griffin SC, Barber JA, Manca A, et al. Cost effectiveness of clinically appropriate decisions on alternative treatments for angina pectoris: prospective observational study. BMJ 2007;334:624-8. 25. Grover SA, Coupal L, Lowensteyn I. Estimating the cost effectiveness of ramipril used for specific clinical indications comparing the outcomes in four clinical trials with a common economic model. Am J Cardiovasc Drugs 2007;7:441-8. 26. Hartwell D, Colquitt J, Loveman E, et al. Clinical effectiveness and cost effectiveness of immediate angioplasty for acute myocardial infarction: systematic review and economic evaluation. Health Technol Assess 2005;9:1-99, iii-iv. 27. Karnon J, Brennan A, Pandor A, et al. Modelling the long term cost effectiveness of clopidogrel for the secondary prevention of occlusive vascular events in the UK. Curr Med Res Opin 2005;21:101-12. 28. Kongnakorn T, Ward A, Roberts CS, et al. Economic evaluation of atorvastatin for prevention of recurrent stroke based on the SPARCL trial. Value Health 2009;12:880-7. 29. Lieu TA, Gurley R, Lundstrom R, et al. Projected cost-effectiveness of primary angioplasty for acute myocardial infarction. J Am Coll Cardiol 1997;30:1741-50. 30. Lundkvist J, Ekman M, Kartman B, et al. The cost-effectiveness of candesartan-based antihypertensive treatment for the prevention of nonfatal stroke: results from the Study on Cognition and Prognosis in the Elderly. J Hum Hypertens 2005;19:569-76. 31. Main C, Palmer S, Griffin S, et al. Clopidogrel used in combination with aspirin compared with aspirin alone in the treatment of non-ST-segmentelevation acute coronary syndromes: a systematic review and economic evaluation. Health Technol Assess. 2004;8:iii-iv, xv-xvi, 1-141. 32. McKenna C, Burch J, Suekarran S, et al. A systematic review and economic evaluation of the clinical effectiveness and cost-effectiveness of aldosterone antagonists for postmyocardial infarction heart failure. Health Technol Assess 2010;14:1-162. 33. Næss AC, Steen P. Long term survival and costs per life year gained after outof-hospital cardiac arrest. Resuscitation 2004;60:57-64. 34. National Collaborating Centre for Chronic Conditions. Hypertension: management in adults in primary care: pharmacological update. London (UK): Royal College of Physicians; 2006. 35. O’Brien CL, Gage B. Costs and effectiveness of ximelagatran for stroke prophylaxis in chronic atrial fibrillation. JAMA 2005;293:699-706. 36. Palmer S, Sculpher M, Philips Z, et al. Management of non-ST-elevation acute coronary syndromes: How cost-effective are glycoprotein IIb/IIIA antagonists in the UK National Health Service? Int J Cardiol 2005;100:229-40. 37. Phillips KA, Shlipak M, Coxson P, et al. Health and economic benefits of increased beta-blocker use following myocardial infarction. JAMA 2000;284:2748-54. 38. Samsa GP, Matchar D, Williams G. Cost-effectiveness of ancrod treatment of acute ischaemic stroke: results from the Stroke Treatment with Ancrod Trial (STAT). J Eval Clin Pract 2002;8:61-70. 39. Sandercock P, Berge E, Dennis M, et al. A systematic review of the effectiveness, cost-effectiveness and barriers to implementation of thrombolytic and neuroprotective therapy for acute ischaemic stroke in the NHS. Health Technol Assess 2002;6:1-112. 40. Tsevat J, Duke D, Goldman L, et al. Cost-effectiveness of captopril therapy after myocardial infarction. J Am Coll Cardiol 1995;26:914-9. 41. Tsevat J, Kuntz K, Orav J, et al. Cost-effectiveness of pravastatin therapy for survivors of myocardial infarction with average cholesterol levels. Am Heart J 2001;141:727-34.
E90
CMAJ OPEN, 1(2)
42. Varney S. A cost-effectiveness analysis of bisoprolol for heart failure. Eur J Heart Fail 2001;3:365-71. 43. Vermeer F, Simoons ML, de Zwaan C, et al. Cost benefit analysis of early thrombolytic treatment with intracoronary streptokinase. Twelve month follow up report of the randomised multicentre trial conducted by the Interuniversity Cardiology Institute of The Netherlands. Br Heart J 1988;59:527-34. 44. Wang D, Connock M, Barton P, et al. ‘Cut down to quit’ with nicotine replacement therapies in smoking cessation: a systematic review of effectiveness and economic analysis. Health Technol Assess 2008;12: iii-iv, ix-xi, 1-135. 45. Ward S, Jones M, Pandor A, et al. A systematic review and economic evaluation of statins for the prevention of coronary events. Health Technol Assess 2007;11:1-160, iii-iv. 46. Wardlaw JM, Seymour J, Cairns J, et al. Immediate computed tomography scanning of acute stroke is cost-effective and improves quality of life. Stroke 2004;35:2477-83. 47. Weinstein MC, Stason W. Cost-effectiveness of coronary artery bypass surgery. Circulation 1982;66(Suppl.III):11156-66. 48. Organisation for Economic Co-operation and Development. PPPs and exchange rates. OECD StatsExtracts. Available: http://stats.oecd.org/Index .aspx?datasetcode=SNA_TABLE4 (accessed 2011 May 30). 49. Grosse SD. Assessing cost-effectiveness in healthcare: history of the $50,000 per QALY threshold. Expert Rev Pharmacoecon Outcomes Res 2008;8:165-78. 50. Rocchi A, Menon D, Verma S, et al. The role of economic evidence in Canadian oncology reimbursement decision-making: to lambda and beyond. Value Health 2008;11:771-83. 51. Shields, M, Tremblay, S. The Health of Canada’s communities. Supplement to health reports — Volume 13. Ottawa (ON): Statistics Canada; 2002. Cat. no. 82-003. 52. Bunker JP. The role of medical care in contributing to health improvements within societies. Int J Epidemiol 2001;30:1260-3. 53. Nguyen HV, de Oliveira C, Wijeysundera H, et al. Canada’s contribution to global research in cardiovascular diseases. Can J Cardiol 2013. 54. Daim T, Monalisa M, Dash P, et al. Time lag assessment between research funding and output in emerging technologies. Foresight 2007;9:33-44. 55. Contopoulos-Ioannidis DG, Alexiou GA, Gouvias TC, et al. Life cycle of translational research for medical interventions. Science 2008;321:1298-9. 56. Frank C, Nason E. Health research: measuring the social, health and economic benefits. CMAJ 2009;180:528-34. 57. Economic burden of illness in Canada, 1998. Ottawa (ON): Health Canada; 1998. Available: www.phac-aspc.gc.ca/ebic-femc/ebic-femc98/pdf/ebic1998.pdf (accessed 2011 May 30).
Affiliations: Department of Social and Epidemiological Research (de Oliveira), Centre for Addiction and Mental Health, Toronto, Ont.; the University Health Network (Liu, Krahn), Toronto, Ont.; the Leslie Dan Faculty of Pharmacy (Nguyen, Grootendorst, Krahn), University of Toronto, Toronto, Ont.; the Schulich Heart Centre (Wijeysundera), Division of Cardiology, Department of Medicine, Sunnybrook Health Sciences Centre, Toronto, Ont.; the Toronto Health Economics and Technology Assessment Collaborative (de Oliveira, Wijeysundera, Wong, Woo, Grootendorst, Krahn) and the Department of Medicine (Krahn), University of Toronto, Toronto, Ont. Contributors: Claire de Oliveira managed the overall project; contributed to the concept and design of the analysis; collected, analyzed and interpreted the data; and wrote the manuscript. Hai Nguyen, William Wong and Gloria Woo contributed to the concept and design of the analysis; collected, analyzed and interpreted the data; and revised the manuscript. Harindra Wijeysundera, Paul Grootendorst, Peter Liu and Murray Krahn contributed to the overall concept and design of the analysis and interpretation of the findings, and revised the manuscript. All of the authors approved the final version submitted for publication. Funding: This project was funded by a project grant from the Canadian Institutes of Health Research. Murray Krahn is supported by the F. Norman Hughes Chair in Pharmacoeconomics at the Leslie Dan Faculty of Pharmacy, University of Toronto. Disclaimer: This study was conducted by the Toronto Health Economics and Technology Assessment Collaborative, which is funded by an annual grant from the Ontario Ministry of Health and Long-Term Care (MOHLTC). The opinions, results and conclusions reported in this paper are those of the authors and independent from the funding sources. No endorsement by the Canadian Institutes of Health Research or the Ontario MOHLTC is intended or should be inferred. Supplemental information: For reviewer comments and the original submission of this manuscript, please see www.cmajopen.ca/content/1/2 /E83/suppl/DC1