The postmaster is also in charge of the initialization of the database. ... As new result tuples are requested by the query Executor, the Join operation will keep.
Code Reordering of Decision Support Systems for optimized Instruction Fetch Alex Ram��rez
Josep-L. Larriba-Pey Josep Torrellas�
Carlos Navarro Mateo Valero
Xavi Serrano
Computer Architecture Department (UPC) Universitat Politecnica de Catalunya Jordi Girona 1-3 08034 Barcelona Abstract Instruction fetch bandwidth is feared to be a major limiting factor to the performance of future wide-issue aggressive superscalars. Consequently, it is crucial to develop techniques to increase the number of useful instructions per cycle provided to the processor. Unfortunately, most of the past work in this area has largely focused on engineering workloads, rather than on the more challenging, badly-behaved popular commercial workloads. In this paper, we focus on Database applications running Decision Support workloads. We characterize the locality patterns of database kernel code and nd frequently executed paths. Using this information, we propose an algorithm to lay out the basic blocks of the database kernel for improved I-fetch. Finally, we evaluate the scheme via simulations. Our results show a miss reduction of 60-98% for realistic I-cache sizes and a doubling of the number of instructions executed between taken branches. As a consequence we increase the fetch bandwith provided by an aggressive sequential fetch unit from 5.8 for the original code to 10.6 using our proposed layout. Our software scheme combines well with hardware schemes like a Trace Cache providing up to 12.1 instruction per cycle, suggesting that commercial workloads may be amenable to the aggressive I-fetch of future superscalars. � University
of Illinois at Urbana Champaign, USA.
1
1 Introduction Future wide-issue superscalars are expected to demand a high instruction bandwidth to satisfy their execution requirements. This will put pressure on the fetch unit and has raised concerns that instruction fetch bandwidth may be a major limiting factor to the performance of aggressive processors. Consequently, it is crucial to develop techniques to increase the number of useful instructions per cycle provided to the processor. The number of useful instructions per cycle provided by the fetch unit is broadly determined by three factors: the branch prediction accuracy, the cache hit rate and the number of instructions provided by the fetch unit for each access. Clearly, many things can go wrong. Branch mispredictions cause the fetch engine to provide wrong-path instructions to the processor. Instruction cache misses stall the fetch engine, interrupting the supply of instructions to the processor. Finally, the execution of non-contiguous basic blocks prevents the fetch unit from providing a full width of instructions. Much work has been done in the past to address these problems. Branch e�ects have been addressed with techniques to improve the branch prediction accuracy [12] and to predict multiple branches per cycle [22, 28]. Instruction cache misses have been addressed with software and hardware techniques. Software solutions include code reordering based on procedure placement [8, 7] or basic block mapping, either procedure oriented [18] or using a global scope [9, 24]. Hardware solutions include set associative caches, hardware prefetching, victim caches and other techniques. Finally, the number of instructions provided by the fetch unit each cycle can also be improved with software or hardware techniques. Software solutions include trace scheduling [5], and superblock scheduling [10]. Hardware solutions include branch address caches [28], collapsing bu�ers [3] and trace caches [6, 21]. While all these techniques have vastly improved the performance of superscalar I-fetch units, they have been largely focused and evaluated on engineering workloads. Unfortunately, there is growing evidence that popular commercial workloads provide a more challenging environment to aggressive instruction fetching. Indeed, recent studies of database workload performance on current processors have given useful insight [1, 14, 15, 16, 20, 25]. These studies show that commercial workloads do not behave like other scienti c and engineering codes. They execute fewer loops and have many procedure calls. This leads to large instruction footprints. The analysis, however, is not detailed enough to understand how to optimize them for improved I-fetch engine performance. The work in this paper focuses on this issue. We proceed in three steps. First, we characterize the locality patterns of database kernel code and nd frequently executed paths. The database kernel used 2
is PostgreSQL [23]. Our data shows that there is signi cant locality and that the execution patterns are quite deterministic. Second, we use this information to propose an algorithm to reorder the layout of the basic blocks in the database kernel for improved I-fetch. Finally, we evaluate our scheme via simulations. Our results show a miss reduction of 60-98% for realistic instruction cache sizes and a doubling of the number of instructions executed between taken branches to over 22. As a consequence, a 16 instruction wide sequential fetch unit using a perfect branch predictor increases the fetch bandwidth from 5.6 to 10.6 instructions per cycle when using our proposed code layout. The software scheme that we propose combines well with hardware schemes like a Trace Cache. The fetch bandwith for a 256 entry Trace Cache improves from 8.6 to 12.1 when combined with our software approach. This suggests that commercial workloads may be amenable to the aggressive instruction fetch of future superscalars. This paper is structured as follows. In Section 2, we give a detailed account of the internals of a database management system and compare PostgreSQL to it. In Sections 4 and 5, we characterize the miss rate of the di�erent modules of PostgreSQL and analyze the locality and determinism of the database execution. In Section 6, we describe the basic block reordering method that we propose. In Section 7 we give details on related work. In Section 8 we evaluate the performance of our method and compare it to other hardware and software techniques. Finally, in Section 9 we conclude and present guidelines for future work.
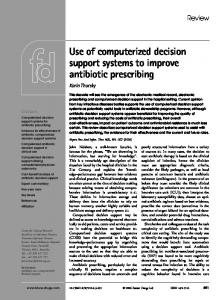
2 Structure of a Database Management System Database Management Systems are organized in di�erent software modules. Those modules correspond to di�erent functionalities to run queries, maintain the Database tables or use statistics on the Database data among others. Our interest focuses on those modules that take charge of running relational queries which are the most time consuming part of a RDBMS. In order to run a relational query, it is necessary to perform a number of steps as shown in Figure 1. The query is speci ed by the user in a declarative language that determines what the user wants to know about the Database data. Nowadays, the Structured Query Language (SQL) is the standard declarative language for relational Databases [4]. The SQL query is translated into an execution plan that will be processed by the Query Execution kernel. The query execution plan has the form of a tree, with nodes representing the di�erent operations. The task of the Parsing-optimization kernel is to check the grammatical correctness of the SQL ex3
Parsing-Optimization kernel
Query Execution kernel
Parser
Executor
Optimizer
Access Methods
Query Result
SQL
Buffer Manager Storage Manager
Figure 1: Steps required for the execution of an SQL query and all the RDBMS modules involved. pression and to generate the best execution plan for the given query in a speci c computer and Database. While the importance of the Parsing-optimization module is paramount to generate a plan that executes fastest on a speci c computer, the time employed to run it can be considered small compared to the total time spent in executing the query.
2.1 The Query Execution Kernel of a RDBMS The Executor of a RDBMS (Figure 1) contains the routines that implement basic operations like Sequential Scan, Index Scan, Nested-Loop Join, Hash Join, Merge Join, Sort, Aggregate and Group. It also contains the routines that schedule the execution of those basic operations as described by the execution plan. Scan operations take tuples from one table and generate a new table selecting those tuples that ful ll some conditions on an attribute or set of attributes. Join operations take two tables and produce a result table. For every pair of tuples, each from a di�erent table, the Join checks if one or more attributes satisfy a given condition. The result table contains tuples containing the data from all pairs of tuples that satisfy the condition. SELECT customer.name, customer.address, order.totalprize FROM customer, order WHERE customer.custkey=order.custkey AND customer.acctbal > 0 AND order.orderdate > ’1-Sept-1998’ Join customer.custkey = order.custkey
order.orderdate > Sept 1st, 1998 Scan
Order
Scan customer.acctbal > 0
Customer
Figure 2: SQL query example and its associated query execution tree. In the example of Figure 2 the leftmost Scan will select the tuples from the Order table with 4
orderdate > Sep1st; 1998 and the rightmost Scan will select the tuples from the Customer table with customer:acctbal > 0. Then, the Join operator will select the pairs of tuples with the same custkey value. The Sort operation orders the tuples of a table based on the value of one or more attributes. The Group operation generates a table with one tuple for each group of tuples in the original table that have a common value in the grouping attribute. The Aggregate operation performs some arithmetic manipulation (like addition or counting) on the tuples grouped by the Group operation and gives a single result. DBMSs are built with a modular structure to isolate the di�erent semantic data levels. Thus, the modules of a DBMS must communicate by means of data structures that act as intermediate bu�ers. In this section, we describe those data semantic levels and the communication structures for the lower modules of the DBMS. Just below the Executor, are the lower modules of the DBMS, the Access Methods, the Bu�er Manager and the Storage Manager. This modular structure hides the di�erent semantic data levels from the Executor. Now, we describe those semantic data levels and the communication data structures for the lower modules of the DBMS. The tables of a Database are stored as les following a given logic structure. The Storage Manager is responsible for both managing those les and accessing them to provide le blocks to the Bu�er Manager. The Bu�er Manager is responsible for managing the blocks stored in memory similarly to the way the OS Virtual Memory Manager does. The Bu�er Manager provides memory blocks to the Access Methods Module. The Access Methods of a RDBMS provide tuples to the Executor module. Depending on the organization of each table, the Access Methods will traverse the required index structures and plain database tables stored in the blocks managed by the Bu�er Manager. Each DBMS will implement di�erent Access Methods for its own index and database table structures.
2.2 PostgreSQL PostgreSQL is a public domain, client/server database developed at the University of California-Berkeley. PostgreSQL is an evolution of the Postgres database [23] which has led to commercial products now being comercialized by Informix with the name of Illustra or being distributed for free as part of the Debian 2.0 \hamm" Linux distribution. PostgreSQL runs on many di�erent platforms, it is quite popular and well tuned for a system developed in academia. PostgreSQL has a client/server structure and compromises three types of processes; clients, backends and a postmaster. Each client communicates with one backend that is created by the postmaster the rst 5
time the client queries the database. The postmaster is also in charge of the initialization of the database. The structure of the server backend of PostgreSQL corresponds to that of a general DBMS that we explained before. The query execution kernel has the modular structure shown in Figure 1. The execution of a query in PostgreSQL is performed in a pipelined fashion. This means that each operation passes the result tuples to the parent operation in the execution plan as soon as they are generated, instead of processing their whole input and generating the full result set. This explains the lack of loops and the long code sequences found in the PostgreSQL and other DBMS kernels [16]. To illustrate this execution model, we will use the example query in Figure 2. The Executor builds the result table by iteratively asking the Join operation for a result tuple, one at a time. To obtain a result tuple, the Join operation needs tuples from both scans. The Join operation requests a tuple from the leftmost Scan, which selects the rst valid tuple from the Order table. Then, the Join operation requests a tuple from the rightmost Scan which selects a tuple from the Customer table. Once the Join has a tuple from each scan, it checks the Join condition on the speci ed attributes and passes the result tuple to the query Executor. As new result tuples are requested by the query Executor, the Join operation will keep requesting tuples to the rightmost scan until table Customer is nished. For each tuple of table Order, a full traversal of table Customer will be done, tuple by tuple as requested by the Join operation. The Scan operations call the Access Methods to get new tuples from Database tables. The Access Methods will access tuples in the pages provided by the Bu�er Manager, wich in time, requests the pages from disk to the Storage Manager.
2.3 DSS Workloads and TPC-D In this paper we use the Transaction Processing Performance Council benchmark for Decision Support Systems (TPC-D) [26] as a workload for our experiments. DSS workloads imply large data sets and complex, read-only queries that access a signi cant portion of this data. TPC-D has been described in the recent literature on the topic [1, 25] and for this reason we do not give a detailed account of it. At a glance, the TPC-D benchmark de nes a database consisting of 8 tables, and a set of 17 read-only queries and 2 update queries. It is worth noting that the TPC-D benchmark is just a data set and the queries on this data; it is not an executable. The tables in the database are generated randomly, and their size is determined by a Scale Factor. The benchmark speci cation de nes the database scale factor of 1 corresponding to a 1GB database. There are no restrictions regarding the indices that can be used for the database.
6
3 Experimental Setup We set up the Alpha version of the Postgres 6.3.2 database on Digital Unix v4.0 compiled with the ?O3 optimization ags and the cc compiler. A TPC-D database is generated with a scale factor of 0.1 (100Mb of data). With the generated data we build two separate databases, one having Btree indices and the other having Hash indices. Both databases have unique indices on all tables for the primary key attributes (those attributes that identify a tuple) and multiple entry indices for the foreign key attributes (those attributes which reference tuples on other tables). More indices could be created to accelerate the query execution, but we were more interested in the database behavior than in the performance of the benchmark. We run the TPC-D queries on the PostgreSQL database management system assuming the data is disk resident, not memory resident. We do not perform any warm up to load the database in memory, so TPC-D data must be loaded for every new query. The set of queries used to obtain the pro le information and the ones used to evaluate the performance of our method are shown in Table 1. The Training set is executed on the Btree indexed database only, and the Test set is executed on both the Btree and the Hash indexed databases. Query
1
2
3
4
5
6
7
8
9
10
11
12
13
14
15
16
Training Set
-
-
X
X
X
X
-
-
X
-
-
-
-
-
X
-
17 -
Test Set
-
X
X
X
-
X
-
-
-
-
X
X
X
X
X
-
X
Table 1: Queries used to obtain the pro le information and to test our proposed algorithm. ATOM is a static binary translator that allows the instrumentation of an executable program. We used ATOM to analyze the instruction reference stream and to simulate several cache organizations and code layouts.
4 Workload Analysis To gain insight on the internal workings of PostgreSQL we identi ed the entry points to the di�erent modules of the database. We instrument the database and insert code before and after each of those functions to count the number of instructions executed and the i-cache misses of each database module. The numbers obtained are re ected in the bottom row of Table 2 and show results for a direct mapped 32KB i-cache. For a sample execution of read-only queries on the Btree indexed database, a total of 169.5 billion instructions were executed, and 4.8 million cache misses were registered (a 2.8% base miss rate). As could be expected, most of the instructions belong to the query execution kernel. Less than 1% of the 7
instructions belong to the user interface and the query optimizer levels, while 63% of the instructions belong to the Executor module. Nevertheless, the Access Methods and Bu�er Manager account for 35% of the instructions, reaching 70% for some queries [19]. Looking at the i-cache misses, we observe that while the Executor is responsible of 63% of the executed instructions, only 53% of the misses correspond to that module. Meanwhile, the Access Methods gather 26% of the misses, for only 15% of the executed instructions. That is due to the fact that the Executor concentrates the few loops present in the database code, while the Access Methods are sequential functions, with few or no loops, and consist of many di�erent functions referenced from several places which tend to con ict in the cache, replacing each other. We were interested in learning which Executor operations were responsible for these instructions in the lower levels of the database. By modifying our instrumentation, we also counted the number of instructions and i-cache misses of each operation and the lower level functions called by those operations. We obtained the two dimensional matrix shown in Table 2. Dashes mean that no instructions were executed for that segment, while zeros represent an insigni cant fraction of the total number of instructions. Other Hash Join Hash Aggregate Group Sort Merge Join Nest Loop Index scan Seq. scan Result Qualify Total
Other Parser 0.2/0.0 0.0/0.0 { { { { { { { { { { { { { { { { { { { { { { 0.2/0.0 0.0/0.0
Optimizer Executor 0.7/0.0 0.1/0.1 { 0.0/0.0 { 0.0/0.0 { 0.2/0.2 { 0.5/0.5 { 1.0/0.3 { 0.5/1.6 { 1.4/1.4 { 9.4/20.3 { 2.8/3.1 { 0.6/0.9 { 46.8/25.3 0.7/0.0 63.4/53.8
Access 0.1/0.1 { { 0.0/0.0 { { 0.0/0.0 0.2/0.4 11.2/18.4 3.7/7.3 0.0/0.0 0.0/0.0 15.2/26.2
Bu�er Storage 0.0/0.0 0.0/0.0 { { { { 0.0/0.0 0.0/0.0 { { { { 0.0/0.0 0.0/0.0 0.0/0.0 0.0/0.0 13.3/13.0 0.9/3.0 6.2/3.8 0.0/0.0 0.1/0.0 0.0/0.0 0.0/0.0 0.0/0.0 19.7/16.9 0.9/3.0
Total 1.2/0.3 0.0/0.0 0.0/0.0 0.2/0.2 0.5/0.5 1.0/0.3 0.5/1.7 1.6/1.8 34.8/54.6 12.7/14.3 0.8/0.9 46.8/25.3 100.0/100.0
Table 2: Percentage of the total number of dynamic instructions/i-cache misses for each database level and each executor operation for a sample run of read-only queries on the Btree indexed database. Misses are for a direct mapped 32KB cache. The most important operations are the Qualify operation and the Index and Sequential scan. The Qualify operation is responsible for checking whether a tuple satis es a set of conditions or not, isolating all other Executor operations from the complexity of data types and operators. The Scan operations are responsible for most of the data access in the query execution. Indeed, almost all the references to 8
the Access Methods and the Bu�er Manager belong to the Scan operations. The Sequential scan makes heavier use of the Qualify operation as it must check all tuples in the scanned table, while the Index scan needs to check fewer tuples, because only those tuples that satisfy the index condition will be accessed. The Index scan is responsible of 54% of the misses for only 34% of the instruction references. Most of the misses due to the Index scan are found in the Executor and the Access Methods modules. The Index scan operation accounts for so many misses due to its irregular behavior, using many di�erent Access Methods routines to access both indices and database tables. Meanwhile, the Sequential scan has fewer misses, because it only accesses database tables, using less Access Methods routines. On the other hand, the Qualify operation is responsible for 25% of the misses, while it gathers as much as 46% of the executed instructions. Its heavy use, and the repeated evaluation of the same conditions across a given query make it easy for the cache to hold its working set. We conclude that the Executor module, and the Qualify and Scan operations in particular, concentrate most of the executed instructions. Also, the Access Methods and Bu�er Manager modules must be taken into account as they concentrate a large percentage of the total i-cache misses.
5 Analysis of the Instruction Reference Patterns Next we examined the instruction reference patterns of the database focusing on locality issues by counting the number of times each basic block is executed, and recording all basic block transitions. Based on the importance of the Qualify and Scan operations, and the large number of misses attributed to the Access Methods and Bu�er Manager modules (see Section 4) we select a subset of the TPC-D queries based on the scan operations used by the query. The selected queries are the Training set shown in Table 1. This set also includes queries with and without an extensive use of the Aggregate, Group and Sort operations, because they need all their children's results to be executed. This stops the normal pipelined execution of queries in the PostgreSQL database, and implies the storage of large temporary results. Furthermore, these operations store and access the temporary data without going through the Access Methods, which makes them somehow unique. Instrumenting the database and running the Training set, we obtained a directed graph with weighted edges. There is one node for each basic block. An edge connects two basic blocks p and q if q is executed after p. The weight of an edge pq is equal to the total number of times q has been executed after p. The number of times a basic block has been executed can be obtained by adding the weight of all outgoing edges. All unexecuted basic blocks and transitions are pruned from the graph.
9
5.1 Reference locality The data in Table 3 illustrates an important characteristic of the database code. Only 12.7% of the static instructions were referenced for an execution of the Training set, which means that the database contains large sections of code which are rarely accessed. This is because the database must be able to manipulate many di�erent data types and perform many special case operations that happen very infrequently, or can be found only in very special setups, but must be included for completeness. Static Procedures 6.813 Basic blocks 127.426 Instructions 593.884
Dynamic Percent 1.340 19.7% 15.415 12.1% 75.183 12.7%
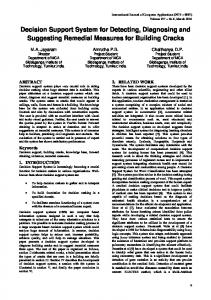
Table 3: Static and dynamic footprint for the database. Numbers include the dynamically linked libraries This characteristic can be graphically observed in Figure 3. The graph shows the accumulated number of references to each basic block. In the Figure we can see the uneven distribution of references. It is clear that only a small part of the code is accessed, and that there are parts more popular than others.
Number of References
1E+08
5E+07
bt_compare EvalExpr equal
BufferIsValid
hash_search
memcmp
mb
Basic Block
Figure 3: Accumulated number of references to each basic block for an execution of the Training set. The peaks present in Figure 3 correspond to the data access routines, the condition evaluation and the comparison operations. This large concentration of references was to be expected attending to the data obtained from Tables 2 and 3. By ordering the basic blocks in descending order of references and accumulating them, we obtain Figure 4. This plots the percentage of the total number of basic block references as a function of the number of basic blocks. We observe that with only 1000 basic blocks (which represent 0.7% of the static basic blocks, 6.5% of the dynamic ones) we accumulate 90% of the references. With 2500 basic blocks (the maximum number present in the Figure) we obtain 99.26% of the references. 10
Acumulated references (%)
80
60
40
20
0
500
1000
1500
2000
2500
Number of Basic Blocks
Figure 4: Percentage of total basic block references for a number of basic blocks. This large concentration of the basic block references implies a large potential for exploiting locality. To further explore temporal locality, we counted the number of instructions that were executed between two consecutive invocations of a basic block. Figure 5 shows the distribution for 495 basic blocks included in the most popular routines of the code which capture 73% of all the basic block references. The basic blocks in this set, have a probability of 33% of being re-executed in less than 250 instructions, and as much as 19% of being referenced twice in less than 100 instructions. As we have shown, the database has relatively few loops, and the most popular routines are called from many di�erent places, but out of loops. Between two consecutive invocations of one of these popular routines, the database may execute some code that would end up displacing this code form the cache before it is reused. This shows that there is substantial temporal locality to be exploited. As we will show, our method keeps the most frequently executed segments of code in a reserved area of the cache, so that they will not con ict with other code, saving many con ict misses. 100
Percentage of invocations
80
60 Acumulated percent Individual contribution 40
20
0 0-25
26-100
101-250
251-500
501-1000
1001-2000
2001-5000
+5000
Number of instructions between two consecutive references
Figure 5: Temporal locality analysis for a selection of 495 basic blocks included in the most popular routines of the code. These basic blocks represent 73% of the total basic block references. 11
5.2 Execution determinism Next, we study how deterministic are the sequences of executed basic blocks, independently of how far apart in the code these basic blocks are, because we can always move them closer in memory and expose more spatial locality in the form of long sequences of instructions that will be executed consecutively. We classify basic blocks in one of four kinds attending at how they a�ect the program ow. Fallthrough basic blocks do not end with a branch instruction, so execution always continues on the next basic block. Branch basic blocks end with a conditional or unconditional branch, so after a Branch basic block a maximum of two di�erent basic blocks may be found. Subroutine call basic blocks end with a subroutine invocation, an may have many successors. Return basic blocks end with a subroutine return, and may have many possible successors, as a subroutine may be referenced from several places. BB Type Static number Static % Branch 54.026 42.4% Fall-through 31.120 24.4% Subroutine call 10.228 8% Subroutine return 32.052 25.2%
Dynamic number Dynamic % 4.0 billion 50.2% 1.8 billion 22.4% 1.1 billion 13.7% 1.1 billion 13.7%
Table 4: Number of basic blocks of each type, both static and dynamic Figure 6 gives some evidence of the determinism with which database code is executed. The gure shows the percentage of outgoing arcs that have a given probability of being followed, given the basic block they leave is executed. Only the conditional branches are shown here, as fall-through basic blocks, subroutine calls and subroutine returns are predictable. The graph has been cut at 5%, but the rightmost peak reaches 55.6%. Up to 55.6% ->
5
Number of arcs (%)
4
3