Nov 7, 2014 - latent community structure is a crucial problem in social network analysis. ... Builder. Graph Storage. Detecting. Processor. Centrality. Computer.
CoDEM: An Ingenious Tool of Insight into Community Detection in Social Networks ∗ Meng Wang, Chaokun Wang, Jun Chen School of Software, Tsinghua University, Beijing 100084, China
{meng-wang12, chaokun, junchen12}@tsinghua.edu.cn
ABSTRACT
Displayer
Configurator Algorithm Selector
In recent years, community structure has attracted increasing attention in social network analysis. However, performances of multifarious approaches to community detection are seldom evaluated in a suite of systematic measurements. Furthermore, we can hardly find works which reveal diverse features based on the detected community structure. In this paper, we build a tool called CoDEM to make both quality evaluations of community detection and an in-depth mining for pivotal nodes inside communities. This tool integrates several effective approaches to community detection, establishes an overall evaluation system and gets the multi-dimensional ranking for the local importance of nodes. Moreover, the tool is built with a friendly user interface.
Parameter Setup
Evaluator
Processor
Core Detector Detecting Processor
Community Collector
Multi-Views Generator
Result Integrator
Inner Miner Centrality Computer
Keynode Finder
Effectiveness Evaluator
Accuracy Evaluator
Graph Storage Graph Model Builder
Data Importer
Categories and Subject Descriptors H.3.3 [Information Search and Retrieval]: Clustering; D.2.8 [Software Engineering]: Metrics—complexity measures, performance measures
Keywords Community Detection, Evaluation, CoDEM
1.
Metric Customizer
Visualization Interface
OVERVIEW OF CODEM
Social networks usually possess inherent communities where members cluster together to form closely connected groups. Revealing latent community structure is a crucial problem in social network analysis. It also leads to advances in various social network services and applications. Considering the diversity of datasets and various perspectives to address this issue, it is a puzzle to choose a best-performed approach from the abundant candidates. Although a comparative study [8] has been proposed recently, up to now, we do not have a suite of systematic evaluation metrics to make a comprehensive comparison based on the quality of the community assignment. Moreover, to explore the formation and evolution of the ∗Corresponding author: Chaokun Wang.
Permission to make digital or hard copies of part or all of this work for personal or classroom use is granted without fee provided that copies are not made or distributed for profit or commercial advantage, and that copies bear this notice and the full citation on the first page. Copyrights for third-party components of this work must be honored. For all other uses, contact the owner/author(s). Copyright is held by the author/owner(s). CIKM’14, November 3–7, 2014, Shanghai, China. ACM 978-1-4503-2598-1/14/11. http://dx.doi.org/10.1145/2661829.2661831.
File System
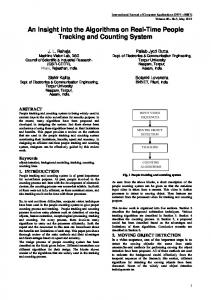
Figure 1: The System Architecture of CoDEM massive groups, mining important features of them is also a significant work. Since members of a community usually play various roles, those high-impact or pivotal members are always the people we are interested in. Therefore, an ingenious tool of insight into community detection to solve these problems is worth expecting. In this paper, we present a tool called CoDEM for Community Detection Evaluating and Mining. Different from the existing tools, such as Gephi1 and Graphviz2 , CoDEM aims at the evaluation of community detection, not only the ways of visualization. In addition, it does not focus on the global network analyses, but the insight into communities. More specifically, CoDEM has the following characteristics: • Many well-performed community detection approaches of various categories are integrated in this tool, including NewmanClauset Fast Greedy method [5, 2], Label Propagation method [7], Top Leaders method [4], and Dense Subgraph Extract method [1]. • It adopts a suite of objective metrics to make the evaluation, such as modularity, strength, clustering coefficient and purity. The employed metrics embody full structure characteristics of communities. • A variety of centralities in social network analysis are used to indicate the local (intragroup) importance of nodes. Then, inside keynodes can be mined by some multi-dimensional ranking method, such as the Fagin algorithm [3]. 1 https://gephi.github.io/ 2 http://www.graphviz.org/
2006
• Moreover, CoDEM provides a friendly user interface, including customizable setup and multiple novel views for display.
2.
into different groups. The h modularity � �iQ of a community assignIi 2Ii +Oi k ment is defined as ∑i=1 m − where Ii indicates the total 2m number of internal relationships within the community Ci , Oi indicates the number of outgoing relationships between nodes in Ci and any node outside. Strength of a community is more intuitive to show whether the internal linkages among its members are stronger than those outside. We inherit Radicchi’s definitions [6] to classify communities by the intensity. Given a node v, kvin and kvin stand for degrees within and without the community C, respectively. Then, the community C is called strong if kvin > kvout for ∀v ∈ C, and is called weak if ∑v kvin > ∑v kvout for ∀v ∈ C. Any group which does not satisfy any of the two criteria above will be invalid. We attach labels to each discovered community. Besides that, we also present the corresponding proportions of the two categories. Clustering Coefficient of a community focuses on the members’ tendency to form a tightly intertwined group. In social networks, clustering coefficient may indicate the possibility that two friends of someone happen to be friends as well. The local computation T 2|{ets :vt ,vs ∈N(v) Ci ,ets ∈E}| where for a community Ci is CCi = ∑v∈Ci kv (kv −1) N(v) is the neighbors of node v, kv is the degree of v, and Ci is the ith community. Purity shows the accuracy of the discovered communities versus the ground truth [4]. On this occasion, we can get the disparity between the result produced by the algorithm and that in the real world. Suppose Rd and Rr are two different results of the same 0 0 graph with n nodes. Rd includes s subsets {Cd 1 , ...,Cd k1 }, and Rr includes t similar subsets. The purity of the detected result Rd is 0 0 defined as P (Rd , Rr ) = 1n ∑ j maxi |Cd j ∩Cr i |.
SYSTEM DESIGN AND WORKFLOW
The major functions of our CoDEM have been implemented in standard C++; the data-driven technique D33 is adopted for the visualization. According to the system function and workflow, CoDEM consists of four basic modules: Displayer, Processor, Evaluator and Graph Storage (as shown in Fig. 1) . They can be mapped to different system layers, and we will introduce them in further detail below. User Access Layer. The included Configurator covers selections and requisite parameters of algorithms as well as the customized evaluation metrics. The overall setup will be sent out for both detection and evaluation. Displayer itself also accepts and presents the produced results from the evaluation layer in various views, such as table, diagram and multiple graph displays. Core Processing Layer. The Core Detector is mainly responsible for the implementation of community detection approaches. Apart from that, the detector is extendible and any other method can be implemented in it easily. The Inner Miner aims at finding the pivotal nodes inside a community by a series of node centralities (degree, betweenness, closeness and PageRank). Considering the customized centralities, the ranking of nodes inside the community can be obtained by the Fagin algorithm as an example. Core Evaluation Layer. With insight into community detection, the Evaluator covers both effectiveness and accuracy. In CoDEM, comparisons are made in this layer based on the customized metrics which are reasonable, recognized and comprehensive enough. Then, evaluation results upon different metrics of all approaches are integrated and ultimately organized from multiple views. Data Storage Layer. Any network in a certain format can be imported from the browser; the same as the ground truth file if we have one. Datasets here consist of two parts. First, we use the wellknown datasets which have the corresponding ground truth, such as Karate-Club, Strike and Football-NCAA. Moreover, we also use large-scale networks in the Stanford Large Network Dataset Collection4 . The established graph model records attributes of nodes and edges in the whole detection and evaluation process.
3.2
Multi-Dimensional Keynode Mining
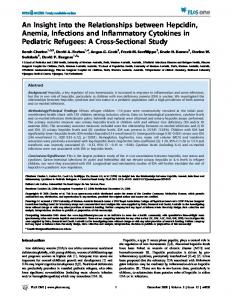
As mentioned before, CoDEM adopts four centralities to indicate the local importance of nodes. Using some multi-dimensional ranking method, such as the Fagin algorithm, local rankings of nodes can be produced according to the multi-dimensional scores. As shown in Fig. 2, the process of keynode mining can be personalized via the optional indicators below. multi-dimensions community ranking
3.
SYSTEM FEATURES
CoDEM consists of two prime processes: 1) evaluating the detected communities; 2) mining the keynodes inside them.
3.1
A
Overall Evaluation of Communities
C
B
leaders
Many approaches are proposed along with the performance test by the only criterion. In addition, many former evaluations have overfull dependence on the ground truth. Actually, we have confronted two problems in this field: 1) In practice, we can hardly know what the exact community assignment is in the real world; 2) The single criterion cannot represent the performance of an approach objectively. Therefore, in CoDEM, metrics from multiple aspects are employed to make the evaluation of community detection. Modularity [2] is the most widespread quality function for community detection. Essentially, modularity compares the result with a randomized one to indicate how reasonable the nodes are assigned
members
Figure 2: Keynode Mining Degree. High-degree nodes, such as A and B, inside a community usually play as the cores. Betweenness. Generally, the community structure is hierarchical. Nodes with high betweenness, such as C, can bridge the connections among different smaller groups. Closeness. It simply shows the ability of transmission, that is how close a member is with all the other ones via indirect relations inside the community. PageRank. Pivotal nodes are likely to receive high-quality links from others, therefore, the influence of a node can be obtained via its intragroup neighbours.
3 http://d3js.org/ 4 http://snap.stanford.edu/data/
2007
4.
DEMONSTRATION
In this section, an example is given to demonstrate how CoDEM works. Setup. First, on the setup page, we can upload a network file, e.g. Strike, as well as the available ground truth. Then the basic information will be shown in the right information bar. We can find that the network has 24 nodes and 76 relationships and it is an undirected network with weight=1 on each relationships. Then, we can make a personalized setup since approaches in the category lists, requisite parameters and evaluation metrics are all customizable for users. Note that some approaches assign each node to a certain community. However, in social network theory, the entire network always consists of grouped members and independent outliers. Therefore, based on the results by algorithms, we can set the global filter to 2 to eliminate tiny groups, making the evaluation more fair and reasonable. Display for Evaluation. After clicking the button “Compare”, the integrated evaluation results can be shown in the “Table” view (Fig. 3). We can get the overall results and find which approach stands out clearly w.r.t. the current dataset. Results, including modularity, strength (percentages of strong and weak communities), maximal clustering coefficient, purity and time cost, of different approaches from various perspectives are shown together. Therefore, we can make full use of the information to analyze the differences among various kinds of approaches. We can find that label propagation algorithms perform better on this dataset. Furthermore, histograms in the “Chart” view can intuitively rank the approaches according to a specific metric so that the variances in the aspect can be shown clearly.
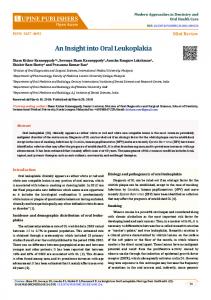
(a) Relation View
(b) Community View
Figure 4: Two Views of the Community Structure selecting the criteria to measure the local importance of nodes as well as a given k (say 3), we can click the button “Find Key Nodes”. Then, a relation view will be shown, where the top-k keynodes are highlighted by size based on the overall scores. Similarly, both table and chart view are provided so that we can make a comparison of different centralities, total scores and rankings of nodes. All in all, CoDEM is extensible and modularized in the implementation for a lot of sound design. Besides the approaches already adopted in this tool, other community detection approaches can be appended easily.
5.
CONCLUSIONS
CoDEM is designed for customizable evaluations on the communities detected by various approaches. It is quite helpful for users to analyze the results of diverse approaches on different datasets. Moreover, it provides the multi-dimensional in-depth mining of the inside keynodes. Either the optional quality metrics or the centralities are representative and all-around. The results are presented in a nice user interface as well as various novel views. As the future work, we will try to reveal other important features related to the community structure to enrich this tool.
6.
ACKNOWLEDGMENTS
This work was supported by the National Natural Science Foundation of China (No. 61170064, No. 61373023) and the National High Technology Research and Development Program of China (No. 2013AA013204). Figure 3: Evaluation Results
7.
REFERENCES
[1] J. Chen and Y. Saad. Dense subgraph extraction with application to community detection. IEEE TKDE, 24(7):1216–1230, 2012. [2] A. Clauset, M. E. Newman, and C. Moore. Finding community structure in very large networks. Physical review E, 70(6):066111, 2004. [3] R. Fagin, A. Lotem, and M. Naor. Optimal aggregation algorithms for middleware. JCSS, 66(4):614–656, 2003. [4] R. R. Khorasgani, J. Chen, and O. R. Zaïane. Top leaders community detection approach in information networks. In SNMA, 2010. [5] M. E. Newman. Fast algorithm for detecting community structure in networks. Physical review E, 69(6):066133, 2004. [6] F. Radicchi, C. Castellano, F. Cecconi, V. Loreto, and D. Parisi. Defining and identifying communities in networks. PNAS, 101(9):2658–2663, 2004. [7] U. N. Raghavan, R. Albert, and S. Kumara. Near linear time algorithm to detect community structures in large-scale networks. Physical Review E, 76(3):036106, 2007. [8] J. Xie, S. Kelley, and B. K. Szymanski. Overlapping community detection in networks: The state-of-the-art and comparative study. ACM Computing Surveys (CSUR), 45(4):43, 2013.
Entries for Details. If we want to find some more details about the results, we can utilize the entries for details. In Fig. 3, if we click the first yellow button “Show Graph”, the detected communities in both the “Community” view (Fig. 4(b)) and the “Relation” view (Fig. 4(a)) will be shown. The former clearly presents the community structure and the latter shows the assignment in the relational graph by different colors. In Fig. 4, we can find that the result of the original label propagation algorithm is nearly consistent with the ground truth. If we click the next button “Detail Table”, details about each community, including the size, members, strength (labeled as “strong”, “weak” or “neither”) and the clustering coefficient will be shown. Combined with the above results, we can make a comparison of these approaches intuitively. Suppose that an approach performs terribly in modularity, we may find that the color distribution is scattered in the relation view. If an approach reacts badly in most cases, we may think that it does not perform well enough. Keynode Mining. The right-most button “Show KeyNodes” links to the other page to mine keynodes inside each community. After
2008