Dec 17, 2007 ... CoDeSys Visualization i. Table of Content. 1 Advantages of an integrated
visualization. 1-1. 2 The Visualization Editor in CoDeSys. 2-1. 2.1.
CoDeSys Visualization Supplement to the User Manual for PLC Programming with CoDeSys 2.3
Copyright 2003, 2004, 2005, 2006, 2007 by 3S - Smart Software Solutions GmbH All rights reserved.
We have gone to great lengths to ensure this documentation is correct and complete. However, since it is not possible to produce an absolutely error-free text, please feel free to send us your hints and suggestions for improving it.
Trademark Intel is a registered trademark and 80286, 80386, 80486, Pentium are trademarks of Intel Corporation. Microsoft, MS, MS-DOS and Intellisense are registered trademarks, Windows is a trademark of Microsoft Corporation.
Publisher 3S - Smart Software Solutions GmbH Memminger Straße 151 DE-87439 Kempten Tel. +49 831 5 40 31 - 0 Fax +49 831 5 40 31 – 50
Last update 17.12.2007 Document Version 3.0, CoDeSys V2.3.9.0
Content
Table of Content 1 Advantages of an integrated visualization
1-1
2 The Visualization Editor in CoDeSys
2-1
2.1 2.2 2.3 2.4 2.4.1 2.4.2 2.4.3
Create a new Visualization ................................................................................ 2-2 Visualization Elements, Insert............................................................................ 2-2 Positioning of Visualization Elements... ............................................................. 2-6 Visualization, Configure - Overview ................................................................... 2-9 Visualization Elements, Configure... .................................................................. 2-10 Visualization Object, Configure.......................................................................... 2-53 Image files in the visualization ........................................................................... 2-58
3 Language switching in the Visualization 3.1 3.2 3.2.1 3.2.2 3.3
3-1
Static language switching .................................................................................. 3-1 Dynamic Language switching ............................................................................ 3-3 Configuration...................................................................................................... 3-3 XML-File for Dynamic Texts............................................................................... 3-4 Calling up language-dependent Online Help via a visualization element .......... 3-8
4 Placeholder Concept
4-1
5 Visualization in Online Mode...
5-1
5.1 5.2 5.3 5.4
Overview ............................................................................................................ 5-1 Operation over the keyboard - in online mode................................................... 5-1 'File' 'Print' in online mode.................................................................................. 5-2 Access Protection in multi-client operation ........................................................ 5-2
6 Visualizations in libraries...
6-1
7 CoDeSys HMI
7-1
7.1
Installation, Start and Operating ........................................................................ 7-1
8 Web-Visualization 8.1 8.2 8.3 8.4 8.5 8.6 8.7
Preconditions ..................................................................................................... 8-1 Status check, Auto-Reload, File error_ini.xml.................................................... 8-1 Editing the WebVisu.htm file .............................................................................. 8-2 Preparing a Web-Visualization in CoDeSys....................................................... 8-4 Configuration and Start of the Web Server ........................................................ 8-4 Calling a Web-Visualization via Internet ............................................................ 8-6 Restrictions and Special Features ..................................................................... 8-7
9 Target-Visualization 9.1 9.2 9.3 9.4 9.5
8-1
9-1
Preconditions ..................................................................................................... 9-1 Creating a Target-Visualization.......................................................................... 9-1 Starting the Target-Visualization........................................................................ 9-4 Scan of mouse-clicks and dynamic texts ........................................................... 9-4 Restrictions ........................................................................................................ 9-5
10 APPENDIX
CoDeSys Visualization
10-1
i
Content
Appendix A
Implicit Variables in the Visualization
10-1
Appendix B
Example Dll for ActiveX Control
10-3
Appendix C
Possible Key Combinations
10-5
Index
ii
9
CoDeSys Visualization
1 - Advantages of an integrated visualization
1
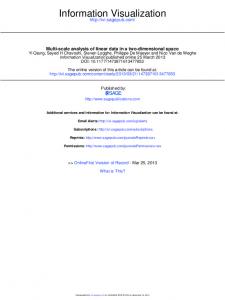
Advantages of an integrated visualization For visualizing, that means watching and operating the data of a controller which has is programmed with CoDeSys, no additional tool is required. The programming system contains an integrated visualization editor (see CoDeSys User Manual), allowing the user to create visualization objects to the parallel to the development of the application in the same user interface. The integration offers a lot of benefits: The visualization integrated in CoDeSys does not need a tag list and it can directly access the variables in the controller. Any OPC- or DDE-layer, which often is difficult to configure, is also not necessary, because the communication is done by the same mechanism which is used for the programming system. Thus the engineering effort for the realization of visualizations will be clearly reduced. Besides that the connection of controller and visualization allows running modes (see below), in which the conventional display on a PC with a monitor is not needed any longer. One of the main advantages of the concept: The visualization masks which are created in the programming system can run in four different modes without requiring any modifications, if desired even parallel: 1. Directly in the programming system For testing the created visualization masks, but also for service or diagnosis purposes in direct connection with the controller you do not need a further tool: In online mode you immediately get a display of the visualizations within the programming system. CoDeSys
CoDeSys HMI
XML WebVisualisierung
ST-Code TargetVisualisierung
2. CoDeSys HMI The program CoDeSys HMI, which displays visualizations on a PC without the complete development user interface, also communicates via the programming interface. The configuration of OPC (OPC OLE for Process Control) – resp. DDE (DDE – Dynamic Data Exchange) interface is not necessary. See chapter0. 3. Web-Visualization Optionally CoDeSys generates a description in XML format from the visualization data, which is loaded to the controller together with a Java-Applet (Applet – a program developed in the programming language JAVA, which can be processed by browsers) and which can be displayed via TCP/IP on a browser. Thus the visualization data are available online on various platforms. See chapter 8.
CoDeSys Visualization
1-1
1 - Advantages of an integrated visualization
4. Target-Visualization For controllers with integrated display the visualization data can be loaded from the programming system together with the application to the target system. There they get displayed automatically. This solution can be portated with low effort to any devices which are programmable with CoDeSys. See chapter 9. Overview on the functions:
• Elements -
Rectangle, Ellipse, Rounded rectangle
-
Line, Polygon, Polyline, Curve
-
Bitmap, WMF-file
-
ActiveX Control
-
Button, Table, Histogram, Bar Display, Meter
-
Reference to another visualization (instance)
• Animations (depending on element type): -
Text display
-
Color changes
-
Visible/Invisible
-
Shift
-
Rotation
-
Scaling
-
Offset on the particular edges of an object (for Bar Display)
-
Button activ/inactiv
-
Current line (only text display)
• Input possibilities: -
Toggle/tap Boolean value
-
Text input
-
Change of visualization
-
Special actions (Leave visualization, Read/Write receipts, Switch language, call external EXE etc.)
-
Choose line (only text display)
• Further properties
1-2
-
Switching language
-
Tooltips for all elements
-
ASCII Import/Export
-
Background Bitmap
-
Master layout
-
Automatic Scaling
-
Drawing operations: Alignment, Order, Grouping
-
Placeholder concept for creating objects with complex graphic elements
-
Programmed visualization expressions
CoDeSys Visualization
2 - The Visualization Editor in CoDeSys
2
The Visualization Editor in CoDeSys The CoDeSys visualization is a graphical representation of the project variables which allows inputs to the PLC program in online mode via mouse and keypad. The CoDeSys visualization editor, which is part of the programming system, provides graphic elements which can be arranged as desired and can be connected with project variables. Thereupon in online mode the look of the graphical elements will change depending on the variables values. Simple example: In order to represent a fill level, which is calculated by the PLC program, draw a bar and connect it to the corresponding project variable, so that the length and color of the bar will show the current fill level value. Add a text field which will display the current value in a text string and a button for starting and stopping the program. The properties of a single visualization element as well as of the whole visualization object will be defined in appropriate configuration dialogs and in the object properties dialog. There it is possible to set basic parameters by activating options as well as to define a dynamic parameterizing by entering project variables. Additional special possibilities for configuring are given by the programmability of element properties via structure variables. Using placeholders in the configuration dialogs may save a lot of effort in case you want to use the same visualization object several times with different configurations. The visualization which is created in the programming system will in many cases be used as the only user interface available for controlling and watching the associated PLC program in online mode. For this purpose it must be possible to give inputs to the program solely by activating visualization elements. To reach this you can use special input possibilities during the configuration of the visualization and you have the option to define special hotkeys for each particular visualization. A visualization created in CoDeSys can later be used in different ways: • It can be made available on CoDeSys HMI, a special runtime system for operating the visualization in full screen mode on a PLC computer. • It can be made available as a Web-Visualization, which allows to call and operate it via the Internet (useful for remote maintenance purposes) • It can be made available as a Target-Visualization, which can be started directly on the PLC. Example of a visualization
CoDeSys Visualization
2-1
2 - The Visualization Editor in CoDeSys
2.1
Create a new Visualization A visualization object is a CoDeSys object which is managed in the 'Visualization' register of the Object Organizer. It contains an arrangement of visualization elements and can get certain object properties. One or several visualization objects can be created in a CoDeSys project and might be linked with each other. In order to create a visualization object in the Object Organizer, you must select the register card for Visualization in the Object Organizer. Using the 'Project' 'Object Add' command, you can create a new visualization object. Open the 'New visualization' dialog, in which you can enter the name of the new visualization. Once a valid entry is made, that is not a name that is already in use and no special characters used, you can close the dialog with OK. A window opens, in which you can edit the new visualization. When the visualization object is marked in the Object Organizer, via command 'Project' 'Object' 'Properties' (see CoDeSys User Manual) the Properties dialog can be opened, where you can make settings concerning the usage of the object in a Web- or Target-Visualization as well as concerning a Master layout. When defining the name of the visualization object, please regard the following: 1. A visualization named “PLC_VISU” per default automatically will be used as start visualization in a Target- or Web-Visualization resp. in CoDeSys HMI, if there not explicitly another visualization is configured for this purpose. 2. A visualization may not get the same name as another object within the project because this would result in problems when changing between visualizations. Please regard: If you want to use the implicit variable CurrentVisu (type STRING) for addressing the currently opened visualization object, for compiler versions < V2.3.0.7, and if the library SysLibStr.lib is not included in the project, you must use capital letters for the names of the visualization objects (e.g. "PLC_VISU"). (For information on implicit variables see 10)
2.2
Visualization Elements, Insert... A visualization element is a graphical element, which is used to fill a visualization object. The available elements are offered in the CoDeSys menu bar. Each element gets a separate configuration. You can insert various geometric forms, as well as bitmaps, metafiles, buttons and existing visualizations, into your visualization. Geometric forms at your disposal include: rectangles, rounded rectangles, ellipses/circles, and polygons. Go to the 'Insert' menu item and select freely from the following commands: 'Rounded
Rectangle',
'Bitmap',
'Ellipse',
'Visualization',
'Polygon'‚
'Button',
'Table',
Polyline',
'Rectangle', 'Curve',
'ActiveX-Element',
'Pie', ‘Scrollbar’,
'Meter', 'Bar Display', 'Histogram', 'Alarm table', 'Trend', 'WMF file'. A check appears in front of the selected command. You can also use the tool bar. The selected element appears pushed down(e.g.
).
If you now go to the editor window with the mouse, you will see that the mouse pointer is identified with the corresponding symbol (e.g. ). Click on the desired starting point of your element and move the pointer with pressed left mouse key until the element has the desired dimensions.
2-2
CoDeSys Visualization
2 - The Visualization Editor in CoDeSys
If you want to create a polygon or a line, first click with the mouse on the position of the first corner of the polygon resp. on the starting point of the line, and then click on the further desired corner points. By doubleclicking on the last corner point you will close the polygon and it will be completely drawn respectively the line will be completed. If you want to create a curve (Bezier curves) determine the initial and two other points with mouse clicks to define the circumscribing rectangle. An arc is drawn after the third mouse click. You can then change the position of the end point of the arc by moving the mouse and can then end the process with a double click or add another arc with additional mouse clicks. Furthermore pay attention, to the status bar and the change from select and insert modes. Regard also the possibility of using placeholders and Master layouts. 'Insert' 'Rectangle' Symbol: With the command you can insert a rectangle as an element into your present visualization (see chapter 2.2). 'Insert' 'Rounded Rectangle' Symbol: With the command you can insert a rectangle with rounded corners as an element in your present visualization (see chapter 2.2). 'Insert' 'Ellipse' Symbol: With the command you can insert a circle or an ellipse as an element in your present visualization visualization (see chapter 2.2). 'Insert' 'Polygon' Symbol: With the command you can insert a polygon as an element in your present visualization (see chapter 2.2). 'Insert' 'Polyline' Symbol: With the command you can insert a line as an element into your current visualization (see chapter 2.2). 'Insert' 'Curve' Symbol: With the command you can insert a Bezier curve as an element into your current visualization (see chapter 2.2). 'Insert' 'Pie' Symbol: Use this command to insert a Pie Segment as an element into your current visualization.
CoDeSys Visualization
2-3
2 - The Visualization Editor in CoDeSys
While pressing the left mouse button, bring up an area in the desired size. An oval element including a line marking the radius at the 0° position will be displayed. As long as keeping the mouse button pressed you can immediately change size and position of the element by moving the mouse. A little black square is attended to the element, indicating the corner of a virtual rectangle surrounding the element. In order to define the start and end angles of a Pie, select the end point of the radius line on the circular arc by a mouse-click. As soon as you, keeping the mouse button pressed, move the cursor, two small rectangles will be displayed, indicating the two angle positions. As from now those can be selected and moved separately. If you want the angle values get defined dynamically by variables, open the configuration dialog category 'Angle' and enter the desired variable names. You can resize or reshape the element later by either clicking on the centre point, the cursor getting displayed as diagonally crossed arrows, and moving the mouse while keeping the mouse button pressed (or using the arrow keys). Alternatively you can select and move the corner indicating little square outside of the element. In order to move the element to another position, click inside the element to get the cursor being displayed as vertically crossed arrows and then move the cursor. 'Insert' 'Bitmap' Symbol: With the command you can insert a bitmap as an element in your present visualization. (Use, see Visualization Elements, Insert). While pressing the left mouse button, bring up an area in the desired size. The standard dialog box for browsing for a file will be opened. You can use this dialog to select and enter a bitmap file from the local file system. In the configuration dialog of the inserted bitmap you then can define, whether a link to the bitmap file should be stored or the bitmap should be inserted as an element. Alternatively you can specify a project variable to define which bitmap should be used. This allows a dynamic change of bitmaps in online mode. The variable must be entered in the configuration dialog of an already inserted bitmap element and it must contain the name of a bitmap file managed in the project-global bitmap list. For a description on the configuration of a bitmap element please see 2.4.1, category “Bitmap”. 'Insert' 'Visualization' Symbol: With the command you can insert an existing visualization as an element in your present visualization. (Use, see Visualization Elements, Insert). While pressing the left mouse button, bring up an area in the desired size. A selection list of existing visualizations opens. After you have selected the desired visualization, it will be inserted in the defined area. An inserted visualization will also be named as an instance. 'Insert' 'Button' Symbol: This command is used to insert a button into your current visualization. (Use, see Visualization Elements, Insert). Drag the element to the desired size with the left mouse button held down. If a toggle variable is configured for the button it displays the state of this variable by visually displaying whether it is pressed or not pressed. Conversely, the variable is toggled by „pressing" the button. Like for a "Bitmap“ element also for the filling of a button element an image file can be specified (static or dynamic use). See the description of the configuration dialog for category „Bitmap“(Kap.2.4.1).
2-4
CoDeSys Visualization
2 - The Visualization Editor in CoDeSys
'Insert' 'WMF file' Symbol: This command is used to insert a Windows Metafile. The standard dialog for opening a file will appear, where you can select a file (extension *.wmf). After having closed the dialog with OK the file will be inserted as an element in the visualization. Please regard, that no link to a file will be saved, like it is done when you insert a bitmap, but the elements of the metafile will be inserted as a group. 'Insert' 'Table' Symbol: Use this command to insert a Table element as an element into your current visualization. It is used to display the current values of the elements of an array. While pressing the left mouse button, bring up an area in the desired size. Before the element gets displayed the configuration dialog 'Configure table'' will be opened. Here you will find additionally to the standard categories Tooltip and Security the categories 'Table', 'Columns', 'Rows' and 'Selection' where you can define contents and appearance of the table. 'Insert' 'ActiveX-Element' Symbol: Use this command to insert an ActiveX Control into your current visualization. It can be used later on Windows32 systems in CoDeSys HMI and the CoDeSys Target-Visualization. While pressing the left mouse button, bring up an area in the desired size. It will be inserted as a rectangle with the inscription "Control:". To select a certain ActiveX-Control and to configure the method calls and the display open the dialog 'Configure ActiveX-Control' by a double-click on the element resp. via command 'Extras' 'Configure' (see Chapter 2.4.1, ActiveX-Element). 'Insert' 'Meter' Symbol: Use this command to insert a Meter as an element into your current visualization. It provides a scale which is defined as a sector of a circular arc, and a pointer element. While pressing the left mouse button, bring up an area in the desired size. Before the element gets displayed the configuration dialog Configure Meter will be opened. Here you can define various parameters concerning the display of the element and a preview is available to check the configuration before really inserting the element by confirming the dialog. 'Insert' 'Bar Display' Symbol: Use this command to insert a Bar Display element into your current visualization. It is used to visualize the value of the assigned variable by a bar indicating the value by its length along a horizontal scale. While pressing the left mouse button, bring up an area in the desired size. Before the element gets displayed the configuration dialog 'Configure bar display' will be opened. Here you can define various parameters concerning the display of the element and a preview is available to check the configuration before really inserting the element by confirming the dialog.
CoDeSys Visualization
2-5
2 - The Visualization Editor in CoDeSys
'Insert' 'Histogram' Symbol: Use this command to insert a Histogram element into your current visualization. It is used to visualize the elements of an array by bars which are placed side by side each indicating the value of the element by its length. While pressing the left mouse button, bring up an area in the desired size. Before the element gets displayed the configuration dialog 'Configure Histogram' will be opened. Here you can define various parameters concerning the display of the element and a preview is available to check the configuration before really inserting the element by confirming the dialog. 'Insert' 'Alarm table' Symbol: Use this command to insert an alarm table into your current visualization object. While pressing the left mouse button, bring up an area in the desired size. Before the element gets displayed the configuration dialog 'Configure Alarm table' will open. Here you will find additionally to the standard categories Tooltip and Security the categories 'Alarmtable', 'Settings for sorting', 'Columns' and Settings for alarmtable' where you can define contents and appearance of the table. An alarm table can be used to visualize the alarms, which have been defined in the Alarm configuration of the project. 'Insert' 'Trend' Symbol: Use this command to insert a trend element into your current visualization object.. While pressing the left mouse button, bring up an area in the desired size. The configuration (axes, variables, history) is done in the configuration dialog 'Trend'. The trend element, also named oscilloscope element, is used to display variable values within a certain time period. It stores the data in a file on the client and displays them as a graph. As soon as a value changes, a new entry will be made in the file, showing date/time and the new value. The trend element is drawn transparently. So you can assign any desired background (bitmap, color).
2.3
Positioning of Visualization Elements...
Selecting Visualization Elements The selection mode is activated by default. In order to select an element, click with the mouse on the element. You can also select the first element of the elements list by pressing the key and jump to the next by each further keystroke. If you press the key while pressing the key, you jump backwards in the order of the elements list. In order to select elements, which are placed one upon the other, first select the top level element by a mouse-click. Then do further mouse-clicks while the +-buttons are pressed, to reach the elements in the underlying levels . In order to mark multiple elements, press and hold the key and click the corresponding elements, one after another; or, while holding down the left mouse button, pull a window over the elements to be selected. In order to select all the elements, use the 'Extras' 'Select All' command. In the element list (called by 'Extras' 'Element list') you can select an element in the visualization by selecting the respective line.
2-6
CoDeSys Visualization
2 - The Visualization Editor in CoDeSys
Changing the Selection and Insert Mode After the insertion of a visualization element, there is an automatic change back into the selection mode. If you want to insert an additional element the same way, you can once again select the corresponding command in the menu or the symbol
in the tool bar.
You can also quickly change between the selection mode and the insert mode by pressing the key and the right mouse button simultaneously. In the insert mode, the corresponding symbol will also appear at the mouse pointer, and the name will also be indicated in black in the status bar. 'Extras' 'Select' This command is used to switch the selection mode on or off. This can also be achieved using the symbol
or by pressing the right mouse-key while holding down the key at the same time.
'Extras' 'Select All' This command allows you to select all visualization elements within the current visualization object. Copying Visual Elements One or more selected elements can be inserted with the 'Edit' 'Copy' command, the + key combination, or the corresponding copy symbol, and with 'Edit' 'Paste'. A further possibility is to select the elements and to again click in one of these elements with the key held down. If you now hold the left mouse button down, you can separate the elements thus copied from the original. Modifying Visualization Elements You can select an element which has already been inserted by a mouse click on the element or by pressing the key. A small black square will appear at each corner of each of the elements, (with ellipses at the corners of the surrounding rectangle). Except in the case of polygons, lines or curves further squares appear in the middle of the element edges between the corner points.
With a selected element, the turning point (balance point) is also displayed at the same time. You can then rotate the element around this point with a set motion/angle. The turning point is displayed as a small black circle with a white cross ( button.
). You can drag the turning point with a pressed left mouse
You can change the size of the element by clicking on one of the black squares and, while keeping the left mouse button pressed, controlling the new outline. With the selection of a polygon, you can drag each individual corner using the same technique. While doing this, if you press the -key then an additional corner point will be inserted at the corner point, an additional corner point will be inserted, which can be dragged by moving the mouse. By pressing the +-key, you can remove a corner point. Dragging Visualization Elements One or more selected elements can be dragged by pressing the left mouse button or the arrow key. Grouping Elements Elements can be grouped by selecting all desired elements and performing the command 'Extras' 'Group'. The group will behave like a single element:
CoDeSys Visualization
2-7
2 - The Visualization Editor in CoDeSys
• the grouped elements get a collective frame; when dragging the frame, depending on the current configuration all elements will be stretched, compressed or keep their original size; only the group can be moved to another position. • the grouped elements get collective properties: inputs only can effect the group and not a single element. Thus the elements also get one collective configuration dialog (category 'group'). The property 'Change color' can not be configured for a group! To redefine a single element of a group, the grouping must be redone by the command 'Extras' 'Ungroup'. The configuration of the group (see Chapter 2.4.1, Group) will be lost in this case. Note:
As soon as you save the project as CoDeSys Version 2.1 or lower, a group of visualization elements will be resolved automatically; that means that the elements of the group will be shown as single elements in the visualization.
'Extras' 'Send to Front' Use this command to bring selected visualization elements to the front. 'Extras' 'Send to Back' Use this command to send selected visualization elements to the back. 'Extras' 'Align' Use this command to align selected visualization elements. The following alignment options are available: • Left: the left edge of each of the elements will be aligned to the element that is furthest to the left • the same is true for Right / Top / Bottom • Horizontal Center: each of the elements will be aligned to the average horizontal center of all elements • Vertical Center: each of the elements will be aligned to the average vertical center of all elements 'Extras' 'Elementlist' This command opens a dialog box containing a list of all visualization elements including their number, type and position. The element number will be displayed in the element in the editor view, if the corresponding option is activated in the visualization Settings (see chapter 2.4.2). The position is given according to the x and y position of the upper left (x1, y1) and the lower right (x2, y2) corner of the element. When one or more items have been selected, the corresponding elements in the visualization are marked for visual control and if necessary the display will scroll to that section of the visualization that contains the elements. Use the To front button to bring selected visualization elements to the front. Use the To behind button to move them to the back. Below the elements list there you find – depending on which element is currently selected - one of the following combinations of edit fields where you can modify size and position of the element: • If a rectangle, rounded rectangle, ellipse, bitmap, visualization, button or a meta file is currently selected, then next to the text "Rectangle (x1, y1, x2, y2)" there are four edit fields, where the actual x/y positions are shown and can be modified. • If a line, polygon or a curve is currently selected, a table will be available showing the actual XPosition and Y-Position of each of the black squares which mark the shape of the element, as soon as it is selected. These values can be edited here.
2-8
CoDeSys Visualization
2 - The Visualization Editor in CoDeSys
Element list dialog box
To set the modified position values in the elements list and in the visualization, press button Set rectangle (in case 1.) resp. Set polygon (in case 2.). Use the Delete button to remove selected visualization elements. Use the Undo and Redo buttons to undo or restore changes that have been made just as you would do with the commands 'Edit' 'Undo' and 'Edit' 'Redo' . In the dialog box, you can observe the changes that are being made. Click on OK to close the dialog box and confirm the changes. Use Configure to get the configuration dialog for the element. Status Bar in the Visualization If a visualization has the focus, the current X and Y position of the mouse cursor in pixels relative to the upper left corner of the image is displayed in the status bar. If the mouse pointer is located on an Element, or if the element is being processed, then the number of the element will be displayed. If you have selected an element to insert, then this element will also appear (for example, Rectangle).
2.4
Visualization, Configure - Overview When configuring a visualization you have to distinguish between the configuration a particular graphic element and the visualization object as a whole. Correspondingly a different selection of configuration dialogs will be available, which can be opened by the command 'Configure' from Menu 'Extras' resp. from the context menu.
CoDeSys Visualization
2-9
2 - The Visualization Editor in CoDeSys
Placeholders At each location in the configuration dialog where variables or text are entered, a placeholder can be set in place of the respective variable or text. This makes sense if the visualization object is not to be used directly in the program, but is created to be inserted in other visualization objects as an "instance". When configuring such an Instance, the placeholders can be replaced with variable names or with text. See chapter 1 for the placeholder concept.
2.4.1
Visualization Elements, Configure... In the configuration dialogs opened via the 'Extras' 'Configure' command the properties of an element or object are set either by activating options or dynamically by inserting project variables. Besides that the properties can be programmed via the components of a structure variable, which can be defined for each visualization element. Regard the order of analysis, which will be followed in online mode: - The values which are given dynamically, i.e. via project variables, will overwrite the fix parameters defined for the same property. - If an element property is defined by a "normal" project variable as well as by the component of a structure variable, then in online mode primarily the value of the project variable will be regarded.
Please regard the possibility of using Placeholders as well as the special input possibilities which are useful if the visualization should be used in CoDeSys HMI resp. as Target or Web-visualization, that means if the visualization serves as the only user interface for a PLC program (see also: INTERN in category 'Input' of the configuration dialogs, Keyboard usage) Attention: Dialogs which include the configuration of Colors and Fonts for a visualization element, can look differently depending on the currently selected target system. Possibly instead of the standard dialog there is a dialog with restricted options. This might be reasonable for projects, which are designated for a use in Target-Visualizations. See also below: ‘Colors’ resp. ‘Text’.
'Extras' 'Configure' With this command, the 'Configure element' dialog opens for configuring the selected visualization element (see Select visualization element). You are given the dialog box when you double-click on the element. Select a category in the left area of the dialog box (available categories depending on element type) and fill out the requested information in the right area. This has to be done by activating options resp. by inserting the name of valid variables, whose values should define the property of the element. Note: Note:
There are also configuration dialogs available for a group of elements. Regard that the settings will be valid for the "element" group. If you want to configure the particular elements of the group, you have to resolve the group. If you have defined an element property by a "static" setting as well as dynamically by a variable, then in online mode the variable will overwrite the static value (Example: "Alarm color Inside" can be defined statically in category 'Color' and additionally dynamically in category 'Colorvariables' by a variable). If the setting is controlled by a "normal" project variable as well as by a structure variable, then the value of structure variable also will be overwritten by the "normal" project variable.
Please regard: Meter, Bar Display and Histogram must be re-grouped before !
At locations in the element configuration where variables are operative, the following Entries are possible: • Variable names, for which input assistant is available • Expressions which are assembled from component accesses, field accesses with constant index, variables and direct addresses. • Operators and constants, which can be combined at will with the aforementioned expressions.
2-10
CoDeSys Visualization
2 - The Visualization Editor in CoDeSys
• Placeholders instead of variable names or text strings Examples of permissible expressions:
x+y 100*PLC_PRG.a TRUE NOT PLC_PRG.b 9*sin(x + 100)+cos(y+100) Function calls are not possible. Invalid expressions result in an error message on login („Invalid Watch expression..."). Examples of invalid expressions: fun(88), a := 9, RETURN. There are two possible ways in the configuration dialogs to write global variables: „.globvar" and „globvar" are equivalent. The style with a dot (which is that used in the Watch- and Receipt Manager) is not allowed within an assembled expression, however. Regard also the possibility of using Placeholders (Chapter 2.4.1). Angle In the configuration dialog 'Configure Pie' in the Angle category you can each enter a value or a variable defining the start angle and the end angle of the sector element in degrees. The sector will be drawn clockwise from the start angle position to the end angle position. Example: Enter start angle: "90", end angle: "180"
Dialog for Configuring a Pie
Shape In the visualization element configuration dialog box, you can select in the Shape category from among Rectangle, Rounded Rectangle, Line and Ellipse respectively Polygon, Line and Curve. The form will change into the size already set.
CoDeSys Visualization
2-11
2 - The Visualization Editor in CoDeSys
Dialog Box for Configuring Visualization Elements (Shape Category)
Text In the dialog for configuring visualization elements, you can specify a text for the element in the Text category. This can be entered directly or/and a variable can be defined which will determine the text string. The usage of placeholders is possible. Also the default settings for font and alignment are done here. Note:
As soon as text parameters are additionally provided dynamically, which means by a system or structure variable (see also below, category 'Text variables' resp. 'Programmability'), the static definitions which are done in the currently opened dialog , will be overwritten ! In case of multiple definition of an element property consider the specific order of precedence concerning according to which a value might be overwritten in online mode by another (see Chapter 2.4.1).
Enter the text in the Content field. With the key combination + you can insert line breaks, with +, tab stops. Besides the input of a pure text string you can use the following formatting sequences (via button
the corresponding online help page can be opened):
• If you include "%s "into the text, then this location, in Online mode, will be replaced by the value of the variable from the Text Output field of the Variables category. You also can use a formatting string, which conforms with the standard C-library function 'sprintf': Character
Argument / Output as
d,i
Decimal number
o
Unsigned octal number (without leading zero)
x
Unsigned hexadecimal number (without leading 0x)
u
Unsigned decimal number
c
Single character
s
String
f
REAL-values [-]m.; plus- resp. minus-sign defines right (default) resp. left alignment; m defines minimal number of places to be displayed; accuracy defines the number of places behind the comma (default: 6).
Attention: (1) If you want to get displayed a percent sign % combined with one of the formatting strings mentioned above, you must enter "%%". For example: Enter "Rate in %%: %s" to get displayed in online mode "Rate in %: 12" (if the text display variable currently is "12"). (2) Be careful with letter case: capital letters, i.e. %S instead of %s not acceptable."
2-12
CoDeSys Visualization
2 - The Visualization Editor in CoDeSys
The value of the variable will be displayed correspondingly in online mode. You can enter any IEC-conforming format strings, which fit to the type of the used variable. Attention: It is not checked whether the type which is used in the formatting string matches with the type of the variable which is defined in the 'Text Output' field! Example: Input in the 'Content' field:
Fill level %2.5f mm
Input of a REAL variable in the 'Text Output' field, e.g.:
fvar1
Î Output in online mode e.g.: Fill level 32.8999 mm
• If you enter "%t ", followed by a certain sequence of special placeholders, then this location will be replaced in Online mode by the system time. The placeholders define the display format, see the following table. Attention: Do not insert any other characters before %t in the 'Content' field (in contrast this is allowed for e.g. "%s", see above) %a
Abbreviated weekday name
%A
Full weekday name
%b
Abbreviated month name
%B
Full month name
%c
Date and time representation appropriate for locale
%d
Day of month as decimal number (01 – 31)
%H
Hour in 24-hour format (00 – 23)
%I
Hour in 12-hour format (01 – 12)
%j
Day of year as decimal number (001 – 366)
%m
Month as decimal number (01 – 12)
%M
Minute as decimal number (00 – 59)
%p
Current locale’s A.M./P.M. indicator for 12-hour clock
%S
Second as decimal number (00 – 59)
%U
Week of year as decimal number, with Sunday as first day of week (00 – 53)
%w
Weekday as decimal number (0 – 6; Sunday is 0)
%W
Week of year as decimal number, with Monday as first day of week (00 – 53)
%x
Date representation for current locale
%X
Time representation for current locale
%y
Year without century, as decimal number (00 – 99)
%Y
Year with century, as decimal number
%z, %Z
Time-zone name or abbreviation; no characters if time zone is unknown
%%
Percent sign
Examples: %t%a %b %d.%m.%y %H:%M:%S -> Display in online mode: Wed Aug 28.08.02 16:32:45
CoDeSys Visualization
2-13
2 - The Visualization Editor in CoDeSys
Between the placeholders you can insert any text strings: %Today is %d.%m.%y -> Display in online mode: Today is 28.08.02 Note:
If a text string is to be transferred into a translation file, which will then be used in Online mode to enable switching into another national language, it must be delimited at the beginning and end by #. Examples: "#Pump 1#" or else even "#Pump# 1" The second case might for example, in the event of multiple occurrences of the text Pump (Pump 1, Pump 2, etc.), prevent multiple appearances in the translation.
• If you include" %" into the text, you can enter instead of "PREFIX" a certain string, which will serve as an identifier concerning the use of dynamic texts. The prefix will be used together with an ID number, which is to be defined in the 'Variables' category of the configuration dialog in field 'Textdisplay'. The combination references to a certain text, which is defined in a xml-file available for this purpose and listing all possible dynamic texts (see chapter 3.2.2). Thus at run time the text which is indicated by the current ID-Prefix-combination will be displayed. For further information see also the description of 'Settings', category Language (chapter 2.4.2) resp. of the Language switching in a visualization (chapter 3). See there also information on the usage of UnicodeFormat. The configured text will appear online in the prescribed alignment within the element: horizontally left, center or right and vertically top, center or bottom. Via button Font the dialog for font selection will appear. Choose the desired font and confirm with OK. (The list of offered fonts depends on the target system, see note in chapter 2.4.1) The Standard-Font button can be used to assign the currently valid standard font to the element. That is defined in the visualization settings in category ‘Display’ (see chapter 2.4.2). Dialog Box for Configuring Visualization Elements (Text Category)
Textvariables In category Textvariables of the dialog for configuring visualization elements you can specify a variable which should dynamically set color and font of that string which is defined in category 'Text'. At best enter the variable name with the aid of the input assistant (). You can also use components of the structure VisualObjectType to set the text properties. For this see the description of category 'Programability'; there you will find the possible values of the particular structure components and their effect.
2-14
CoDeSys Visualization
2 - The Visualization Editor in CoDeSys
Note:
If there are corresponding static definitions in category 'Text', these will be overwritten by the dynamic parameter values.
In case of multiple definition of an element property consider the specific order of precedence concerning according to which a value might be overwritten in online mode by another. The parameters of the dialog: Parameter:
Meaning:
Example entry of project variable:
Example Usage of variable in program:
corresponding component of structure VisualObjectType:
Textcolor:
Text color
"plc_prg.var_textcolor" var_textcolor=16#FF00FF → Farbe
dwTextColor
Textflags:
Alignment (right, left, centered...)
"plc_prg.textpos"
textpos:=2 → Text right justified
dwTextFlags
Fontheight:
Font height in Pixel
".fonth"
fonth:=16; → Font height 16 pt
ntFontHeight
Fontname:
Font name
"vis1.fontn"
fontn:=arial; → Arial is used
stFontName
Fontflags:
Font display (bold, "plc_prg.fontchar" underlined, italic...)
fontchar:=2 → Text will be displayed bold
dwFontFlags
Dialog for configuring visualization elements (category Textvariables)
Line width In the dialog for configuring visualization elements, you can choose the line width for an element. As predefined options you find width settings from 1 to 5 pixel, additionally an other value can be entered manually (Other:), or a project variable (Variable for line width:) can be inserted. For the latter the input assistance (() can be used. Note:
As soon as the parameter is additionally defined dynamically, i.e. by a structure variable (see below, category 'Programability'), the static setting will be overwritten in online mode.
CoDeSys Visualization
2-15
2 - The Visualization Editor in CoDeSys
Dialog Box for Configuring Visualization Elements (Line width category)
Colors In the visualization element configuration dialog box, in the Color category you can select primary colors and alarm colors for the inside area and for the frame of your element. Choosing the options no color inside and no frame color you can create transparent elements. Note:
As soon as the parameter is additionally defined dynamically by a variable, the static setting will be overwritten in online mode.
In case of multiple definition of an element property consider the specific order of precedence concerning according to which a value might be overwritten in online mode by another. Dialog Box for Configuring Visualization Elements (Color Category)
If you now enter a Boolean variable in the Variables category in the Change Color field, then the element will be displayed in the Color set, as long as the variable is FALSE. If the variable is TRUE, then the element will be displayed in its Alarm Color. Note:
2-16
The change color function only becomes active, if the PLC is in Online Mode!
CoDeSys Visualization
2 - The Visualization Editor in CoDeSys
If you want to change the color of the frame, then press the Frame button, instead of the Inside button. In either case, the dialog box will open for selection of the color. Here can to choose the desired hue from the primary colors and the user-defined colors. By pressing the Define Colors you can change the user-defined colors. Depending on the target the dialog might offer only a restricted selection of colors. This can be reasonable for creating projects which are intended for Target-Visualizations. In this case the colors are defined via selection lists. Example of a target specific dialog with restricted color options
Color Variables Here you can enter project variables (e.g. PLC_PRG.color_inside), which should determine the particular property in online mode: These property definitions also or additionally can be programmed with the aid of components of the structure VisualObjectType. Therefore see the description on the "Programability" of a visualization element. There you will find a list of the possible values and their effects. Note:
The variables, entered in the Color Variables dialog, in online mode will overwrite the static values given in the 'Color' category as well as corresponding values given by a structure variable.
In case of multiple definition of an element property consider the specific order of precedence concerning according to which a value might be overwritten in online mode by another. The parameters of the dialog: Parameter:
Description:
Example of an entry:
Example for using the variable in the program:
corresponding component of structure VisualObjectType:
Fillcolor:
fill color
"plc_prg.var_fillcol"
var_var_fillcol:=16#FF00FF → fill color pink
dwFillColor
Fillcolor alarm:
fill color if the
"plc_prg.var_fillcol_a"
var_fillcol_a:=16#FF00FF → alarm fill color pink
dwFillColorAlarm
Framecolor:
frame color
"plc_prg.var_framecol"
var_framecol::=16#FF00FF → frame color pink
dwFrameColor
CoDeSys Visualization
'Change color' variable is TRUE
2-17
2 - The Visualization Editor in CoDeSys
Framecolor alarm:
"plc_prg.var_framecol" frame color if the 'Change color' variable is TRUE
var_framecol:=16#FF00FF dwFrameColorAlar → alarm frame color farbe pink m
Fillflags:
The current "plc_prg.var_col_off" inside color configuration can be activated (FALSE) resp. deactivated (TRUE)
var_col_off:=1 dwFillFlags → the color definition for the fill color will not be regarded, that for the frame remains valid
Frameflags:
Display of the frame (solid, dotted etc.)
var_linetype:=2; → frame will be displayed as dotted line
"plc_prg.var_linetype"
dwFrameFlags
Dialog Box for Configuring Visualization Elements (Category Colorvariables)
Motion absolute In the visualization element configuration dialog box, in the Motion absolute category, X- or Y-Offset fields variables can be entered. These variables can shift the element in the X or the Y direction, depending on the respective variable value. A variable in the Scale field will change the size of the element linear to its current value. This value, which is used as scaling factor, will be divided by 1000 implicitely, so that it is not necessary to use REAL-variables in order to get a reduction of the element. The scaling always will refer to the balance point. A variable in the Angle field causes the element to turn on its turning point, depending on the value of the variable. (Positive Value = Mathematic Positive = Clockwise). The value is evaluated in degrees. With polygons, every point rotates; in other words, the polygon turns. With all other elements, the element rotates, in such a way, that the upper edge always remains on top. The turning point appears after a single click on the element, and is displayed as a small black circle with a white cross ( Note:
). You can drag the turning point with a pressed left mouse button.
In online mode the variables which are set in the 'Motion absolute' dialog will override the values of structure components which additionally might be used to define the same property ('Programability').
In case of multiple definition of an element property consider the specific order of precedence concerning according to which a value might be overwritten in online mode by another.
2-18
CoDeSys Visualization
2 - The Visualization Editor in CoDeSys
Visualization Element Configuration Dialog Box (Motion Absolute Category)
Motion relative In the dialog for configuring visualization elements in the Motion Relative category, you can assign variables to the individual element edges. Depending on the values of the variables, the corresponding element edges are then moved. The easiest way to enter variables into the fields is to use the Input Assistant (). The four entries indicate the four sides of your element. The base position of the corners is always at zero. A new value in the variables, in the corresponding column, shifts the boundary in pixels around this value. Therefore, the variables that are entered ought to be INT variables. Note:
Positive values shift the horizontal edges downward, or, the vertical edges, to the right!
Note:
In online mode the variables which are set in the 'Motion absolute' dialog will override the values of structure components which additionally might be used to define the same property ('Programmability').
In case of multiple definition of an element property consider the specific order of precedence concerning according to which a value might be overwritten in online mode by another. Dialog Box for Configuration of Visualization Elements (Motion Relative Category)
CoDeSys Visualization
2-19
2 - The Visualization Editor in CoDeSys
Variables Visualization Element Configuration Dialog Box (Variables Category)
You can enter the variables that describe the status of the visualization elements in the Variable category within the dialog box for configuring visualization elements. The simplest way to enter variables in the fields is to use the Input Assistant. Note:
In online mode the variables which are set in the 'Motion absolute' dialog will override the values of structure components which additionally might be used to define the same property ('Programability'). In case of multiple definition of an element property consider the specific order of precedence concerning according to which a value might be overwritten in online mode by another.
You can enter Boolean variables in the Invisible and Change color fields. The values in the fields determine their actions. If the variable of the Invisible field contains the value FALSE, the visualization element will be visible. If the variable contains the value TRUE, the element will be invisible. Disable input: If the variable entered here is TRUE, all settings of category 'Input' will be ignored. Change color: If the variable which is defined in this field, has the value FALSE, the visualization element will be displayed in its default color. If the variable is TRUE, the element will be displayed in its alarm color. Textdisplay: • If you have inserted a "%s" in the Content field of the Text category or if you have included "%s" in the textstring, then the value of the variable which is defined in 'Textdisplay' will be displayed in online mode in the visualization object. "%s" will be replaced by the value. • If you have inserted resp. included a "%" in the Content field of the Text category ("PREFIX" must be a sequence of letters), then the variable resp. the numeric value which is entered here in 'Textdisplay' will be interpreted as an ID, which in combination with the prefix serves as a reference on a text, which is described in a XML-file. This text will be displayed in online mode instead of "%" in the visualization object. Thus a dynamic modification of the text display is possible. See further information in the description of the dialog 'Settings', category Language (chapter 2.4.2) resp. of the Language switching in a visualization (chapter 3) • If you want to edit the value of the variable in Online mode using the keyboard, you can do this via the 'Text input of variable' 'Textdisplay' in the Input category. Tooltip-display: Enter here a variable of type STRING whose value should be displayed in a tooltip for the element in online mode.
2-20
CoDeSys Visualization
2 - The Visualization Editor in CoDeSys
Input Dialog for configuring the visualization elements (Category Input)
Toggle variable: If this option is activated, in online mode you will toggle the value of the variables which are located in the input field by each mouse click on the visualization element. You can obtain input assistance for data entry via . The value of the Boolean variable changes with each mouse click from TRUE to FALSE and then back to TRUE again at the next mouse click, etc. Tap Variable: If this option is activated, in online mode you can switch the value of the Boolean variable which is located in the input field, between TRUE and FALSE. Place the mouse cursor on the element, press the mouse-key and hold it depressed. If option Tap FALSE is activated, the value is set to FALSE as soon as the mouse key is pressed, otherwise it is set to TRUE at this moment. The variable changes back to its initial value as soon as you release the mouse key. Zoom to Vis...: If this option is activated, you can enter in the edit field the name of a visualization object of the same project to which you want to jump by a mouse-click on the element in online mode. In this case always first the window of the target visualization will be opened before that of the current one will be closed. The following entries are allowed: • The name of a visualization object of the current project (see Object Organizer) • If a visualization instance that contains placeholders is to be jumped to, the placeholders can be directly replaced by variable names or text when called up. For this purpose, conform to the following syntax: (:=, :=,..., :=). During compilation of the visualization it will be checked, whether the text matches with one of the defined replacement values defined in the placeholder list, if it does not, a warning will be output. Example: Calling the visualization visu1, whereby the placeholders $var_ref1$ and $var_ref2$ used in visu1 are replaced by the variables PLC_PRG.var1 and PROG.var1 respectively: visu1(var_ref1:=PLC_PRG.var1, var_ref2:=PROG.var1)
• If a program variable of the type STRING (e.g. PLC_PRG.xxx) has been entered instead of a visualization object, then this variable can be used to define the name of the visualization object (e.g. ,visu1') which the system should change to when a mouse click occurs (e.g. xxx:= ,visu1). • If you issue the command „ZOOMTOCALLER" in the Zoom to vis. field, a backward jump into the calling visualization is achieved in Online mode by a mouse click on the element, if such a constellation was configured.
CoDeSys Visualization
2-21
2 - The Visualization Editor in CoDeSys
Note:
The implicit variable CurrentVisu (type STRING, for implicit (system) variables see 10) describes the name of the currently opened visualization object. For example it can be used in the application to control which visualization should be opened resp. to see which is the currently opened. Regard that for compiler versions < V2.3.0.7, and if the library SysLibStr.lib is not included in the project, this will only work if the names of the visualization objects are specified in captal letters (see chapter 2.1). Example: CurrentVisu:='PLC_VISU';
Execute program: If this option is activated you can enter ASSIGN- or special "INTERN"-commands in the input field, which will be executed in online mode as soon as you perform a mouse-click on the element. Press button "..." to get the dialog Configure programs where you can select the desired commands (Add) and arrange them in the desired order (Before, After). For example there is a command for language switching in a visualization. See further below chapter 'Special input possibilities for operating versions'. Note:
This feature especially is important if the visualization will be the only operating interface of a system (pure operating version).
Text input of variable 'Textdisplay': If this option is activated, in online mode you can enter text in an edit field in this visualization element. This value upon pressing will be written to the variable that appears in the Textdisplay field of the 'Variables' category. Select in the scroll box which kind of input should be possible later in online mode. If option Hidden is activated, the text will be replaced by asterisks ("***") in the online display of the visualization element. Text: An edit field will open, where you can enter the value. Numpad resp. Keypad: A window will open showing an image of the numeric resp. alphabetic keypad, where you can enter a value by activating the appropriate key elements. This might be useful if the visualization must be operatable via a touch screen. The range of valid input values can be restricted by defining a minimum and a maximum value in the edit fields Min: and Max:. Note:
In case of using Target-Visualization regard the possibility to get information on user inputs via mouse-clicks by special interface functions and to use that directly in the project. (see chapter 9)
ToolTip The dialog Text for Tooltip offers an input field for text which appears in a text field as soon as the mouse cursor is passed over the object in online mode. The text can be formatted with line breaks by using the key combination + . Security It might be useful that different user groups get different operating possibilities and display of a visualization. This can be reached by assigning different access rights concerning particular visualization elements. You can do this for the eight user groups which are available in CoDeSys (see also 'Project' 'Object' 'Properties' resp. 'Project' 'User Group Passwords'). The access rights can be assigned by activating the appropriate option in the configuration dialog 'Access rights' for a visualization element: The access rights for a visualization element and their effect in online mode:
2-22
No Access
Element will not be visible
Read Access
Element will be visible but not operable (no inputs allowed)
Full Access
Element is not visible and not operable
CoDeSys Visualization
2 - The Visualization Editor in CoDeSys
Visualization Element Configuration Dialog Box (Category Security)
If you want to assign the access rights also to all other elements of the visualization object, activate option Apply to all visual elements. Note:
Please regard, that the access rights which are set for the visualization object in the 'Project' 'Object' 'Properties' dialog, are independent on those of the particular visualization elements !
Programability The properties of a visualization element can not only be defined by a static setting or by a "normal" project variable, but also by the components of a structure variable, which is exclusively used for programming visualization elements. For this purpose the structure VisualObjectType is available in the library SysLibVisu.lib. Its components can be used to define most of the element properties. Note:
In case of multiple definition of a element property the value of the "normal" project variables will overwrite that of the structure variable and both will overwrite a static definition.
In order to configure the element properties by using a structure variable, do the following: Open the configuration dialog, category 'Programmability' and enter a new, unique (!) variable name in the field Object Name:. For this purpose you must activate the option by a mouse-click in the checkbox. The variable automatically will be declared with type VisualObjectType, a structure which is contained in the library SysLibVisu.Lib. The declaration is done implicitly and not visible for the user. Make sure that the library is included in the library manager. After the next compile the newly assigned structure variable will be available in the project. (Hint: Activate the Intellisense functionality 'List components' in the project options, category Editor, in order to get the structure components in a selection list as soon as the variable name followed by a dot is entered). Example: If you have defined a Object Name "visu1_line" for a visualization element, then you can program the line width of this element by e.g. "visu1_line.nLIneWidth:=4".
CoDeSys Visualization
2-23
2 - The Visualization Editor in CoDeSys
Dialog for configuring a visualization element (Category Programmability)
The structure VisualObjectType: The following table will show you all components of the structure and references to the corresponding items in the different categories of the configuration dialog: At the beginning of the component name the data type is integrated: n INT, dw DWORD, b BOOL, st STRING
2-24
Component (+Data type)
Effect
Example
nXOffset : INT;
Shift element in Xdirection
vis1.nXOffset:=val2; (element is set to position X=val2)
- Cat. Motion absolute: X-Offset
nYOffset : INT;
Shift element in Ydirection
vis1.nYOffset:=22; (element is set to position Y=val2)
- Cat. Motion absolute: Y-Offset
nScale : INT;
Change of the size
vis1.nScale:=plc_prg.scale_var; - Cat. Motion (element size changes linear with change absolute: Scaling of value of plc_prg.scale_var)
nAngle : INT;
Rotating element around its center
vis1.anglevar:=15; (element rotates clockwise by 15 )
- Cat. Motion absolute: angle
bInvisible : BOOL;
Element is visible / invisible
vis1.visible:=TRUE; (element is invisible)
- Cat. Color: No color inside + No frame color - Cat.Colorvariables: Fillcolor + Framecolor
stTextDisplay : STRING;
Text is displayed in element
vis1.TextDisplay:='ON / OFF';
- Cat. Text: entry at Content'
(the Object Name "vis1" has been defined for the element)
element is inscribed with this text
corresponding entries in configuration dialog:
bToggleColor : BOOL; color change when toggling between TRUE and FALSE
vis1.bToggleColor:=alarm_var; - Cat. Input: Toggle (As soon as alarm_var gets TRUE, the variable + element gets the color defined via the - Cat. Variables: components dwFillColorAlarm, change color dwFrameColorAlarm resp. via the settings in category 'Colorvariables' or 'Color'.
bInputDisabled: BOOL;
vis1.bInputDisabled:=FALSE; (no input is possible for this elementt)
if FALSE: Inputs in category 'Input' are ignored
- Cat. Variables: Disable Input'
CoDeSys Visualization
2 - The Visualization Editor in CoDeSys
Component (+Data type)
Effect
Example
stTooltipDisplay: STRING;
Text of the tooltip
dwTextFlags: DWORD;
vis1.dwTextFlags:=24; Text position: (Text will be placed in the center of the 1 left justified element (4 + 20) 2 right justified: 4 centered horizont. 8 top 10 bottom 20 centered vertically Note: Always set a horizontal and a vertical position (addition of values)!
dwTextColor : DWORD;
Text color (definition of colors see subsequent to this table)
nFontHeight : INT;
vis1.nFontHeight:=16; Font height in Pixel. should be in range 10- (Text height is 16 pt) 96
- Cat. Text: Font | Grad' - Cat. Textvariables: Font heigth
dwFontFlags : DWORD;
Font display. Available vis1.dwFontFlags:=10; (Text is displayed blue and cancelled) flags: 1 italic 2 bold 4 underlined 8 cancelled + combinations by adding values
- Cat. Text: Schrift | Schriftschnitt - Cat. Textvariables: Fontflags
(the Object Name "vis1" has been defined for the element)
vis1.stTooltipDisplay:='Switch for .....';
vis1.dwTextColor := 16#00FF0000; (Text is blue-colored)
corresponding entries in configuration dialog:
- Cat. Text for Tooltip: 'Entry in Content:' - Cat. Text: Horizontal and Vertical options - Cat. Textvariables: Textflags
- Cat. Text: Font | Color - Cat. Textvariables: Textcolor
stFontName : STRING; Change font
vis1.stFontName:=’Arial’; (Arial is used)
- Cat. Text: Schrift | Schriftart - Cat. Textvariables: Fontname
nLineWidth : INT;
vis1.nLWidth:=3; (Frame width is 3 Pixels)
- Cat. Line width
Line width of the frame (pixels)
dwFillColor : DWORD; Fill color (definition of vis1.dwFillColor":=16#00FF0000; - Cat. Color: Color | colors see subsequent (Element ist im "Normalzustand" blau) Inside to this table) - Cat. Colorvariables: Inside dwFillColorAlarm : DWORD;
Fill color as soon as bToggleColor gets TRUE, see above) (definition of colors see subsequent to this table)
dwFrameColor: DWORD;
Frame color vis1.dwFrameColor:=16#00FF0000; (Frame is blue-colored) (definition of colors see subsequent to this table)
dwFrameColorAlarm: DWORD;
Fill color as soon as bFrameColor gets TRUE, see above (definition of colors
CoDeSys Visualization
vis1.dwFillColorAlarm:=16#00808 - Cat. Color: Alarm 080; color | Inside (as soon as Variable togglevar gets - Cat. Colorvariables: TRUE, the element will be displayed greyInside Alarm colored) - Cat. Color: Color | Frame - Cat. Colorvariables: Frame
vis1.dwFrameColorAlarm:=16#0080 - Cat. Color: Alarm color | Frame 8080; (as soon as Variable vis1.bToggleColor gets TRUE, the frame - Cat. Colorvariables: Frame Alarm will be displayed grey-colored)
2-25
2 - The Visualization Editor in CoDeSys
Component (+Data type)
Effect
Example
corresponding entries in configuration dialog:
(the Object Name "vis1" has been defined for the element)
see subsequent to this table) dwFillFlags: DWORD;
Color, as defined by the color variables, can be displayed or ignored 0 = show color >0 = ignore setting
vis1.dwFillFlags:=1; (element gets invisible)
- Cat. Color: No color inside + No frame color - Cat. Colorvariables: Fillflags
dwFrameFlags: DWORD;
Display of frame: 0 full 1 dashed ( --- ) 2 dotted ( ) 3 dash-point ( _._._ ) 4 dash-point-point (_.._.. ) 8 blind out line
vis1.FrameFlags:=1; (Frame will be displayed as dashed line)
- Cat. Colorvariables: Frameflags
Defining color values: Example: e1.dwFillColor := 16#00FF00FF; A color is entered as a hex number which is composed of the Blue/Green/Red (RGB) components. The first two zeros after "16#" should be set to in each case, to fill the DWORD size. For each color value 256 (0-255) colors are available. FF Blue component 00 Green component FF Red component Example for a blinking visualization element: Define a global variable 'blink1' of type VisualObjectType in the configuration of a rectangle. In a program of function block the value of a component of the structure can be modified. PROGRAM PLC_PRG VAR n:INT:=0; bMod:BOOL:=TRUE; END_VAR (* Blinking element *) n:=n+1; bMod:= (n MOD 20) > 10; IF bMod THEN blinker.nFillColor := 16#00808080; ELSE blinker.nFillColor := 16#00FF0000; END_IF
2-26
(* Grau *) (* Blau *)
CoDeSys Visualization
2 - The Visualization Editor in CoDeSys
Table As soon as a table is inserted for the purpose of visualization of an array, the dialog Configure Table will be opened. Besides the categories 'Tooltip' and 'Security' which are also available for other visualization elements, the following categories will be available for configuring display and contents of the table: Regard that the options in the color and font selection dialogs might deviate from the default depending on the current target (see note in chapter 2.4.1). Category Table: Dialog for the configuration of a Table, Category Table
Do the following table settings: Data array: Insert the name of an array which should be visualized in the table. It is recommended to use the input assistant () resp. the Intellisense function. Slider size: Insert here the desired height of the slider which will appear at the bottom of the table element if the display of the array columns exceeds the element width. Column header, Line header: Activate these options if you want to get displayed the titles in the table. The line title reflects the array index (first column of the table), the column title can be defined in category 'Columns'. Category Columns: Here you define the table elements. In the left window you get al list of all elements, which are handled in the array per index. In case of an array of a structure these would be the structure components. Dialog for the configuration of a Table, Category Columns
CoDeSys Visualization
2-27
2 - The Visualization Editor in CoDeSys
Using the arrow button > you can transfer a selected component from the left window to the right window where you define the set of elements to be displayed in the table. Pressing button >> all elements will be transferred at a single blow. In the same manner you can remove elements from an already defined set (“ will be displayed. If multiple XML-files are used, thus providing multiple headers, only that header section will be regarded, which is read at last. So it is reasonable to use only one header section! The language token must correspond to one of those used in the text entries (see below). Note: In online mode the default language can be set explicitly via a visualization element configured with command INTERN LANGUAGE DEFAULT in category Input, Execute program (see chapter 2.4.1, Special
3-5
3 - Language switching in the Visualization
input possibilities for operating versions).
Default font for : The given font (e.g. "Arial" will automatically be used for all elements, which display dynamic texts in . The language token must correspond to one of those used in the text entries (see below). For the preconditions for the usage of unicode-able fonts please see the introductory of chapter 3.
further default fonts for other languages
...... ....
The list of assignments Prefix-ID-text starts with and ends with . The particular text entries each start with and end with . A text entry which is assigned to a Prefix-ID-combination must contain the following lines: = " id=""
"PREFIX" corresponds to the used in the visualization element configuration (category ‘Text’ or ‘Tooltip’); In case of a message text to be displayed in an alarm table the path of the respective alarm group in the alarm configuration as from the “System” node must be specified, e.g. “System/Alarmgroup_1”. "ID" for normal texts or tooltip texts corresponds to the entry in category 'Variables', Textdisplay or Tooltipdisplay; in case of an of an message text used in an alarm table the number of the line which defines that text in the configuration dialog of the alarm group must be specified. (See the CoDeSYs V2.3 User Manual for CoDeSys for a description on the Alarm Configuration)
]]
Use any string as a 'language' identifier (e.g. "english"). This identifier then will be displayed in the 'Settings' dialog, category Language of the visualization element in the selection list at 'Language'; instead of "TEXT" insert any text which then will be displayed instead of the above defined ID-prefix-combination in the visualization element.
For each prefix-ID-combination at least for one language a text entry must be available. E.g. see in the file example shown below: indicates the start of the german version of a text, terminates the text. Dynamic texts on the one hand can serve to display texts in different languages, but of course on the other hand they also can be used to change the content of a text (same language) display dynamically. Example for the use of an language xml-file: You want to have two visualization elements, one for visualizing the current machine identification, the other for visualizing an error message according to a currently given error number:
3-6
CoDeSys Visualization
3 - Language switching in the Visualization
(1) Define in PLC_PRG the following variables: ivar of type INT, defining the current machine identification; errnum of type INT defining the current error number. (2) Configure a visualization element for displaying the current machine identification: a.
Enter in category ‚Text’ in the text field: "%"
b.
Enter in category ‚Variables’ at Textdisplay“: „PLC_PRG.ivar”
(3) Configure another visualization element for displaying the error message for the currently occurred error: a.
Enter in category ‚Text’ in the text field: "%"
b.
Enter in category ‚Variables’ at Textdisplay“: "PLC_PRG.errnum“
(4) Create a xml-file, e.g. with name dynamictextsample.xml, according to the syntax described above, which should look as follows for the current example:
deutsch deutsch Arial 0,0,0 -13 700 false false false 0 english Arial 0,0,0 -13 700 false false false 0 Fehler an Position 4711 Error at position 4711 Fehler an Position 815 Error at position 815
CoDeSys Visualization
3-7
3 - Language switching in the Visualization
(5) In the visualization open dialog ‚Settings’, category Language: Activate option ‚Dynamic Texts’; Add file dynamictextsample.xml, now available on your computer, to the file list. (6) Go online with the project. (7) In the visualization settings set language to "deutsch". Set PLC_PRG.ivar to "1" and PLC_PRG.errnum to "4711". Now in the visualization elements the following texts should be displayed: "Vorschub" resp. "Fehler an Position 4711". The texts will be displayed in Arial 13. (8) Set PLC_PRG.ivar to „2“ and PLC_PRG.errnum to "2000". The texts will change to "Beschleunigung" and "Das ist ein Fehlertext über mehrere Zeilen“. (9) In the visualization settings change the language to "english". Now the following texts will be displayed: "Acceleration" and "This is an error text over more than one line".
(The change of language also could be managed by using the INTERN command 'LANGUAGE' by another visualization element.)
3.3
Calling up language-dependent Online Help via a visualization element The calling of a different Help file with a visualization element can be tied in with the language currently entered for the visualization. For this purpose, the command INTERN HELP must be entered for this element in the configuration dialog in category ‘Input’ at the location 'Execute program', and a [Visu-Helpfiles] section must be present in the CoDeSys .ini-file. Below this, the corresponding help files must be assigned to the languages available for selection in the visualization: e.g.: [Visu-Helpfiles] German=C:\PROGRAMME\HELP\.chm English=C:\PROGRAMME\HELP\.chm
3-8
CoDeSys Visualization
4 - Placeholder Concept
4
Placeholder Concept At each location in the configuration dialog where variables or text are entered, a placeholder can be set in place of the respective variable or text. This makes sense if the visualization object is not to be used directly in the program, but is created to be inserted in other visualization objects as an "instance". When configuring such an Instance, the placeholders can be replaced with variable names or with text (see chapter 2.4.1, „Configuring an inserted visualization", there you also find an example for using placeholders). Any string enclosed in two dollar signs ($) is a valid placeholder (e.g. $variable1$, variable$x$). For each placeholder a „value group" can be defined as an input specification in the 'Placeholder list' dialog (called from 'Extras' 'Placeholder list'). With one of these values you can replace the placeholder when configuring an instance of the visualization object. A placeholder list will be available in the instance to do those replacements.
'Extras' 'List of Placeholders...' This list is used at two places in CoDeSys: to manage placeholders and to configure them: 1. primarily you use the list when configuring a visualization object, which later should be inserted, which means instanced, in other visualization(s). For this reason you will use placeholders instead of or additionally to variables and strings in the configuration dialogs. You can open the dialog 'Placeholders' by the command 'List of Placeholders' in the 'Extras' menu or in the context menu. The list shows three columns: Column Placeholder will list all placeholders, which are currently used in the configuration of the visualization object. Column Element number shows the elements which contain a placeholder. In column Replacements you can enter one or several strings (text, variable, expression) which you want to get available later when replacing a placeholder during the configuration of an instance of the visualization object. The elements of the selection must be entered separated by commas. If no or an impossible replacement string is specified, then the placeholder can be replaced with any desired text later during the configuration of the visualization's instance. Placeholder list for input of possible replacements for the placeholders
2. later you use the list of placeholders when configuring an instance of the above mentioned visualization object, that means after this object has been inserted (as an 'instance') in another visualization by the command 'Insert' 'Visualization'. For this purpose do the following to open the dialog: Select the inserted visualization, execute command 'Extras' 'Configure' and press button 'Placeholders' in Category 'Visualization'. In this case the dialog will only contain two columns:
CoDeSys Visualization
4-1
1-
List of placeholders for replacing a placeholder in a visualization instance
Column Placeholder – like described above – shows all placeholders which have been defined for the primary visualization object. If additionally a selection of possible replacements had been defined, this list will now be available in column 'Replacement'. Select one of the entries to replace the placeholder in the present instance. If no replacements have been pre-defined then you can manually enter an expression or variable. For this purpose perform a mouse-click on the field in column Replacement to open an editor field.
4-2
CoDeSys Visualization
5 - Visualization in Online Mode...
5
Visualization in Online Mode...
5.1
Overview Regard the following items concerning a visualization in online mode: • Order of evaluation: -
Dynamically defined element properties (by variables) will overwrite the (static) base settings defined by options in the configuration dialogs.
-
If an element property is defined by a "normal" project variable as well as by the component of a structure variable (Programmability), then primarily the value of the project variable will be regarded.
-
A visualization can be configured in that way that in online mode it can be operated solely by inputs via keyboard. This is an important feature especially for using the visualization with CoDeSys HMI, as Target- or as Web-Visualization.
• Before a download of the project regard the current setting of option 'Prevent download of visualization files' in the target settings. This concerns all files which are used in the current visualization will not be downloaded to the target system. Visualization files are only downloaded for Target- or Web-Visualization and can be bitmaps, language files and for Web-Visualization also XML description files. • The configuration settings for Display, Frame and Language can also be edited in online mode. • As long as a visualization "instance" is not configured explicitly, the particular elements of the instance in online mode will react on inputs like those of the original visualization ("mother" of the instances). • When you switch the language ('Extras' 'Settings') this will only effect the display in online mode. • A visualization can be printed in online mode. • If a visualization is used as Target-Visualization, information on user entries via mouse-clicks can be scanned with the help of special interface functions and thus be used in the project.
5.2
Operation over the keyboard - in online mode In order to get independent from the mouse or a touch screen, it is useful to configure a visualization in a way that allows pure keyboard operation: Per default the following key (combinations) will work in online mode anyway (no special configuration necessary): • Pressing the key selects the first element in the element list for which an input is configured. Each subsequent pressing of the key moves one to the next element in the list. Within tables you will get to the next field. Pressing the key while keeping the key depressed selects the previous element. Depending on the target a simplified input handling may be possible (see CoDeSys User Manual,Target Settings for Visualization). • The arrow keys can be used to change from a selected element to a neighbouring one in any direction. • The is used to execute an activity on the selected visualization element. If the element is one which has a text output variable or if it is a table field, a text input field will be opened which displays the text contents of the variable resp. the field. Pressing the key writes in this value.
CoDeSys Visualization
5-1
5 - Visualization in Online Mode...
Additional key (combinations) for the online operation can be defined in the configuration dialog 'Keyboard usage'. There also the keys , and can get assigned other functions than the above described standards. The individual elements of instances behave in Online mode identically to the corresponding ones in the visualization that is instanced. They will therefore react the same way as individual elements to inputs and operation by mouse and keyboard; the display of tooltips in instances is also elementdependent. When processing the element list, as for instance when jumping from one input element to the next using the tabulator, the processing of all individual elements of a instance proceeds from the location of the instance in the element list before jumping to the next element of the list. Note:
5.3
Operation over the keyboard in online mode is of greatest significance, if the visualization should be used with CoDeSys HMI resp. as Target-Visualization or Web-Visualization! In the Web-Visualization a specific setting in webvisu.htm (see chapter 8.3) allows to keep effective the operation over the keyboard even if currently an entry field is opened.
'File' 'Print' in online mode 'File' 'Print'is used to print out the contents of the visualization window in online mode. Visualizations which stretch over the border of the window can lead to inconsistencies particularly when there are moving elements in the visualization.
5.4 Access Protection in multi-client operation Due to the fact that it is possible to connect multiple visualization clients to one PLC Target- and Web-Visualization), multiple clients might access data in the PLC at the same time. If this is not desired, an access protection can be defined by certain INTERN commands (see also chapter 2.4.1), so that always only one client can write the data on the PLC. The following INTERN commands are available for restricting the write access to one client: REQUESTWRITEACCESS
The client requests write access on the visualization. Using the system variable CurrentWriteAccessClientId the client then can check whether it has got write access. This implicit variable stores the identification (ID) of the client which currently has write access. Each client has an unique ID "CurrentClientID". Thus the following expression can be used to allow a certain input on a visualization: CurrentWriteAccessClientId = CurrentClientId (Example: The expression could be used in the configuration of an element to define its visibility : If the expression is TRUE, i.e. the client has write access, then the element is visible, i.e. allows input) The Web-Server will check at each write request, whether the requesting client currently has write access.
RELEASEWRITEACCESS
The client deallocates its write access.
GLOBALRELEASEWRITEACCESS
The write access is deallocated client-independently.
Automatische Rückgabe des Schreibrechts: Wenn während des Monitorings festgestellt wird, dass der aktuell schreibberechtigte Client nicht mehr mit der Steuerung verbunden ist, wird die Variable CurrentWriteAccessClientId auf "-1" gesetzt, was bedeutet, dass kein Client mehr Schreibrecht besitzt. Dies kann auch über die IEC-Applikation erfolgen.
5-2
CoDeSys Visualization
6 - Visualizations in libraries...
6
Visualizations in libraries... Visualizations can also be stored in libraries and thus be made available to projects in the form of library POUs. They can be inserted as instances or they can be called up via the command „Zoom to vis." in the input configuration of another visualization which is part of the project. Note:
Visualizations used in a project must have unique names. It can cause errors if for instance a visualization from a library is called or referenced which has the same name as one present in the project, because in processing instances or visualization calls in the program first the visualizations in the project, and only thereafter the ones in the loaded libraries will be implemented.
CoDeSys Visualization
6-1
6 - Visualizations in libraries...
6-2
CoDeSys Visualization
7 - CoDeSys HMI
7
CoDeSys HMI CoDeSys HMI is the run time system needed for the execution of the well known CoDeSys visualisation. This system enables the user to create inexpensive software for operating machines and plants using the visualisations generated in CoDeSys. CoDeSys HMI uses the already existent project file for the visualisation. Of course it is possible to protect the application program with a read-only protection. The masks then appear in the full-picture mode and merely the visualisation starting with the picture “PLC_VISU” is shown. All the other operational elements of CoDeSys like menus or the object organiser are not visible. By seamlessly integrating the development platform for the visualisation masks into the PLC programming system CoDeSys HMI offers advantages other visualisations simply cannot come up to: • A tag list of the variables to be used is not needed. It is possible to work directly with the CoDeSys variables. • Variable values in input fields can be modified by expressions (e.g. “Variable1+ Variable2 * 12 + 5”) • A mighty place-holder concept allows the user to create object-oriented masks. This means the user can build modules similar to the CoDeSys function blocks in the visualisation. The CoDeSys functions “Sampling Trace“ and “read/write recipe“ are also available in CoDeSys HMI.
7.1
Installation, Start and Operating CoDeSys HMI can be installed with the standard CoDeSys setup. If no valid license is available, a time-limited demo version can be used. CoDeSys HMI (CoDeSysHMI.exe) is started by a command line: In each case at least the desired CoDeSys project has to be given in the command line. If no further parameters are set there, CoDeSys HMI automatically will start with a visualization POU named PLC_VISU (if existent in the project) and on that target or simulation mode, which was set when the project had been saved last. Additionally as well the known command line and command file commands (see User Manual for CoDeSys) as the following special parameters can be used: "/simulation" "/target"
resp. Per default it will be started in that mode which was set when the project was saved last. Using the parameter "/simulation" resp. "/target" in the command line it can be set explicitly whether the project should run in simulation mode or on the target.
/visu
If the project contains a visualization POU named PLC_VISU, it will start automatically with this one. If another POU should be the entrance, it has to be set in the command line with "/visu ".
/visudownload
Overrides the download lock: If the user tries to log in with a project, which is different to that on the PLC, per default a download of the new project (dialog) can be initiated. If however there is an entry "visudownload=no" in the codesys.ini file, then no download is possible. This lock can be overridden by the command line parameter "/visudownload".
/visucompactload
This parameter can be used for optimization at starting a project for which no download is required. If a download gets necessary anyway, e.g. effected by parameter "/visudownload", "/visucompactload" will be ignored.
Example for a command line:
D:\PROGRAMME\CoDeSysHMI /simulation D:\PROJECTS\PROJECT.PRO /visu overview The project project.pro will start in simulation mode and with the visualization POU 'overview'.
CoDeSys Visualization
7-1
7 - CoDeSys HMI
Please regard: Paths containing spaces must be bordered by quotation marks (").
The project will start in full screen mode with the entrance POU. CoDeSys HMI can be operated corresponding to the functions of the visualization elements via keyboard and mouse. If there is no visualization element configured with a corresponding function, CoDeSys HMI at any time can be terminated by pressing +.
7-2
CoDeSys Visualization
8 - Web-Visualization
8
Web-Visualization The Web-Visualization is a target specific application of a CoDeSys visualization. CoDeSys can create XML descriptions of the visualization objects and download them to the PLC. There a Web-Server will provide the PLC data in XML format too and thus can create a continuously updated visualization which can be opened in the Web Browser of any computer which is connected via Internet, independently from the target platform (e.g. useful for remote maintenance purposes). The Web-Server can connect dynamically to several controllers if configured appropriately. Visualization elements can be configured in a way that they will effect a connection change to another target system (see chapter 8.7).
8.1
Preconditions In order make visualization created in CoDeSys available as Web-Visualization, the following preconditions must be fulfilled: • The target system must support the functionality; that means that in the target settings the option 'Web-Visualization' must be activated. If defined in the target file, this can be done by the user in the 'General' target settings. • A correctly configured WebServer must be started. (see below) • In order to get the Web-Visualization displayed on a computer, a Web-Browser (IE-Explorer or Netscape) is required. • Operating system: Windows NT/2000, Windows CE, Linux, RTE Note:
8.2
Before a download regard the current setting of option ‘Prevent download of visualization files' in the target settings. This concerns all files which are used in the current visualization. Those can be bitmaps, language files and for Web-Visualization also XML description files.
Status check, Auto-Reload, File error_ini.xml If a configuration file error_ini.xml is provided by the manufacturer for the target system, status changes of the PLC resp. the visualization project are notified as messages. Usually in this case communication errors, start/stop of the PLC, breakpoint states, new download etc. will be reported in message boxes. The ini-file however also might define error messages like "page cannot be displayed", "too many variables to be monitored" or the like. Also as a reaction on a download or online change of the project an automatic reload of the Web-Visualization might be defined.
CoDeSys Visualization
8-1
8 - Web-Visualization
The time interval for a cyclic status check can be defined in the file WebVisu.htm (PLCSTATEINTERVAL). Note:
8.3
A communication failure during the monitoring of the Web-Visualization will not be dumped as an error message, but will be displayed in the status line of the webbrowser.
Editing the WebVisu.htm file During CoDeSys installation the file WebVisu.htm (base-HTML-page for the Web-Visualization) gets copied to the subdirectory "visu" in the installation directory. This is the basic html-page for the WebVisualization. Before it gets downloaded to the target system together with the Web-Visualization project, it can be edited in a text editor in order to change the behaviour of the Web-Visualization: Webvisu.htm per default contains the following: Applet HTML Page
The following parameters can be set to control the behaviour of the Web-Visualization: • Width, height - Definition of the size of the screen. Regard the possibility to make visible this size already during creating a visualization in CoDeSys (Target Settings: Display width/height in pixel). • STARTVISU - Definition of the start POU (Default: PLC_VISU) • UPDATETIME - Definition of the monitoring interval (msec) • USECURRENTVISU - Definition whether an automatic change to another visualization will be done, as soon as the system variable 'CurrentVisu' (see chapter 2.1) is changed by the PLC program. (For information on implicit variables see 10.) Optionally the file can be extended by the following entries in the APPLET definition part:
If this parameter is TRUE, a fix socket connection will be used for monitoring; if it is FALSE or if the entry is missing at all, for each monitoring request a new socket will be used. Default: FALSE. Attention: If parameter USEURLCONNECTION (see below) is used, USEFIXSOCKETCONNECTION may not be set TRUE.
The visualizations specified here will be loaded already when the Web-Visualization is loaded, not just when they are opened for the first time. Thus time is saved at later changes of visualizations, because then the data not have to be transferred first by the WebServer. Examples: The files to be transferred for the Web-Visualization to the Web-Server can be provided by CoDeSys in a packed format ("_.zip"). See for details: CoDeSys User Manual CoDeSys_V23_E.pdf, Target Settings / Visualization. If parameter "COMPRESSEDFILES" is set TRUE, the Web-Visualization first will try to load 8-2
CoDeSys Visualization
8 - Web-Visualization
from the Web-Server all needed files which have got appended the extension „.zip“and to unzip those. If the request for a zip-file fails, it will be tried to load the original file. If parameter "COMPRESSEDFILES" is not available or is configured with value FALSE, any available zip-files will be ignored.
If this parameter is configured, the communication will be done via the specified URLconnection. Per default a simple socket connection is used. Attention: If parameter USEFIXSOCKETCONNECTION (see above) is set TRUE, USEFIXSOCKETCONNECTION may not be used additionally. Example:
This parameter defines how many trials will be done to get a visualization file transferred from the Web-Server, before an applet error will appear. ">
If a touch panel is used for working with the Web-Visualization, this parameter should be set TRUE in order to get an input possibility in any case for each dialog; if applicable via numpad/keypad. ">
If this parameter is set TRUE, the keyboard usage is always active, even if a modal dialog - like e.g. the numpad - is currently opened. ">
This parameter only should be set TRUE, if the Web-Server supports multi-client processing and if an access lock for various clients is desired. Concerning access control in multi-client operation please see HERE. ">
If this parameter is set TRUE and the language switching is done via ASCII language files, the default encoding - currently set in the system - will be used for the interpretation of the language file. ">
If the default encoding of the system is not set as desired, you can define here the desired encoding by entering the appropriate string. Examples for encoding strings: German: "ISO-8859-1" Russian: "ISO-8859-5" Japanese: "MS932" ">
Cycle time in milliseconds according to which the Web-Client will check the PLC status. It will be checked whether the PLC is in Start or Stop status and whether a download has been done. ">
This parameter can be set in order to change the update of the alarm states. Due to the fact that not all alarm states can be updated within one cycle, it might be useful to exactly defined the number of alarms which should be updated per cycle. This number can be specified as a numeric value. ">
If this parameter is set TRUE, the tooltip functionality in the alarm table will be activated. This means: If any text entry in the alarm table cannot be displayed completely, a tooltip will be
CoDeSys Visualization
8-3
8 - Web-Visualization
available showing the full text string as soon as the mouse pointer is moved on the respective table cell. ">
This parameter serves to define the font for all tooltips. Syntax: Font|Size; Example: „Arial|11“. ">
This parameter serves to define the font for the File-Open-dialog. Syntax: Font|Size; Example: „Arial|11“. ">
This parameter serves to define the font for the alarm NAME|HEIGHT|WEIGHT|CHARSET|ITALIC|HORZ_ALIGN|VERT_ALIGN
table.
Syntax:
Example: „Arial|11|0|0|false|left|center“.
If this parameter is set TRUE, the current language setting always will be synchronized between Web- and Target-Visualization (via implicit variable CurrentLanguage); i.e. at a language switch caused by an input in one of the both visualization types each in the other type the language will be switched too. (The CoDeSys Visualization currently is not included in this match).
8.4
Preparing a Web-Visualization in CoDeSys • Create the visualization(s) for your PLC program as usual in the CoDeSys programming system. If you want a certain visualization to be called as starting object, then name it 'PLC_VISU'. It will be loaded automatically as soon as the visualization is called via the Internet. Regard the effects of the currently active target settings, category Visualization (see CoDeSys User Manual CoDeSys_V23_E.pdf). • For visualization objects, which should not be part of the web version of the visualization, deactivate option Web-Visualization' in the dialog 'Object' 'Properties' in category 'Visualization'. • Regard the possibility to use visualization elements for the purpose of switching between several controllers (see chapter 8.7), to which the WebServer then will connect automatically. • If needed, modify the basic html-page WebVisu.htm (see chapter 8.2). For example instead of PLC_VISU another visualization can be defined as start page of the Web-Visualization. • Perform command 'Project' 'Clean all', then 'Project' 'Build'. Before downloading the project regard the current setting of option ‘Prevent download of visualization files' in the target settings. This concerns all files which are used in the current visualization. Those can be bitmaps, language files and for Web-Visualization also XML description files. • Log in to the target system ('Project' 'Online' 'Login') and start the project on the PLC.
8.5
Configuration and Start of the Web Server • The Web Server must be available as an appropriate executable file (*.exe) for the used target system. It also can be installed and started as a service. The following command line parameters can be used for this purpose when webserver.exe is started: -i = Web-Server gets installed as a service -u = Web-Server service gets uninstalled -s = Web-Server service gets started -e = Web-Server service gets terminated • The configuration of the server can be done by a configuration file or - restricted usable - by parameters added in the command line when calling the server-exe. The definitions given by a
8-4
CoDeSys Visualization
8 - Web-Visualization
configuration file will overwrite those of the command line. The possible parameters: webserver-port-nr
Port, on which the WebServer expects requests of the client (Web-Browser)
Default: 80
target-port-nr
Port of the runtime system
Default: 1200
target-ip-address
IP-Address of the runtime system
Default: localhost
use-file-upload-dir
If this flag is set to TRUE, additionally the fileupload-directory (see below, file-upload-dir) must be defined, where the *.xml, *.bmp, *.jpg, etc. files of the Web-Visualization are stored on the target system and from where they are uploaded to the browser.
Default: false
file-upload-dir
Directory for the Web-Visualization files
Default:“”
use-intel-byte-order
Type of byte-order (true or false): if "false, the data will get swapped (Motorola Byte-Order).
Default: true
The following entries refer to the use of a description file for the PLC-Handler in order to be able to use the MultiPLC-functionality. If these entries are missing, automatically the TCP/IP-connection to the above specified target system will be used. plc-description-file
Path of the ini-file for the PLCHandler, describing the communication parameters for all PLCs (controllers) to which the WebServer then can connect via Gateway/PLCHandler.(Per default the ini-file is in the same directory as webserver.exe). If the visualization (Web-Client) via INTERNcommand CONNECT_TO tells to which PLC a connection should be established, this connection will be built automatically by the server and will be maintained until the next change.
Default: “”
plc-entries
Section containing the entries for the various PLCs.
Default: “”
plc-entry
Entry for a PLC, contains PLC name and directory.
Default: “”
Name of the PLC, PLCHandler.ini-file.
the
Default: “”
Directory of the PLC files; can be defined absolutely or relatively to the file-upload directory (see above). Example: For the example configuration shown below a definition ".\FD" for the plc-directory results in the following location: "C:\Programme\CoDeSysV23\FD"
Default: “”
plc-name plc-directory
as
defined
in
Please regard: If you define a "file-upload" directory, where the controller can store the visualization download files, then the visualization files will be automatically updated at each download. The advantage of this upload-directory is that the controller is not involved and thus not strained. The Web Server gets the files directly from the directory and by this the data transfer is much quicker. This is especially of impact in case of a big amount of data.
A configuration file for the Web Server must be available in XML-format and it must be named "webserver_conf.xml". It must be found in the directory where the webserver-exe is. If no configuration file is available, the above mentioned default settings will be used (if not changed by parameters added to the call of the server in a command line.) An example configuration in the webserver_conf.xml file could look as follows:
CoDeSys Visualization
8-5
8 - Web-Visualization
8080 1200 localhost true C:\Programme\CoDeSysV23\ true PlcHandler.ini MASTER .\MASTER FD .\FD DL .\DL
A call in a command line must use the following syntax: WebServer [webserver-Port-nr] [target-port-nr] [target-IP-address] | [file-uploaddir]
Only these parameters can be used in a command line. The others described above, concerning byteorder and multiPLC-functionality must come via the configuration file. Thus a call corresponding to the above shown configuration example would look like follows, whereby the settings for and must be available in a configuration file: > webserver 8080 1200 localhost c:\Programme\CoDeSysV23 Note:
8.6
The parameter settings in the command line are without any effect, if there is a valid configuration file available.
Calling a Web-Visualization via Internet Insert the following address in the Browser: http://:/webvisu.htm Example:
http://localhost:8080/webvisu.htm WebVisu is the default HTML-file. It contains a tag which will start the WebVisu-Applet so that the desired start page of the visualization will be displayed. Now you can start to operate the visualization. Note:
8-6
If the browser accepts cookies (if necessary, activate this option) the current language setting for dynamic texts will be stored and at the next call of the Web-Visualization will be re-used automatically. If the stored language is not available in the newly opened visualization, the default language of this visualization will be used. If no default language is defined, the visualization texts will not be translated until the language gets switched explicitly.
CoDeSys Visualization
8 - Web-Visualization
8.7
Restrictions and Special Features The following features are not yet realized in the Web-Visualization: INTERN commands PRINT
Printout of the current visualization.
Execute external program
Execution of an external program.
LANGUAGEDIALOG
The configuration dialog containing the category 'Language' will be called.
EXITPROGRAM
The program will be exited. Can be realized via command INTERN LINK.
TRACE
Open Sampling Trace window. This function will be taken by the Trend element.
SAVEPROJECT
Saving the project. This function cannot be realized for the Web-Visualization.
Accessing variables Dynamc indexing within an Array
„Array1[Index].a“ is not possible, however „Array1[10].a“ is possible. The diynamic indexing will be realized with CoDeSys 3.0.
Replacing placeholders containing an expression
Placeholder: $abc$ + 5 Replacement: PLC_PRG.n + 500 -> should result in PLC_PRG.n + 500 + 5, this however is not possible in the Web-Visualization. This function will be realized with CoDeSys 3.0.
Pointer variables
Pointer variables like PLC_PRG.pdw2^ cannot be monitored. This function will be realized with CoDeSys 3.0.
Others Transparent bitmaps
Transparent bitmaps are not yet supported.
Alarm handling Actions
Action „Print“ is not yet supported.
Settings for sorting
The sorting within the alarm table, displayed via button 'History', always is according to date. The settings as done in the configuration of the alarm table element are not regarded.
The following features are only suported by the Web-Visualization: INTERN commands INTERN LINK
Via “INTERN LINK ” a change to another web page can be defined. (Example: "INTERN LINK http://www.3s-software.com") “INTERN LINK ” opens a PDF file, which must be available on the server. (Example: "INTERN LINK http://localhost:8080/test.pdf ") “INTERN LINK ” opens a window for sending an E-Mail. (Example:"INTERN LINK mailto:
[email protected]")
INTERN CONNECT_TO |
The target PLC can be changed if the WebServer is configured appropriately with the connection parameters for multiple PLCs (see Configuration and Start of the Web Server). PLC-Name: Name of the PLC, as defined in the ini-file of the PLCHandler. Start-Visu: Name of the visualization which should be displayed at start of the Web-Visualization. As soon as the WebServer gets the request for a PLC-change, it will automatically establish the connection to the respective PLC. The following diagram shows a possible navigation scenario with multiple
CoDeSys Visualization
8-7
8 - Web-Visualization
PLCs:
8-8
Language for dynamic texts
If the web browser accepts cookies (if necessary, activate this option) the current language setting for dynamic texts will be stored and at the next call of the Web-Visualization will be re-used automatically. See the note in chapter 8.6.
Using a HTTP-ProxyServer
If a HTTP-Proxy-Server is used, additionally a SOCKS-Proxy-Server might be necessary in order to avoid monitoring problems. See chapter 8.1.
CoDeSys Visualization
9 - Target-Visualization
9
Target-Visualization The Target-Visualization is one of the possible ways to use a CoDeSys Visualization. CoDeSys can create ST code (Structured Text) for the visualization objects of a project. This code can be downloaded to the PLC together with the normal project code. Note:
Before download regard the current setting of option ‘Prevent download of visualization files' in the target settings. This concerns all files which are used in the current visualization. Those can be bitmaps, language files and for Web-Visualization also XML description files.
Thus, if it is supported by the target system and if an appropriate monitor is available, the visualization can be started directly on the PLC computer. It is not necessary any longer that the programming system is running in order to run the visualization. This means a considerable reduction of storage use.
9.1
Preconditions • The target system must support the functionality; that means that in the target settings the option 'Target-Visualization' must be activated. If defined in the target file, this can be done by the user in the 'General' target settings. • The library SysLibTargetVisu.lib (external) is required for implementing the visualization functions in the runtime system. Among other things it provides functions for scanning mouse-actions performed by the user and language depending texts from a dynamic textlist, which thus can be directly used in the program. It will be linked to the project as soon as the option 'TargetVisualization' is activated in the target settings. In the runtime system the SysLibTargetVisu.lib also must be implemented. Regard that also the following, implicitly used libraries will be loaded automatically as soon as the option 'Target-Visualization' is activated: SysLibAlarmTrend.lib, SysLibSockets.lib, SysLibFile.lib, SysLibTime.lib, SysLibMem.lib.) • Operating system of the PLC computer: Windows NT/2000, Windows CE. • The PLC computer needs devices for displaying and operating the visualization (monitor, keyboard etc.). • Regard when using a HTTP-Proxy-Server: If the communication within the Internet browser is done via a HTTP-Proxy-Server, the monitoring of the visualization data might cause problems. If "USEFIXSOCKETCONNECTION" in WebVisu.htm is set TRUE, the telegram format used for the process data communication between applet and Web Server will not match the HTTP standard. In this case the HTTP Proxy will not forward the telegrams to the Web Server. A workaround is to configure a SOCKS-Proxy:.Clients behind a firewall which want to establish a connection to an external server, instead have to connect to a SOCKS-Proxy. This Proxy-Server checks whether the client is authorized to communicate with an external server and forwards the requests transparently to the server. The SOCKS protocol is an Internet-Proxy protocol, allowing clientserver applications to transparently use the services of a firewall. SOCKS is an abbreviation for "SOCKets". Note:
9.2
Before downloading the project regard the current setting of option 'Prevent download of visualization files' in the target settings. This concerns all files which are used in the current visualization. Those can be bitmaps, language files and for Web-Visualization also XML description files.
Creating a Target-Visualization 1. Create a visualization in CoDeSys. In order to optimize the performance of the visualization, put as many elements, which are static (no movement, no dynamic texts, no dynamic color changes), to the back. Hint: Using 'Extras' 'Elementlist' several or all elements can be "Sent to back" or "Sent to front" in a single blow. (Explanation: All static elements only once will be drawn to a background bitmap. Thus the cyclic repaint time will be reduced. This will be profitable especially for complex polygons or bitmaps.)
CoDeSys Visualization
9-1
9 - Target-Visualization
A further improvement concerning the performance might be reached by switching off the Keyboard usage for tables (see CoDeSys V2.3 User Manual, App. H, Target Settings in Category Visualization). Please regard also: In order to save memory space when later used in a Target-Visualization, the configuration dialogs for visualization elements might offer restricted color- and font options, defined by manufacturer-specific target settings. If there is a visualization object PLC_VISU, the Target-Visualization later will be started with this object. Otherwise it will start with that object which is the first one in the list of visualization objects in the Object Organizer. Consider whether implicit visualization variables in the current project should be handled as remanent variables and add the appropriate declarations in the Global Variables list (see 9.4). Please regard: For target computers running with Windows NT/2000, Windows CE the bitmaps of the visualization will be transferred as files.
2. For each visualization object, which should not be part of the Target-Visualization, deactivate the option 'Target-Visualization' in the Object Properties dialog ('Project' 'Object' 'Properties') in category 'Visualization'. 3. Make sure that the option 'Optimized jumps' is deactivated in the target settings (Target Platform). 4. In the Target Settings in tab 'Visualization' (it depends on the target system, whether the particular options are available in this dialog!) configure that the project should be prepared for use in the Target Visualization: Activate option ‘Target visualization’. Regard also the current setting of option ‘Prevent download of the visualization files' in the target settings. This concerns all files which are used in the current visualization. Those can be bitmaps, language files and for Web-Visualization also XML description files. Additionally here you can define whether the user inputs and the re-painting of the visualization elements.... ... should be controlled via VISU-tasks which are generated automatically or via individual programming: Activate option 'Deactivate task generation'. ... should be processed by one or by two POUs resp. tasks: Activate option 'Use VISU_INPUT_TASK'. (Don't get irritated by the term "..._TASK" in this case; this option is also of effect if no VISU_INPUT_TASK is generated. Please see the descriptions in the following table.) Thus, besides the possibility of deactivating the keyboard usage for table, the following configurations are possible: (a) The Target visualization is controlled by VISU-tasks which are generated automatically and which call the POUs MAINTARGETVISU_PAINT_CODE and MAINTTARGETVISU_INPUT_CODE: Deactivate task generation is switched off: (a1)
Use VISU_INPUT_TASK is activated: Automatically two tasks will be generated, each calling a program:
• VISU_TASK calls the implicitly available POU MAINTARGETVISU_PAINT_CODE, which does the repainting of the visualization elements.
• VISU_INPUT_TASK calls the implicitly available POU MAINTARGETVISU_INPUT_CODE, which does the processing of the user inputs.
9-2
CoDeSys Visualization
9 - Target-Visualization
The default settings of the tasks: - VISU_INPUT_TASK: cyclic, priority 14, interval t#200ms. - VISU_TASK: cyclic, priority 15, interval t#50ms. Of course the parameters can be modified. But: VISU_INPUT_TASK always should be processed before VISU_TASK in order to guarantee a useful interaction of user inputs and update of the visualization. The task calling the main program (e.g. PLC_PRG), should at least be processed as often as VISU_INPUT_TASK, ideally even with a higher priority, but it also could be added directly to VISU_INPUT_TASK. (a2)
Use VISU_INPUT_TASK is deactivated: Only task VISU_TASK will be generated automatically, but in this case will include the functionality of VISU_INPUT_TASK. The implicit program POU MAINTARGETVISU_ PAINT_CODE in this case additionally will include the functionality of program MAINTTARGETVISU_INPUT_CODE. This configuration is intended for systems which do not allow multi-tasking. Disadvantageously no differentiated cycle times can be configured for the processing of user inputs and the repainting of the visualization elements, see above.
(b) The Target visualization is not controlled by automatically created tasks; the implicitly available POUs MAINTARGETVISU_PAINT_CODE and MAINTTARGETVISU_INPUT_CODE can be called by the application program resp. can be appended to any task: Deactivate task generation is activated: (b1)
If additionally option Use VISU_INPUT_TASK is activated, both implicit POUs are available and can be called individually resp. can be appended to any task. (Referring to this regard the hints in (a1). n:=n+1; IF n=(n MOD 4) THEN MAINTARGETVISU_INPUT_CODE(); END_IF; MAINTARGETVISU_PAINT_CODE();
Example for calls of the Target-Visulization POUs in the application program: Here in program visu_control the POU which processes the user inputs is only called after each fourth call of the repainting POU - thus reducing the danger of getting disturbed the repainting by another user input. When creating the application program, absolutely pay attention to reduce this danger of incorrect display! Example for use of any desired task for controlling the Target visualization POUs; here the above shown program visu_control is called by task visu.
CoDeSys Visualization
9-3
9 - Target-Visualization
If option Use VISU_INPUT_TASK is not activated, only the implicitly available program POU MAINTARGET VISU_PAINT_CODE can be used, but in this case it will additionally include the functionality of MAINTARGET VISU _INPUT_CODE. This POU can be called in the application program resp. can be appended to any task.
5. Load the project into the controller ('Online' 'Login')
9.3
Starting the Target-Visualization Start the loaded project on the PLC. Hereupon the visualization will start with the PLC_VISU object resp. – if no PLC_VISU is available – with that visualization object which is the first one in the list of visualization objects in the Object Organizer.
9.4
Scan of mouse-clicks and dynamic texts The library SysLibTargetVisu.lib, which gets included automatically as soon as target setting 'TargetVisualization' is activated, offers the following functions for scanning mouse-clicks performed by the user resp. entries of the dynamic textlist currently used for language dependent text display in the visualization. Function GetText : BOOL This function provides a language depending text from the currently used dynamic textlist. Parameters: stResult: STRING(256);
Serves as an IN_OUT parameter and gets assigned the text found by prefix string „stPrefix“ and ID „dwID“.
nResultLength:INT;
Define here the maximum length of the string „stResult“, if this is